Chord Energy: Q2 profit tripled, but a third of it came from a one-off
5 августа Chord Energy Corporation раскрыла результаты за второй квартал 2026 года. Выручка выросла на 84,0% год к году, до 2 172,7 млн долларов, скорректированная EBITDA – 923,5 млн, чистая прибыль – 525,2 млн против убытка 389,9 млн годом ранее. Бумага выглядит привлекательно: EV/EBITDA LTM 3,38 против собственной трёхлетней средней 4,05, долг – 0,47 EBITDA LTM, дивидендная доходность 3,48%.
Key takeaways
— Revenue grew 84.0% not only on oil: purchased oil and gas brought in $678.4 million
— EBITDA margin of 46.7% versus minus 2.2% a year earlier – the gap was created by last year's $539.3 million impairment
— Net income of $525.2 million includes one-off items; adjusted net income was $361.7 million
— Operating cash flow of $1,116.2 million with capex of $416.7 million – free cash flow of $413.4 million
— Debt of $1,500.0 million against LTM EBITDA of $2,831.8 million – a ratio of 0.47, with 54% of free cash flow returned
— Dividend of $1.30 per share at a 3.48% yield – payout below most independent producers
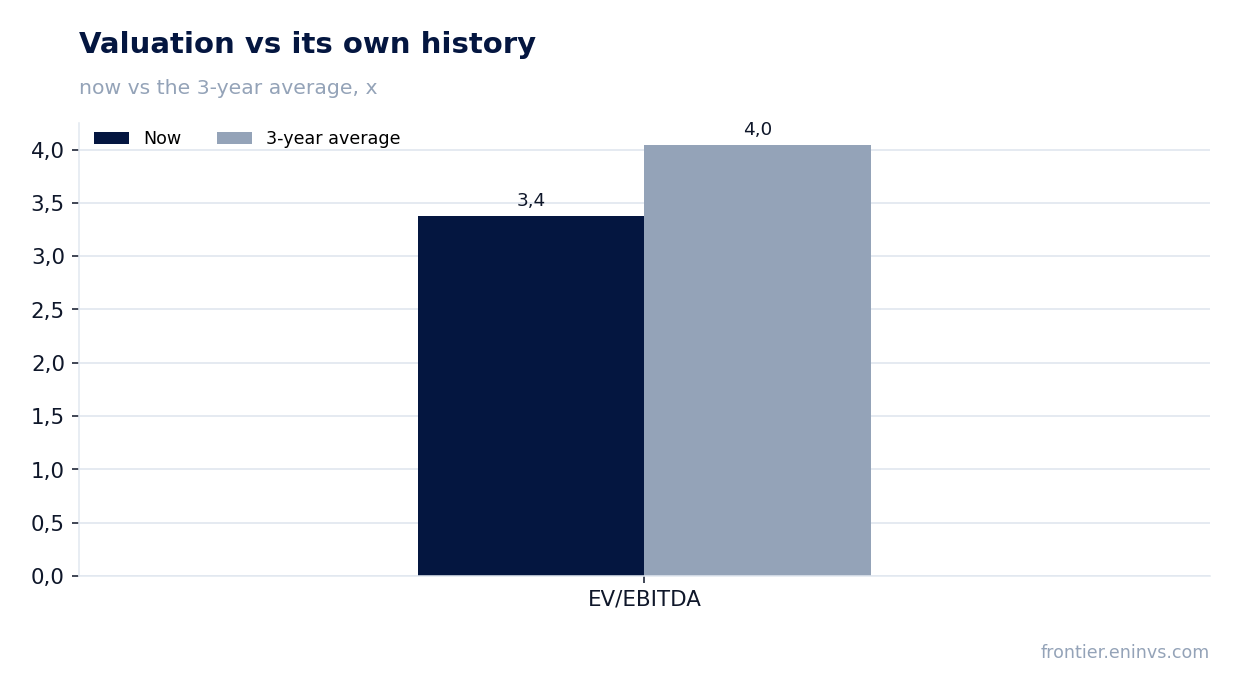
— EV/EBITDA of 3.38 versus a three-year average of 4.05 – a discount to its own history amid rising revenue
Attractiveness
Key figures, USD bn
| Metric | Q2 2025 | Q2 2026 | Change |
|---|---|---|---|
| Revenue | 1.18 | 2.17 | +84.0% |
| EBITDA | -0.03 | 1.01 | to profit |
| Operating profit | -0.40 | 0.61 | to profit |
| Net profit | -0.39 | 0.53 | to profit |
| Operating cash flow | 0.42 | 1.12 | +165.9% |
| Capex | 0.40 | 0.40 | +2.2% |
| EBITDA margin | -2.2% | 46.7% | +48.9 pp |
| Net margin | -33.0% | 24.2% | +57.2 pp |
Revenue grew 84.0% not only on oil: purchased oil and gas brought in $678.4 million
Q2 2026 revenue reached $2,172.7 million, up 84.0% year-on-year. This growth is explained by two factors: the oil price excluding hedges rose to $93.99 per barrel from $61.62 a year earlier, and oil production volumes reached 165.4 thousand barrels per day, 5.6% higher than in Q2 2025.
However, a significant portion of the revenue increase came from the purchased oil and gas segment: revenue from this line amounted to $678.4 million versus $230.3 million a year earlier. This segment has low margins – the corresponding expenses reached $671.7 million, meaning gross profit from it was only $6.7 million. Excluding purchased volumes, revenue from own production rose to $1,494.3 million from $950.3 million, or 57.2%.
The growth in own-production revenue was driven by both price and volume. The average oil sales price excluding derivatives rose 52.5% to $93.99 per barrel, while oil production increased by 8.7 thousand barrels per day. Total production in oil equivalent reached 286.4 thousand barrels per day, 1.6% above the Q2 2025 level.
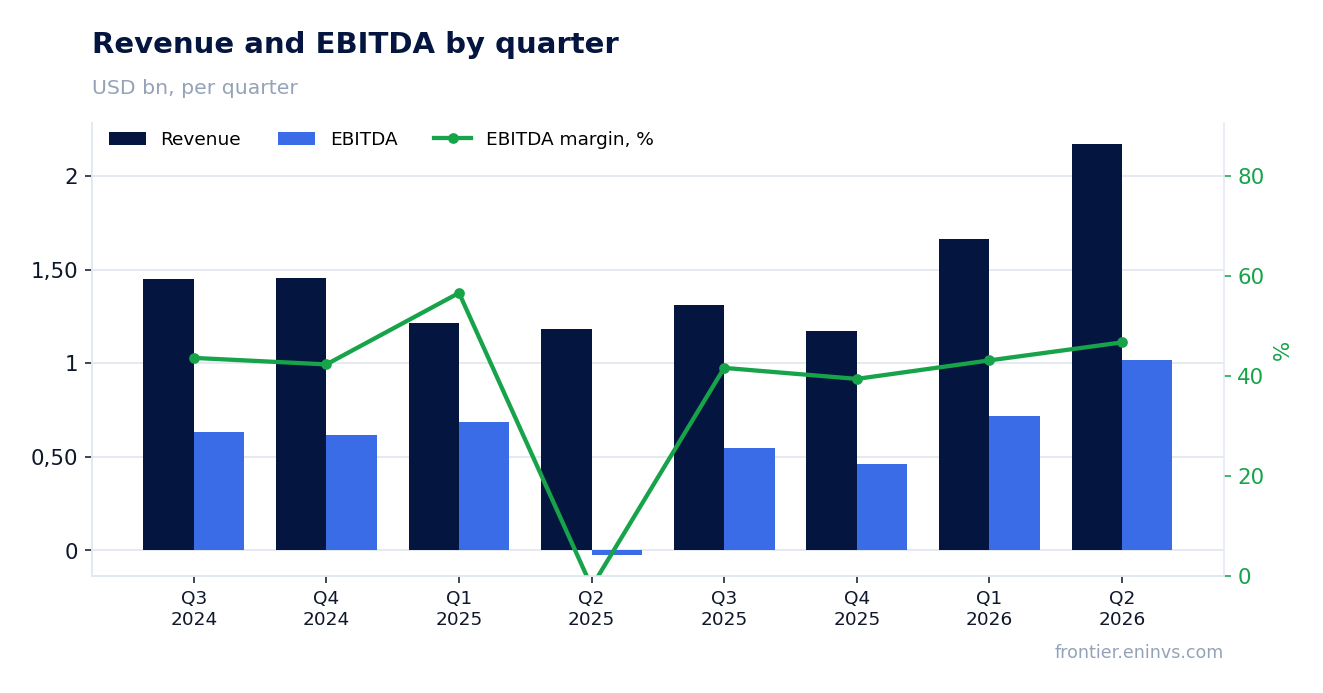
EBITDA margin of 46.7% versus minus 2.2% a year earlier – the gap was created by last year's $539.3 million impairment
The EBITDA margin in Q2 2026 was 46.7% versus a negative minus 2.2% a year earlier. This contrast is explained mainly by the fact that in Q2 2025 the company recognised a non-cash goodwill impairment of $539.3 million, which crushed operating profit and EBITDA that period.
Excluding this one-off charge, Q2 2025 EBITDA would have been $547.2 million, with a margin of about 46.4%. Thus, the current margin level is close to last year's adjusted figure and reflects not so much an efficiency gain as a normalisation of reporting after a one-off hit.
Adjusted EBITDA in Q2 2026 was $923.5 million versus $547.2 million a year earlier. This 68.8% increase was driven by higher oil prices and increased production volumes, as well as lower unit costs: LOE per barrel of oil equivalent was $10.28 versus $10.02 a year earlier, but total operating expenses rose disproportionately to revenue.
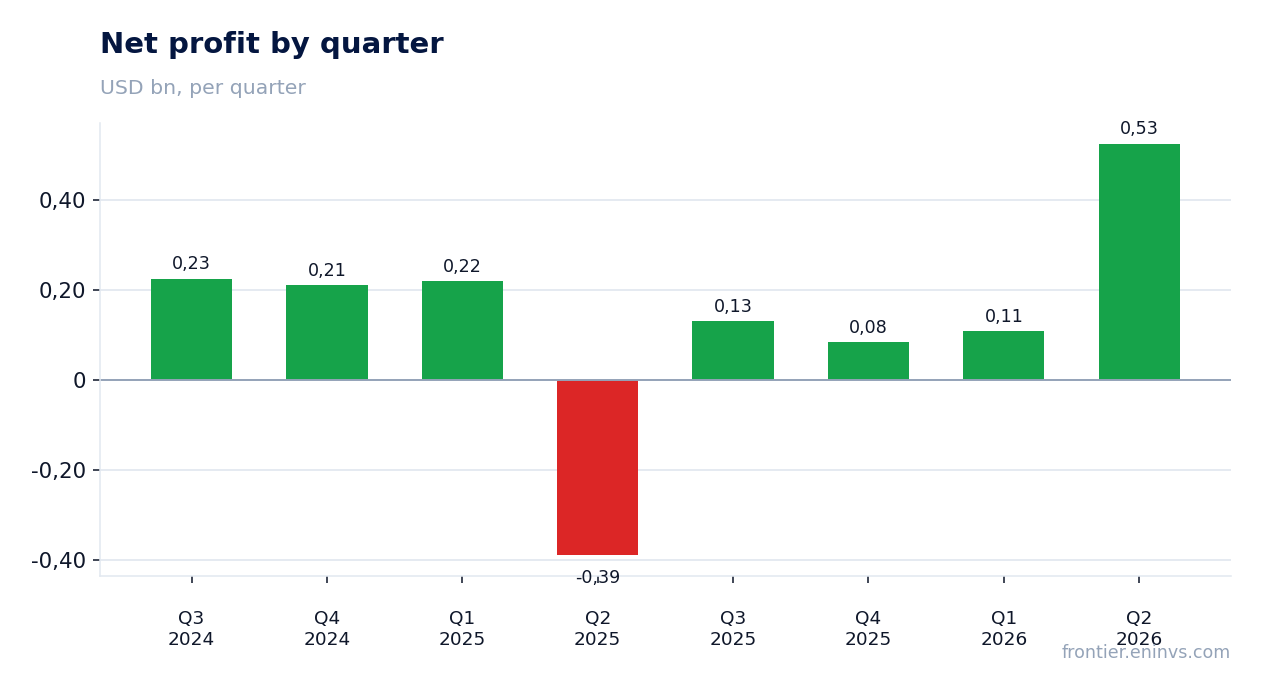
Net income of $525.2 million includes one-off items; adjusted net income was $361.7 million
Net income in Q2 2026 was $525.2 million, or $9.28 per diluted share, versus a loss of $389.9 million a year earlier. However, non-cash and one-off items played a significant role in this profit: net gain on derivatives was $107.9 million, gain from equity investments was $1.1 million, and the company also recorded other non-cash adjustments of $11.5 million.
Adjusted net income, which the company considers more representative, was $361.7 million, or $6.44 per share. The $163.5 million difference between reported and adjusted profit is explained mainly by the exclusion of unrealised derivatives and the effect of investments, as well as the tax effect on these items.
It is worth noting that a year earlier the company posted a loss due to the goodwill impairment, so the year-on-year comparison of reported profit does not reflect operating dynamics. Adjusted profit rose from $103.2 million in Q2 2025 to $361.7 million, which is more consistent with the growth in EBITDA and revenue.
Operating cash flow of $1,116.2 million with capex of $416.7 million – free cash flow of $413.4 million
Operating cash flow in Q2 2026 was $1,116.2 million, significantly higher than $419.8 million a year earlier. This growth is linked to increased revenue and profit, as well as a working capital change that provided an inflow of $224.8 million – likely due to growth in accounts payable and accruals.
Capital expenditures were $416.7 million, 17.2% higher than in Q2 2025 ($355.6 million). The company notes that capex was slightly below the midpoint of guidance, while oil production volumes were at the high end of guidance. Free cash flow, calculated by the company as Adjusted Free Cash Flow, was $413.4 million versus $140.8 million a year earlier.
The difference between operating cash flow and free cash flow is explained by capital expenditures, cash interest and taxes. The company allocated $147.7 million to dividends and $147.4 million to share repurchases, totalling 54% of free cash flow. In Q3, the company plans to increase returns to 75% of free cash flow.
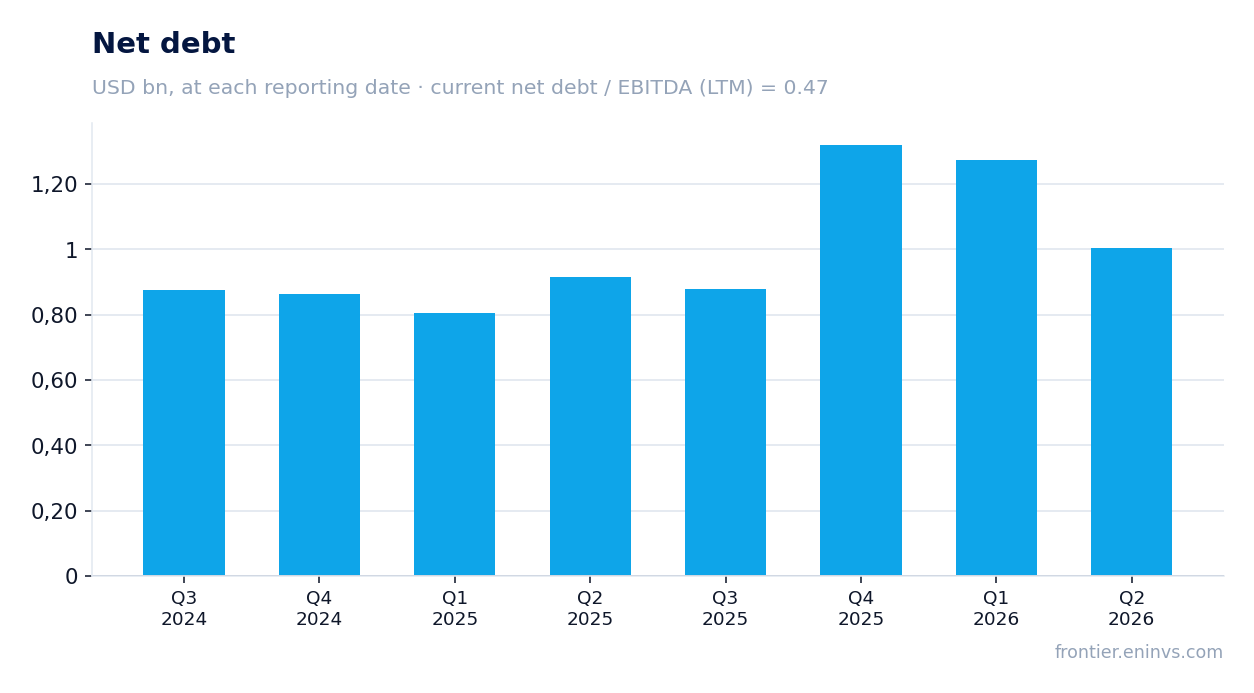
Debt of $1,500.0 million against LTM EBITDA of $2,831.8 million – a ratio of 0.47, with 54% of free cash flow returned
As of the end of Q2 2026, total debt was $1,500.0 million, including $1,500.0 million in senior notes and no borrowings under the revolving credit facility. Cash and equivalents were $611.6 million, and net debt was $1,320.9 million. The net debt to LTM EBITDA ratio was 0.47, a low level for the industry.
The reduction in debt compared to the previous reporting date was 0.4 billion rubles, but the company does not disclose the dynamics of the ratio. It is important to note that net debt over the last 12 months has remained virtually unchanged – a decrease of 0.0 billion rubles. This means the company directs a significant portion of free cash flow to shareholder returns rather than early debt repayment.
Interest expenses in Q2 were $26.7 million, with cash interest at $26.0 million. At the current level of debt and EBITDA, interest coverage remains comfortable. The company has significant liquidity: $2,581.2 million, including $2,000.0 million available under the credit facility.
Dividend of $1.30 per share at a 3.48% yield – payout below most independent producers
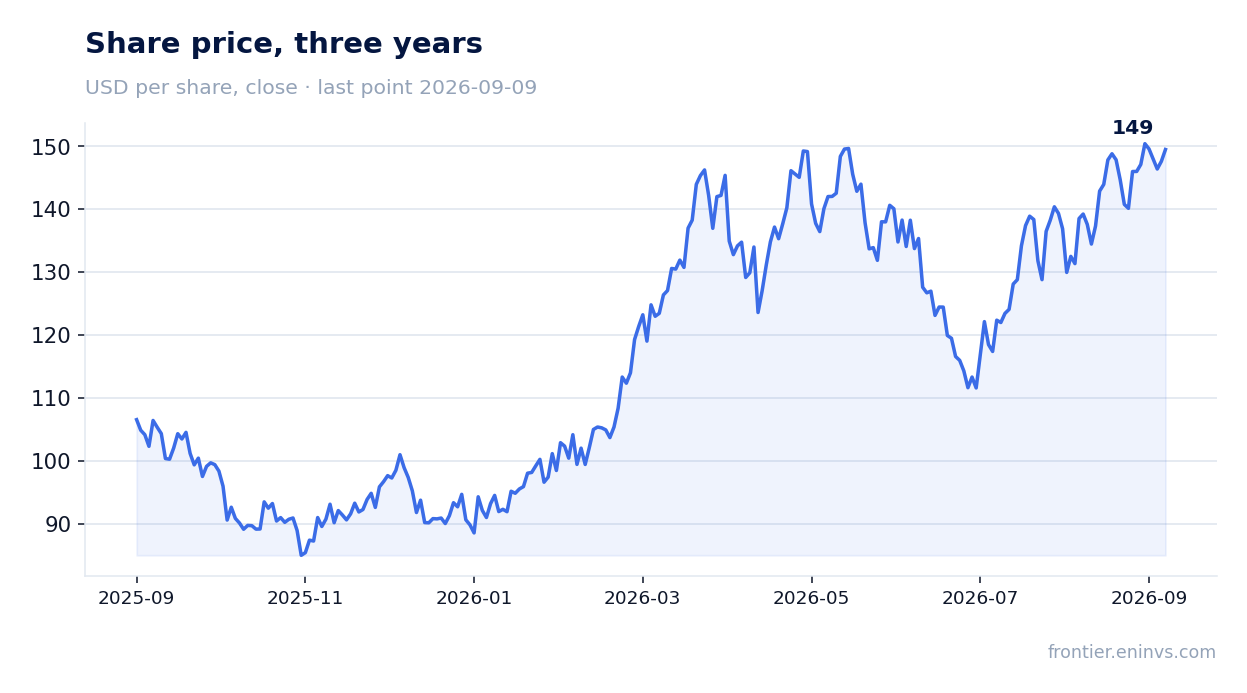
The board declared a base dividend of $1.30 per share, payable on September 4, 2026 to shareholders of record as of August 20. This is a quarterly dividend; the annual payment at the current level would be $5.20 per share. At the share price of $136.89 before the release, the dividend yield is 3.48%.
The company also repurchased 1,104,346 shares for $147.4 million at an average price of $133.47 per share. Total capital returned in the quarter was 54% of free cash flow, and in Q3 the company plans to increase it to 75% as leverage fell below half a turn.
Our estimate for the 2026 dividend assumes the quarterly payment remains at $1.30, giving $5.20 per share and a yield of about 3.8% at the current price. The payment is covered by free cash flow: in the first half it was $734.5 million, while dividends were about $295 million. The risk of a lower payout is linked to falling oil prices, which could reduce free cash flow, but low debt and high margins provide a cushion.
EV/EBITDA of 3.38 versus a three-year average of 4.05 – a discount to its own history amid rising revenue
The company's current valuation on the LTM EV/EBITDA multiple is 3.38, below its own three-year average of 4.05. This means the market values the business cheaper than its average over the past three years, despite growth in revenue and profit. On LTM P/E, the company trades at 9.73, which also looks low for a growing producer.
The discount to historical valuation may be explained by concerns about oil price sustainability and the broader macroeconomic backdrop. However, the company's financials remain strong: EBITDA margin of 46.7%, net margin of 24.2%, and leverage of 0.47 EBITDA. At the same time, the 3.48% dividend yield and share buyback programme support shareholder returns.
Comparison with its own history shows the current multiple is at the lower end of the three-year range. If oil prices remain at current levels or rise, and the company continues to grow production and return capital, the discount could narrow. The main risk is a fall in oil prices, which would reduce both EBITDA and free cash flow.
Valuation on the latest reported figures
| Metric | Value |
|---|---|
| Market cap | 8.25 bn USD |
| P/E (LTM) | 9.7 |
| EV/EBITDA (LTM) | 3.4 |
| P/B | 1.02 |
| Net debt / EBITDA (LTM) | 0.47 |
| Operating cash flow (LTM) | 2.00 bn |
| ROE | 25.6% |
| Dividend yield (12m) | 3.5% |
| EV/EBITDA, 3-year average | 4.0 |
Bottom line
Chord Energy's Q2 2026 report showed strong operational and financial results: revenue grew 84.0%, EBITDA reached $923.5 million, and free cash flow was $413.4 million. However, a significant portion of revenue growth came from low-margin purchased volumes, and net income includes one-off items. The company maintains low leverage (0.47 EBITDA) and returns 54% of free cash flow to shareholders, planning to increase returns to 75% in Q3. The EV/EBITDA of 3.38 is below its own three-year average of 4.05, making the shares attractive at current oil prices. The key question for a holder is the sustainability of oil prices and the company's ability to maintain free cash flow sufficient to fund dividends and buybacks.
Open the company's financial profile CHRD →
See also: market overview · valuation map · stock screeners