Canadian Natural Resources Limited: revenue doubled in the quarter, but EBITDA margin fell by 8.7 pp
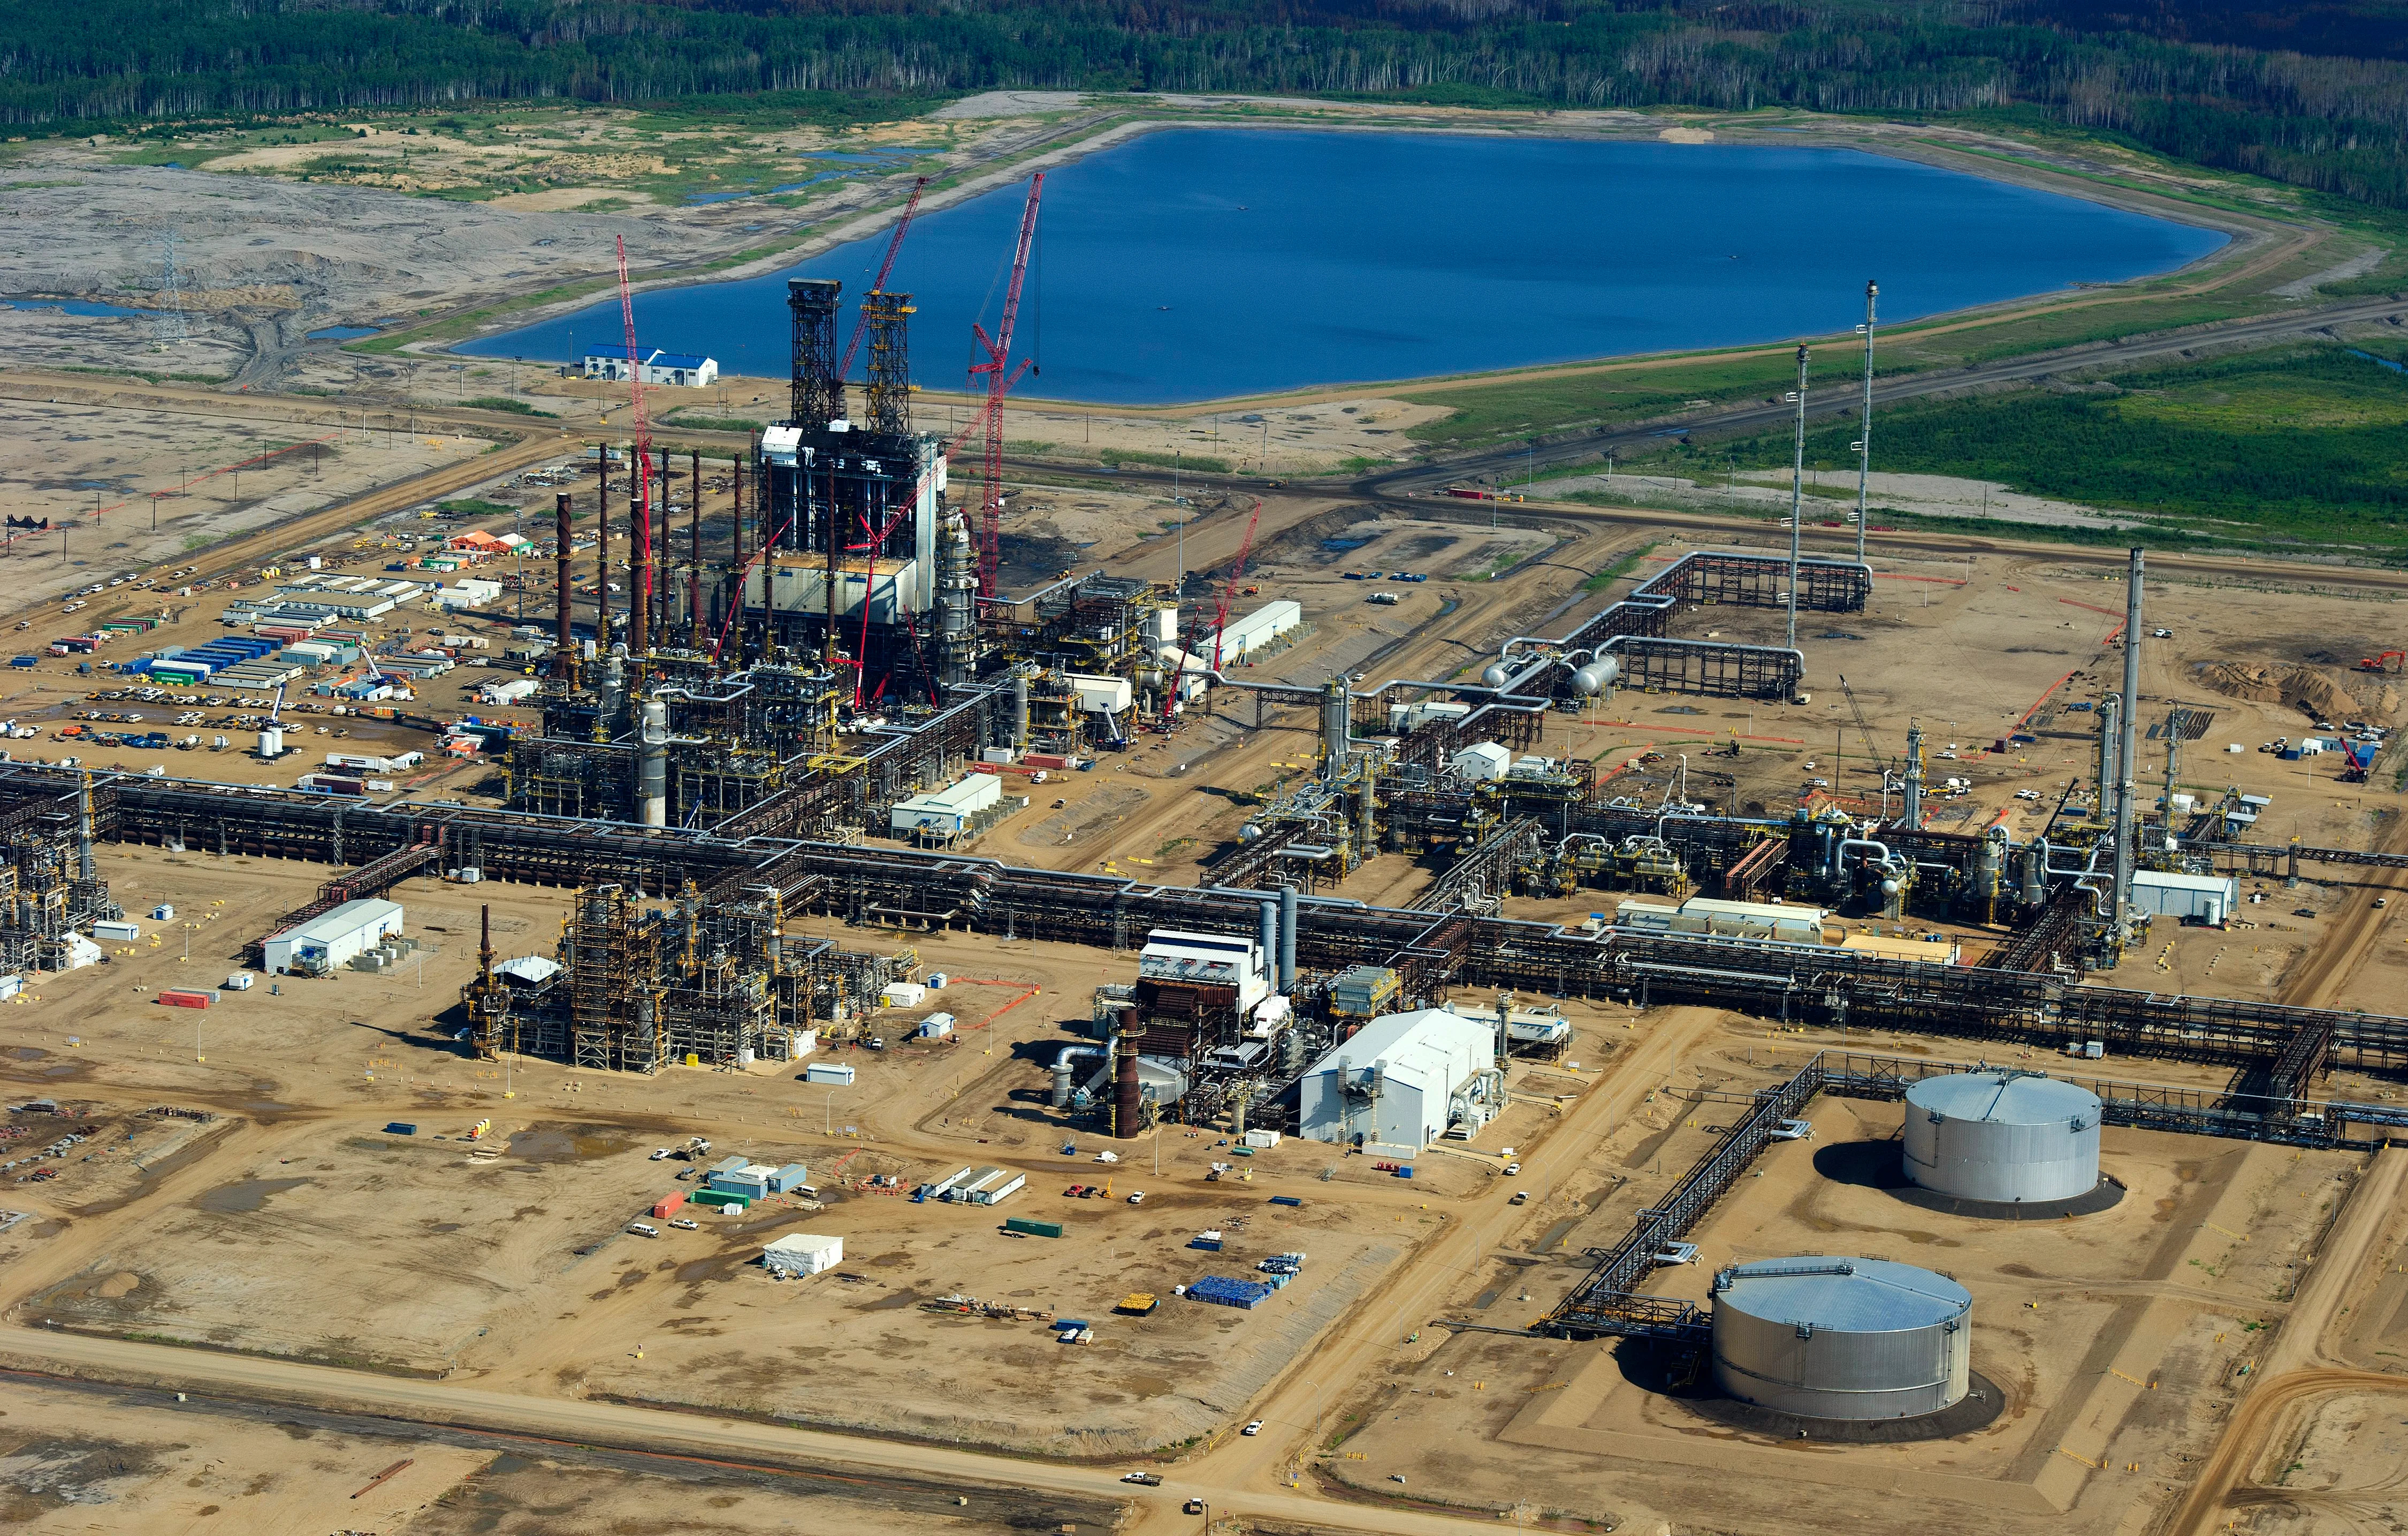
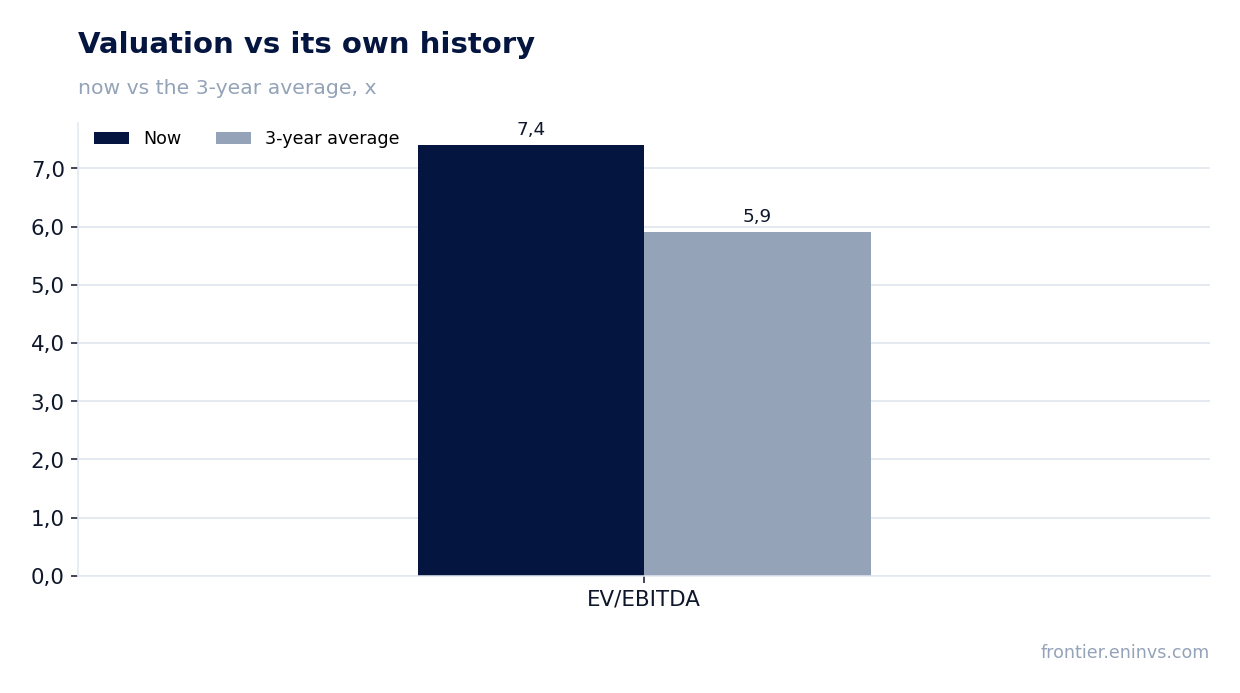
Canadian Natural Resources Limited раскрыла результаты за второй квартал 2026 года 6 августа. Выручка выросла на 100,5% год к году, до 12 538,4 млн USD, EBITDA – на 69,0%, до 6 011,3 млн USD, чистая прибыль – на 85,5%, до 3 279,9 млн USD. Акции торгуются с P/E 12,8 и EV/EBITDA 7,4 против среднего за три года 5,9, что выглядит скорее привлекательно на фоне сильного денежного потока и умеренного долга.
Key takeaways
— Revenue doubled thanks to the Peace River acquisition and higher oil prices
— EBITDA margin fell by 8.7 pp due to higher production and transportation costs
— Net profit rose 85.5%, but includes one-off losses on derivatives
— Operating cash flow rose to 4,969.8 million USD, funding capex and dividends
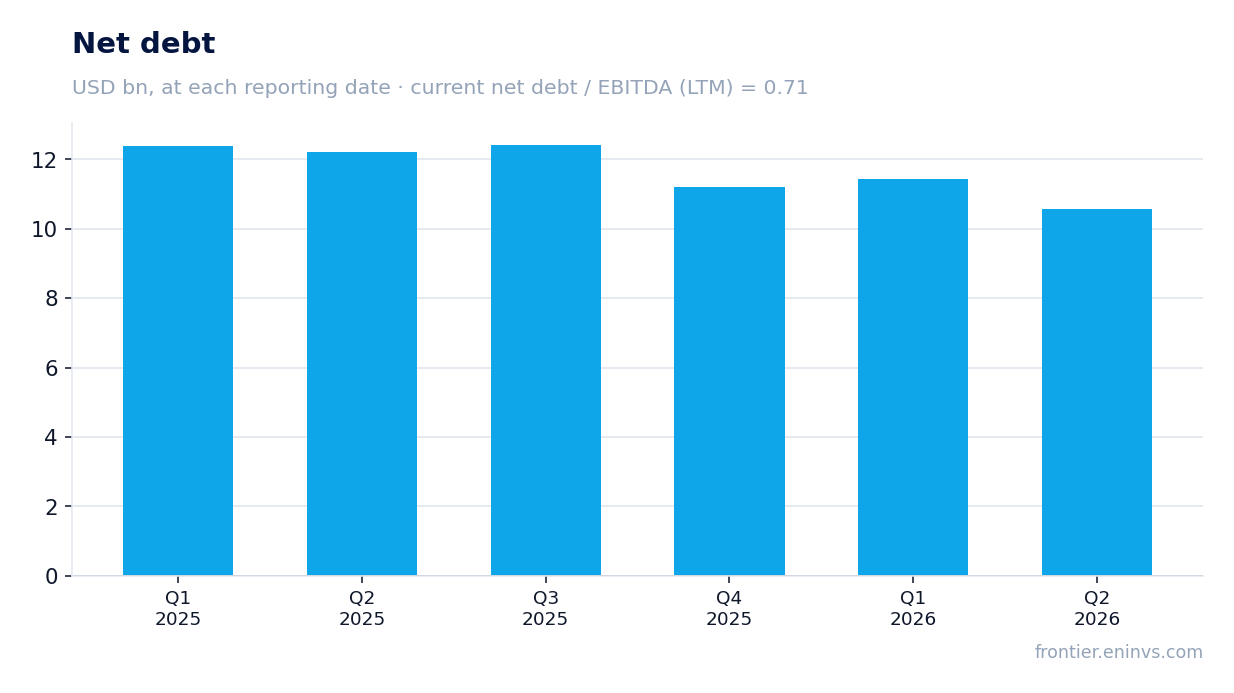
— Net debt fell by 0.9 billion USD in the quarter to 10,580.5 million USD, debt/EBITDA at 0.71
— Dividend raised 6% to 0.625 USD per share, yield 1.75%
— Shares trade at a discount to their own history: EV/EBITDA 7.4 vs 5.9 three-year average
Attractiveness
Key figures, USD bn
| Metric | Q2 2025 | Q2 2026 | Change |
|---|---|---|---|
| Revenue | 6.25 | 12.5 | +100.5% |
| EBITDA | 3.46 | 5.85 | +69.0% |
| Operating profit | 2.19 | 4.63 | +111.2% |
| Net profit | 1.77 | 3.28 | +85.5% |
| Operating cash flow | 2.24 | 4.97 | +122.0% |
| EBITDA margin | 55.3% | 46.6% | -8.7 pp |
| Net margin | 28.3% | 26.2% | -2.1 pp |
Revenue doubled thanks to the Peace River acquisition and higher oil prices
In Q2 2026, Canadian Natural Resources Limited's revenue reached 12,538.4 million USD, up 100.5% year-over-year. The main driver was the acquisition of oil and gas assets in the Peace River region, completed in February 2026 for 761 million USD, along with favorable oil prices.
The acquisition added about 92 million USD to revenue in Q1 2026, and about 128 million USD on a full-quarter basis. Higher oil prices also supported revenue, though the exact impact is not disclosed.
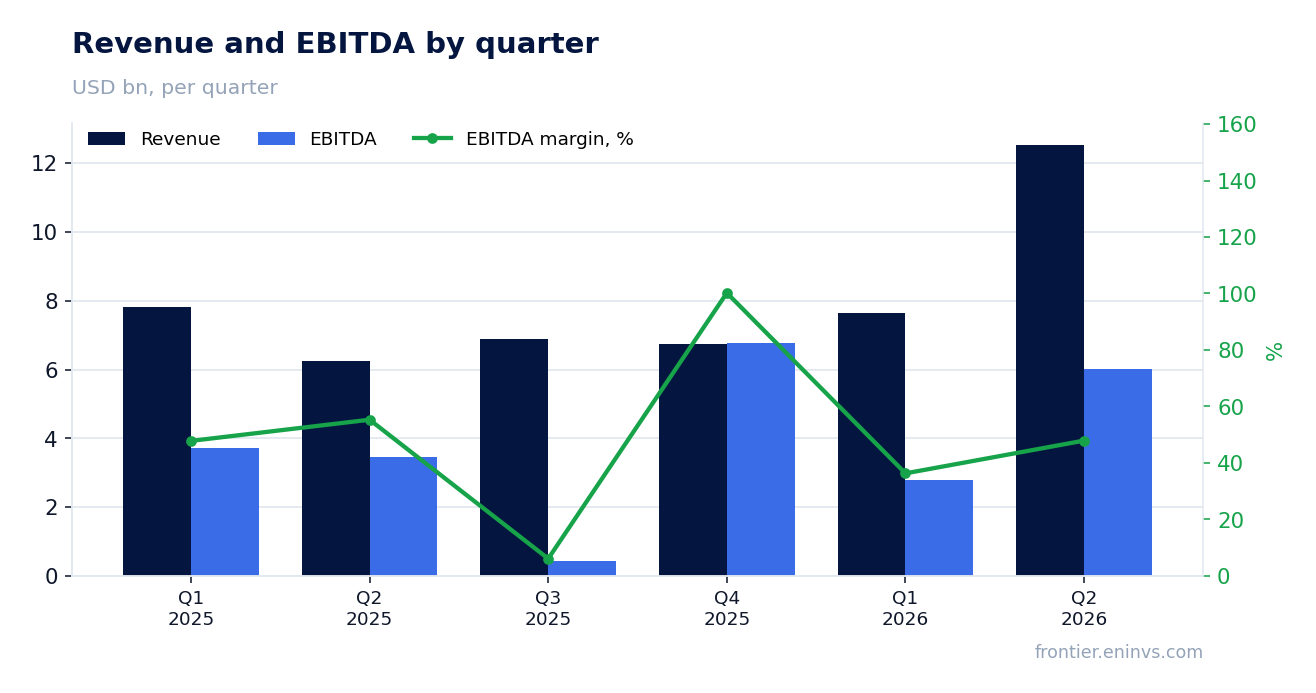
EBITDA margin fell by 8.7 pp due to higher production and transportation costs
EBITDA margin in Q2 2026 was 46.6% versus 55.3% a year earlier. The 8.7 percentage point decline reflects higher production, transportation, and blending costs, which rose in absolute terms.
Production expenses rose to 2,388 million USD, transportation to 670 million USD, and blending and feedstock to 2,308 million USD (based on Q1 2026 data, but the trend continues). Derivative losses also pressured the margin.
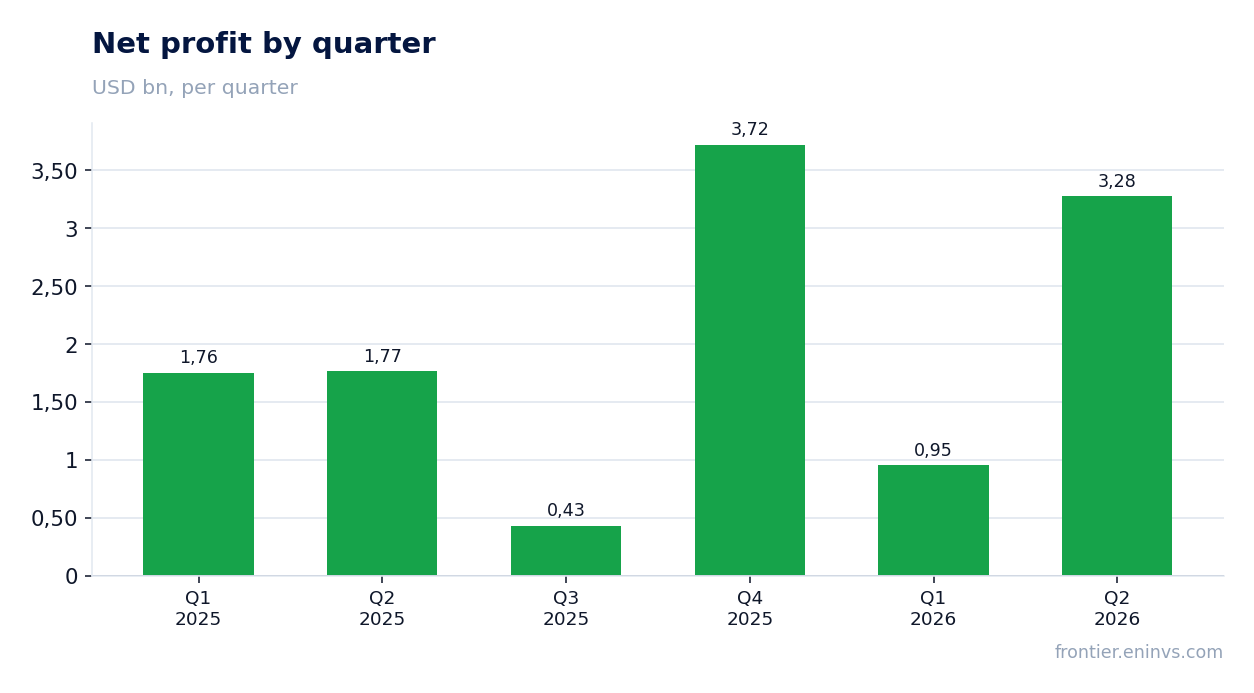
Net profit rose 85.5%, but includes one-off losses on derivatives
Net profit for Q2 2026 reached 3,279.9 million USD, up 85.5% year-over-year. However, in Q1 2026 the company recognized a derivative loss of 361 million USD, including an unrealized loss of 316 million USD on a long-term natural gas supply contract.
Excluding these one-off items, profit would have been higher, but the company does not disclose adjusted figures. Net margin fell to 26.2% from 28.3% a year earlier.
Operating cash flow rose to 4,969.8 million USD, funding capex and dividends
In Q2 2026, operating cash flow was 4,969.8 million USD – the best quarterly figure in the last four quarters. Over the trailing twelve months, operating cash flow reached 10,800.0 million USD.
The company allocated significant funds to capital expenditures: in Q1 2026 – 2,092 million USD on property, plant and equipment and 86 million USD on exploration. Cash flow comfortably covers investments and dividend payments.
Net debt fell by 0.9 billion USD in the quarter to 10,580.5 million USD, debt/EBITDA at 0.71
At the end of Q2 2026, net debt stood at 10,580.5 million USD, down 0.9 billion USD from the previous reporting date. Over the last twelve months, net debt decreased by 1.6 billion USD.
The net debt to EBITDA ratio for the trailing twelve months is 0.71, a moderate level. The company retains financial flexibility for further acquisitions and shareholder returns.
Dividend raised 6% to 0.625 USD per share, yield 1.75%
The Board of Directors on March 4, 2026 raised the quarterly dividend by 6% to 0.625 USD per share, starting with the payment on April 7, 2026. Over the trailing twelve months, the dividend yield was 1.75%.
The company has paid regular quarterly dividends since 2001. Given current earnings and cash flow, payments appear sustainable, and the dividend increase confirms management's confidence in free cash flow generation.
Shares trade at a discount to their own history: EV/EBITDA 7.4 vs 5.9 three-year average
The current EV/EBITDA multiple is 7.4 versus the three-year average of 5.9. Thus, shares are valued 25% above their own historical norm, reflecting improved market conditions and growth expectations.
P/E for the trailing twelve months is 12.8, which looks moderate for a company with a return on equity of 39.9%. According to the portal's model, the share price upside is +32% to fair value.
Valuation on the latest reported figures
| Metric | Value |
|---|---|
| Market cap | 108 bn USD |
| P/E (LTM) | 12.8 |
| EV/EBITDA (LTM) | 7.4 |
| P/B | 3.39 |
| Net debt / EBITDA (LTM) | 0.71 |
| Operating cash flow (LTM) | 10.8 bn |
| ROE | 39.9% |
| Dividend yield (12m) | 1.7% |
| EV/EBITDA, 3-year average | 5.9 |
Bottom line
The Q2 2026 report shows strong revenue and profit growth, driven by acquisitions and favorable pricing. However, margins declined and profit included one-off derivative losses. Debt levels are moderate, and cash flow covers investments and dividends. Shares trade at a premium to their own history, but the portal's model indicates upside potential. Verdict – rather attractive.
Open the company's financial profile CNQ →
See also: market overview · valuation map · stock screeners