CNX Resources: profit halved, but 2.11x net debt/EBITDA and a multiple below its own history keep the stock interesting
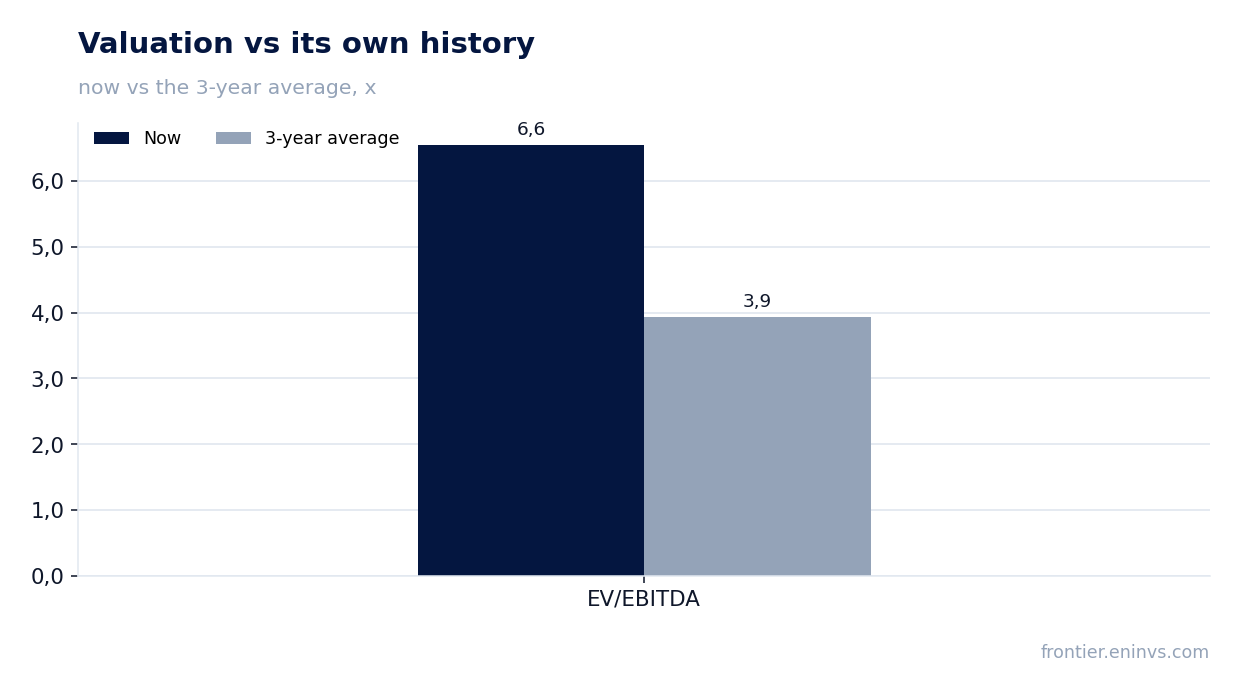
On 30 July, CNX Resources Corporation released its second-quarter 2026 results. Revenue fell 35.7% year on year to $618.5 million, EBITDA declined 43.9% to $414.0 million, and net income dropped 53.1% to $202.9 million. The EBITDA margin narrowed to 66.9% from 76.7%, and the net margin to 32.8% from 44.9%. Despite the weak quarter, the stock looks attractive: EV/EBITDA LTM is 6.55 against its own three-year average of 3.94, while net debt/EBITDA LTM stands at 2.11 – a moderate level for a gas producer.
Key takeaways
— Q2 revenue fell 35.7% on lower gas prices and production volumes
— EBITDA margin narrowed to 66.9% as unit cash costs rose
— Net income dropped 53.1% but remains high relative to revenue
— Free cash flow for the quarter was $138 million with capex of $142 million
— Net debt at 2.11x EBITDA LTM is a moderate burden for the sector
— Valuation at EV/EBITDA LTM 6.55 is above its own three-year average of 3.94
— The portal model points to 54% downside to fair value
Attractiveness
Key figures, USD bn
| Metric | Q2 2025 | Q2 2026 | Change |
|---|---|---|---|
| Revenue | 0.96 | 0.62 | -35.7% |
| EBITDA | 0.74 | 0.41 | -43.9% |
| Operating profit | 0.59 | 0.28 | -52.6% |
| Net profit | 0.43 | 0.20 | -53.1% |
| Operating cash flow | 0.28 | 0.28 | -1.1% |
| Capex | 0.11 | 0.14 | +25.0% |
| EBITDA margin | 76.7% | 66.9% | -9.8 pp |
| Net margin | 44.9% | 32.8% | -12.1 pp |
Q2 revenue fell 35.7% on lower gas prices and production volumes
CNX Resources' Q2 2026 revenue came in at $618.5 million, down 35.7% from a year earlier. The decline is explained by both lower natural gas prices and reduced production. The average realised gas price before hedging fell to $2.40 per Mcfe from $2.84 a year ago, while total production declined to 151.5 Bcfe from 167.6 Bcfe.
The revenue drop was partly offset by a positive hedging effect: the average gain on settled commodity derivatives was $0.33 per Mcfe versus a loss of $0.23 a year earlier. Still, this was not enough to keep revenue at last year's level.
Note that revenue includes non-cash items, notably an unrealised gain on commodity derivatives of $131 million. Excluding this item, sales of natural gas, NGL and oil including cash settlements were $435 million, also below last year's $450 million.
EBITDA margin narrowed to 66.9% as unit cash costs rose
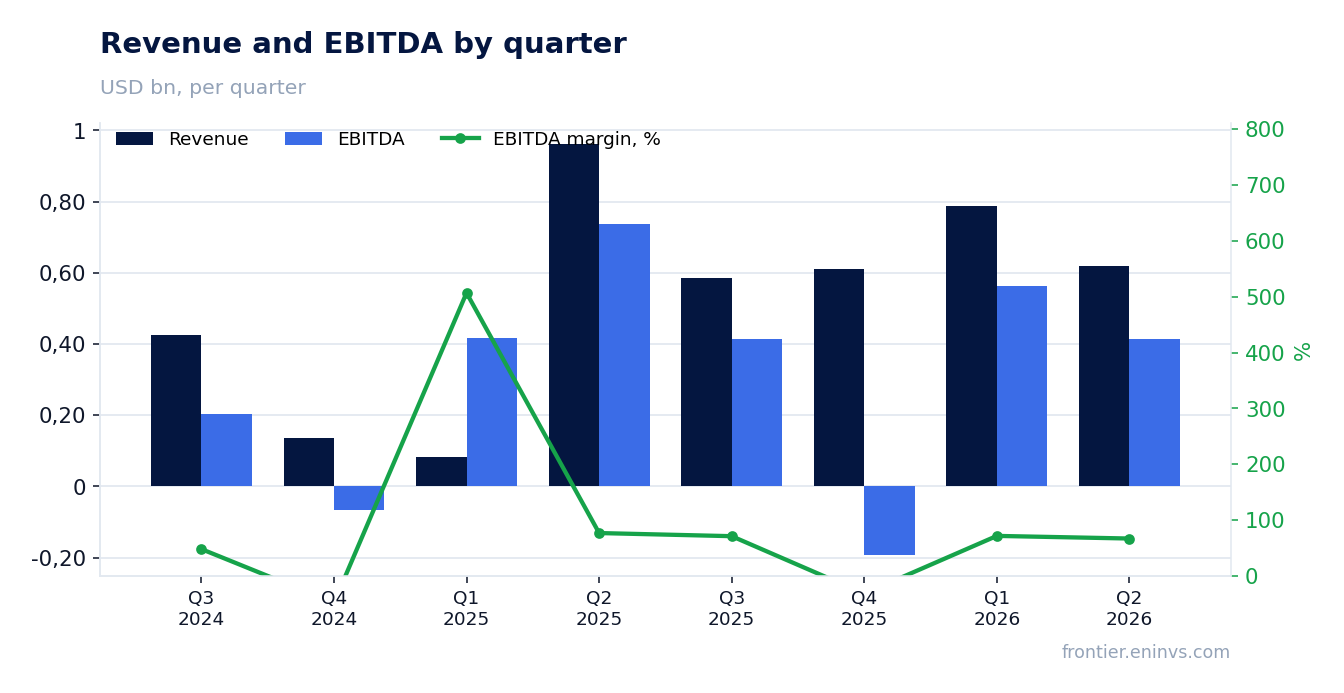
Q2 EBITDA was $414.0 million, down 43.9% from a year earlier. The EBITDA margin narrowed to 66.9% from 76.7%. The main reason is that production costs grew faster than revenue.
Unit cash production costs before DD&A rose to $0.87 per Mcfe from $0.79 a year earlier. Fully burdened cash costs, including administrative and interest expenses, increased to $1.19 per Mcfe from $1.05. This led to a contraction in the cash margin to $1.68 per Mcfe from $1.63 a year earlier, despite lower revenue.
The margin contraction is also linked to higher transportation, gathering and compression costs – $0.68 per Mcfe versus $0.58. These costs are relatively fixed and difficult to cut quickly when gas prices fall.
Net income dropped 53.1% but remains high relative to revenue
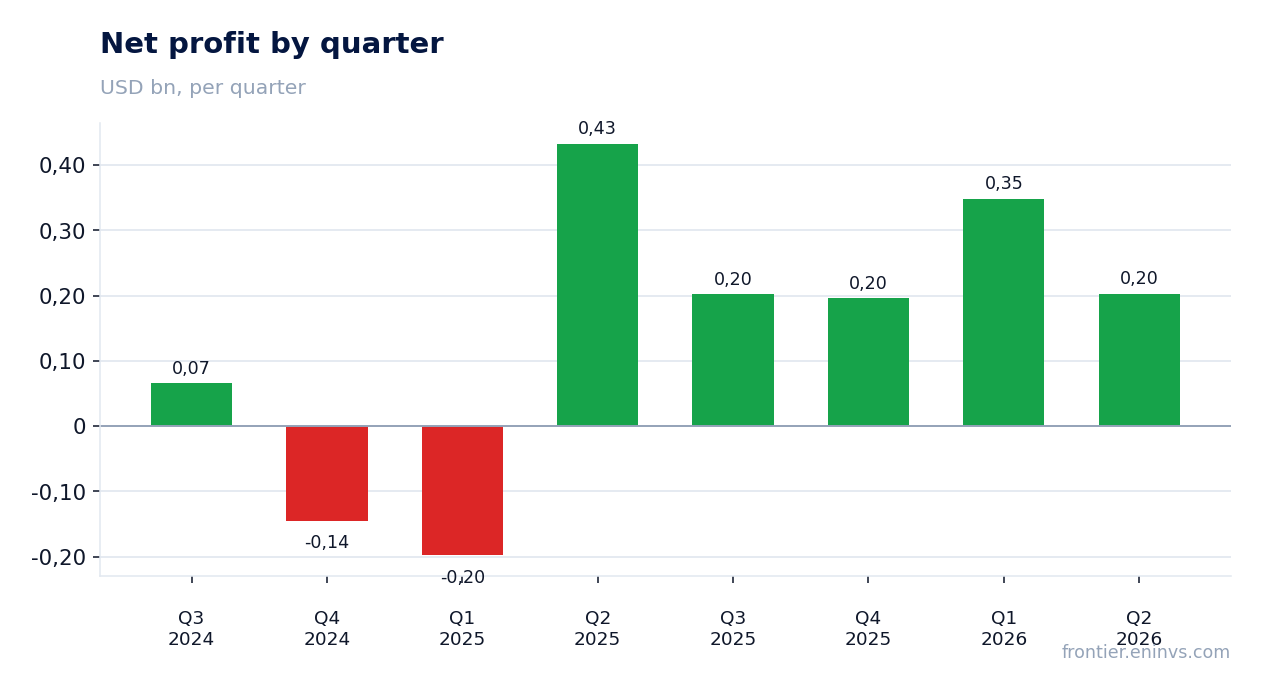
Q2 net income was $202.9 million, down 53.1% from $432.5 million a year earlier. The net margin narrowed to 32.8% from 44.9%. Despite the decline, the profit level remains high for a company with revenue of $618.5 million.
Non-cash factors played a significant role in Q2 profit. An unrealised gain on commodity derivatives of $131 million substantially supported the bottom line. Excluding this item and the related tax effect, adjusted net income would have been $110 million versus $101 million a year earlier.
Thus, the company's operating profitability excluding non-cash hedging fluctuations remains stable, and the volatility in reported profit is largely explained by derivative revaluation.
Free cash flow for the quarter was $138 million with capex of $142 million
Q2 operating cash flow was $279.5 million, with capital expenditures of $142.0 million. Free cash flow, which the company calculates as operating cash flow minus capex plus asset sale proceeds, was $138 million. This is below last year's $188 million but remains positive.
The company reaffirmed its 2026 capex guidance of $556–586 million, including $390–410 million for drilling and completion. Full-year free cash flow guidance is approximately $525 million, or $3.41–3.55 per share.
Free cash flow remains the primary source of funding for the share buyback programme. In Q2, the company spent $200.4 million on repurchasing its own shares, exceeding quarterly free cash flow.
Net debt at 2.11x EBITDA LTM is a moderate burden for the sector
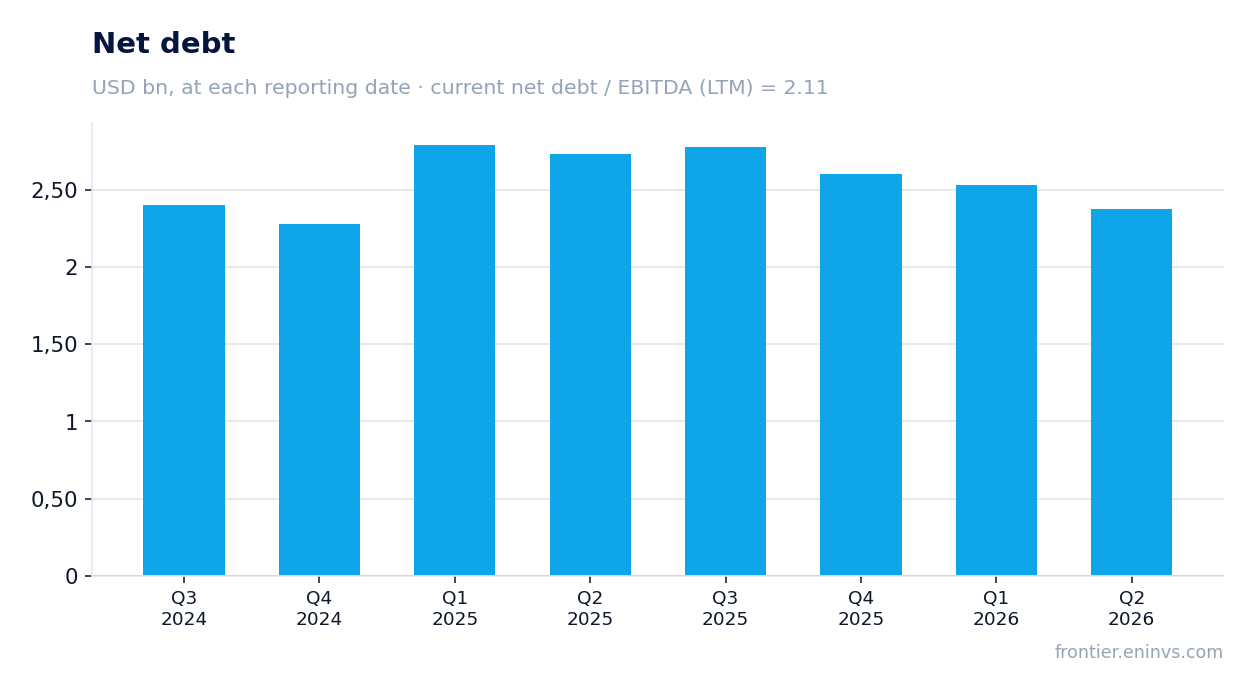
Net debt at the end of Q2 was $2,373.9 million, down from $2,532.9 million at the end of Q1. The net debt to EBITDA ratio for the trailing twelve months is 2.11. This is a moderate level for a gas producer, though higher than desirable at current gas prices.
The sequential decline in net debt is explained by positive free cash flow and asset sale proceeds. Over the past 12 months, net debt decreased by RUB 0.4 billion in rouble terms, reflecting a consistent improvement in the debt position.
Q2 interest expense was $39.0 million, down from $44.0 million a year earlier. This is due to debt refinancing at lower rates. The company repaid $508 million of debt in Q1 and raised $500 million in new notes, improving the debt portfolio structure.
Valuation at EV/EBITDA LTM 6.55 is above its own three-year average of 3.94
CNX Resources' current valuation at EV/EBITDA LTM is 6.55. This is notably above the company's own three-year average of 3.94. The P/E LTM ratio is 5.77, reflecting high trailing twelve-month profit, including one-off factors.
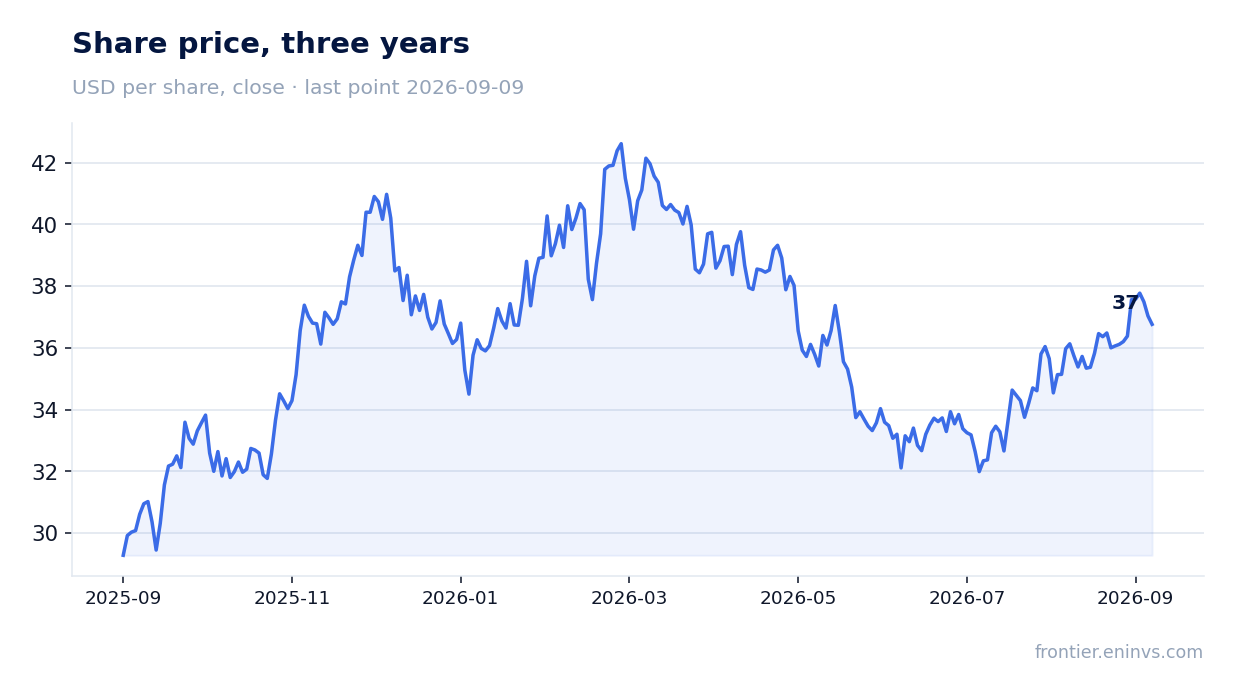
Market capitalisation at the time of the report is $5,478.6 million. The stock closed at $34.70 before the release, fell 0.3% on the release day, and has risen 5.9% from the release to 9 September.
The portal model, which reprices EBITDA at current commodity prices at the target EV/EBITDA, points to 54% downside to fair value. This is our own estimate, not a market consensus.
The portal model points to 54% downside to fair value
Our model, which reprices EBITDA at current commodity prices at the target EV/EBITDA, yields a fair value 54% below the current market price. This is a significant gap that requires explanation.
The gap is explained by the fact that trailing twelve-month EBITDA includes a period of high gas prices and one-off factors unlikely to recur. If gas prices remain at current levels, EBITDA may be lower than in the past 12 months, which at the current multiple gives a less attractive valuation.
However, the model does not account for possible gas price increases or operational efficiency improvements. In addition, the company is actively buying back shares, which could support the price even if fundamentals weaken.
Valuation on the latest reported figures
| Metric | Value |
|---|---|
| Market cap | 5.48 bn USD |
| P/E (LTM) | 5.8 |
| EV/EBITDA (LTM) | 6.6 |
| P/B | 1.26 |
| Net debt / EBITDA (LTM) | 2.11 |
| Operating cash flow (LTM) | 1.00 bn |
| ROE | 17.1% |
| EV/EBITDA, 3-year average | 3.9 |
Bottom line
CNX Resources reported a weak quarter: revenue and profit fell by double digits, and the margin contracted. However, the company maintains positive free cash flow, reduces debt, and trades at an EV/EBITDA multiple of 6.55, above its own three-year average of 3.94. The portal model points to 54% downside, making the stock vulnerable at current gas prices. The verdict is neutral: a strong balance sheet and cash flow are offset by weak operating results and a high valuation.
Open the company's financial profile CNX →
See also: market overview · valuation map · stock screeners