COSTCO WHOLESALE CORP /NEW: revenue accelerated to +11.6%, but valuation already at 30x EV/EBITDA
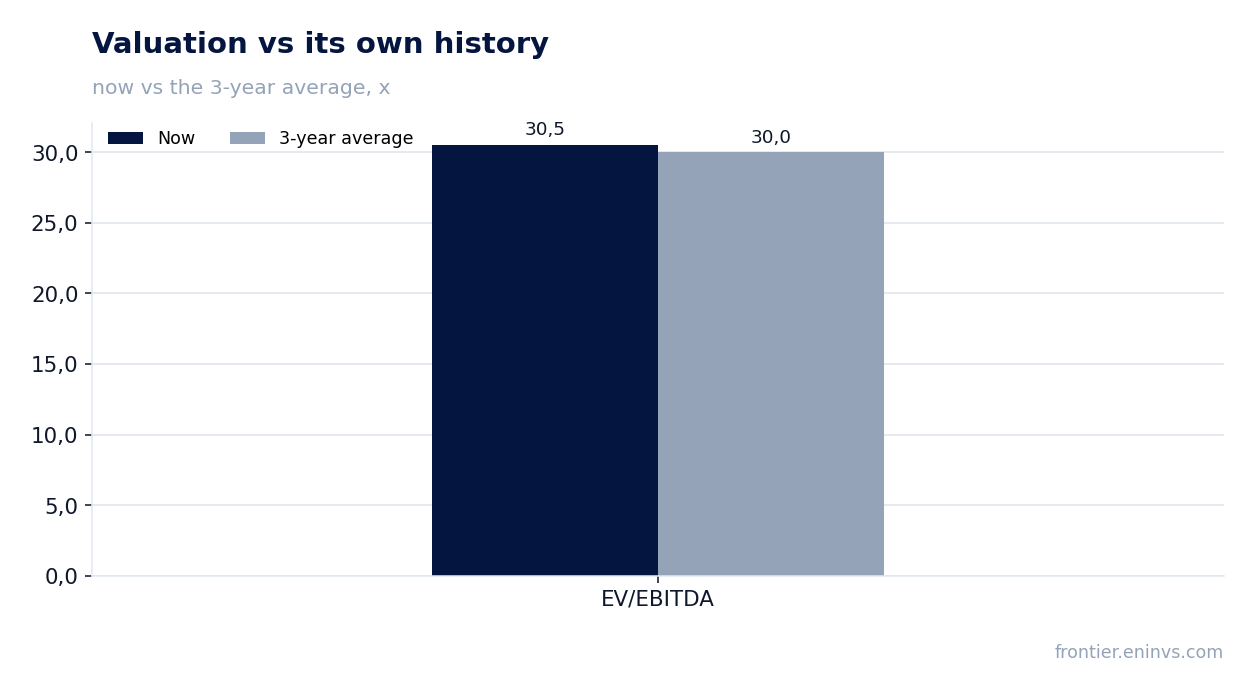
25 августа COSTCO WHOLESALE CORP /NEW раскрыла результаты за третий квартал 2026 финансового года. Выручка выросла на 11,6% год к году, до 70 527 млн долл., EBITDA – на 15,7%, до 3 412 млн долл., чистая прибыль – на 15,2%, до 2 192 млн долл.. Акции торгуются по мультипликатору EV/EBITDA 30,5 против среднего за три года 30,0, что оставляет мало пространства для ошибки, поэтому бумага выглядит скорее привлекательной, чем безусловно дешёвой.
Key takeaways
— Revenue accelerated to +11.6% – the best quarterly pace in the last five quarters
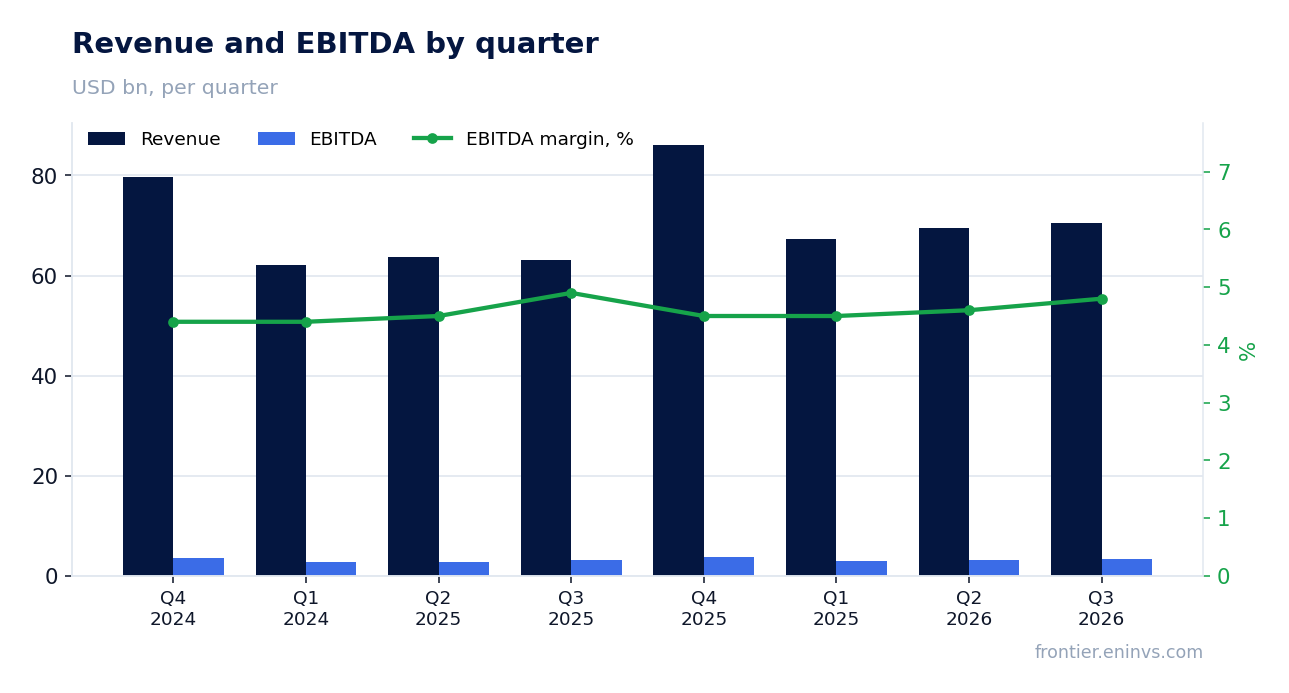
— EBITDA margin expanded by 0.2 pp to 5.1% thanks to operating leverage
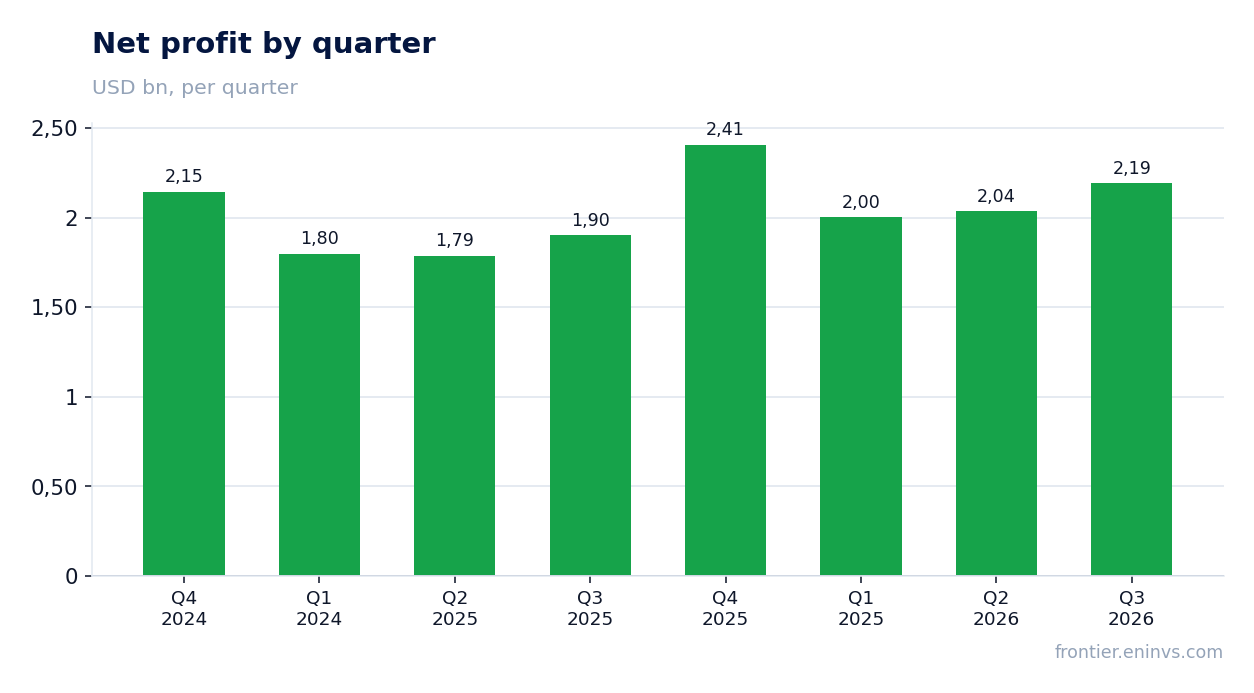
— Net profit grew 15.2%, but net margin remained modest at 3.1%
— Free cash flow for the quarter was 2,036 million – higher than a year ago
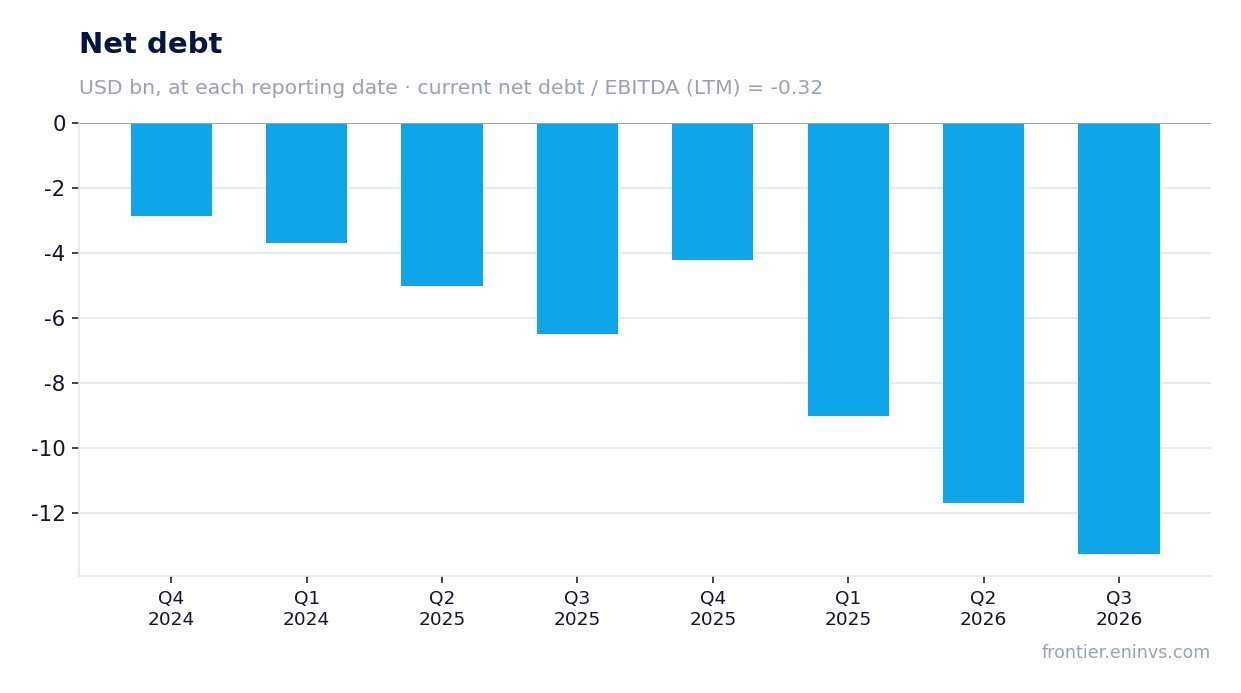
— Net debt is negative: minus 13,276 million, equivalent to minus 0.32 EBITDA over 12 months
— Valuation at 30.5 EV/EBITDA – 2% above its own three-year average
— Dividend yield of 0.6% is low, but the company continues to generate excess cash flow
Attractiveness
Key figures, USD bn
| Metric | Q3 2025 | Q3 2026 | Change |
|---|---|---|---|
| Revenue | 63.2 | 70.5 | +11.6% |
| EBITDA | 3.08 | 3.57 | +15.7% |
| Operating profit | 2.53 | 2.81 | +11.3% |
| Net profit | 1.90 | 2.19 | +15.2% |
| Operating cash flow | 3.46 | 3.45 | -0.3% |
| Capex | 1.13 | 1.41 | +24.9% |
| EBITDA margin | 4.9% | 5.1% | +0.2 pp |
| Net margin | 3.0% | 3.1% | +0.1 pp |
Revenue accelerated to +11.6% – the best quarterly pace in the last five quarters
In the third quarter of fiscal 2026, COSTCO WHOLESALE CORP /NEW revenue reached 70,527 million, up 11.6% year-over-year. This is an acceleration from previous quarters: in Q2 growth was 9.2%, in Q1 – 8.3%, and a year ago – 8.0%. The company is gaining momentum despite a high base.
The main driver, judging by the dynamics, was an increase in comparable store sales and membership growth, although the report does not break down the growth structure. Revenue acceleration is a positive signal, especially amid inflationary pressure on consumer spending.
EBITDA margin expanded by 0.2 pp to 5.1% thanks to operating leverage
EBITDA for the reported quarter grew 15.7% to 3,412 million, faster than revenue. As a result, EBITDA margin reached 5.1% versus 4.9% a year earlier. Margin expansion is a result of operating leverage: higher sales allow fixed costs to be spread over a larger base.
Operating profit rose to 2,815 million, also confirming improved operational efficiency. Nevertheless, the margin remains low – a feature of Costco's retail model, which operates on minimal markup.
Net profit grew 15.2%, but net margin remained modest at 3.1%
Net profit for the third quarter was 2,192 million, up 15.2% year-over-year. Net margin rose to 3.1% from 3.0% a year earlier. Profit growth was driven by operating results, not one-off items.
Over the trailing twelve months, net profit reached 8,263 million, confirming the sustainability of the business. However, a 3.1% margin is typical for a low-margin retailer, and investors should not expect a sharp increase.
Free cash flow for the quarter was 2,036 million – higher than a year ago
Operating cash flow in Q3 was 3,449 million, capital expenditures – 1,413 million, resulting in free cash flow of about 2,036 million. A year ago, free cash flow was higher: operating flow was 3,460 million and capex – 1,131 million, i.e. about 2,329 million. Thus, the current quarter shows solid generation, though slightly below last year's.
Over the trailing twelve months, operating cash flow reached 14,100 million, providing the company with a cushion for investments and shareholder payouts. The company continues to invest actively in network expansion while maintaining positive free cash flow.
Net debt is negative: minus 13,276 million, equivalent to minus 0.32 EBITDA over 12 months
At the end of the quarter, the company's net cash position was 13,276 million (negative net debt). The ratio of net debt to EBITDA over the trailing twelve months is minus 0.32, meaning the company holds net cash rather than debt.
During the quarter, the net cash position increased by 1.6 billion, and over the last 12 months – by 4.3 billion. This reflects strong cash flow and a conservative financial policy.
Valuation at 30.5 EV/EBITDA – 2% above its own three-year average
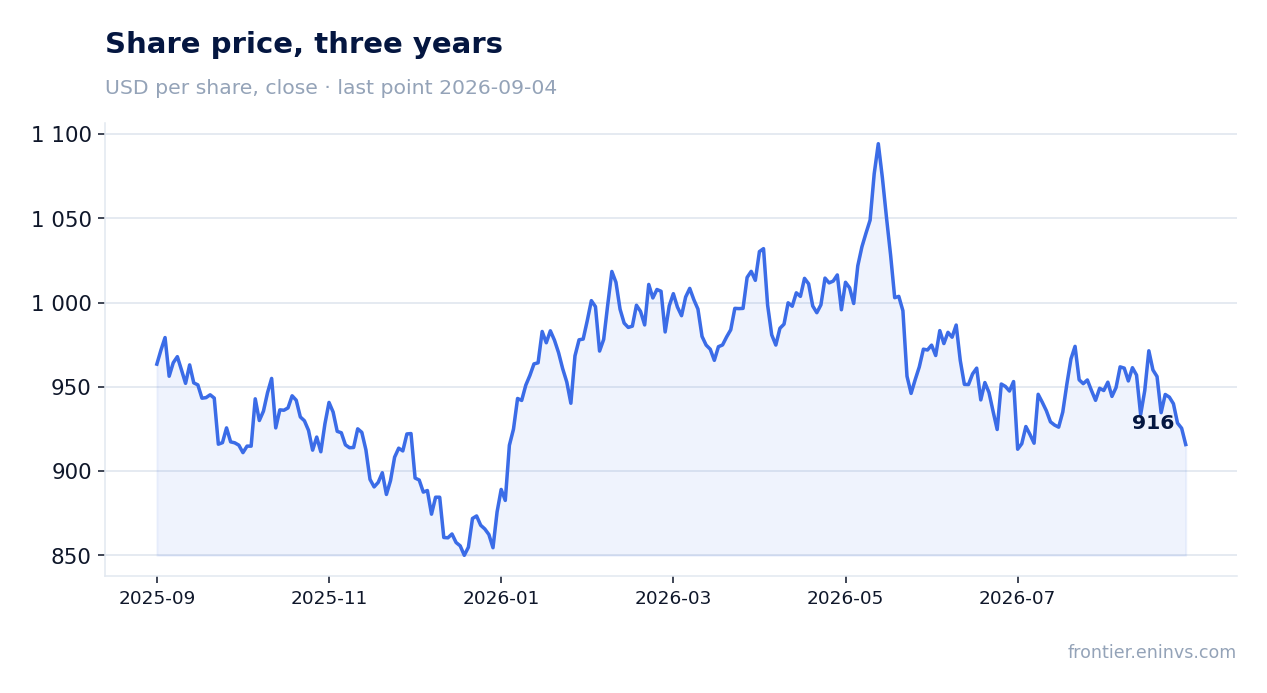
The current EV/EBITDA multiple is 30.5 versus the three-year average of 30.0. Thus, the stock trades at a premium of about 2% to its own history. P/E over the trailing twelve months is 49.2, also reflecting a high market valuation.
Our valuation model, based on EBITDA growth and target multiple, shows an upside of 9% 'on the portal's model'. This means the stock does not look overvalued, but it is not obviously cheap either.
Dividend yield of 0.6% is low, but the company continues to generate excess cash flow
The trailing dividend yield is 0.6% – low for income-oriented shareholders. However, the company allocates significant funds to growth while maintaining a net cash position.
Return on equity is 8.9%, below the market average, but acceptable for a low-margin retailer. The question for holders is whether the company can sustain revenue and margin growth to justify the current valuation.
Valuation on the latest reported figures
| Metric | Value |
|---|---|
| Market cap | 407 bn USD |
| P/E (LTM) | 49.2 |
| EV/EBITDA (LTM) | 30.5 |
| P/B | 13.94 |
| Net debt / EBITDA (LTM) | -0.32 |
| Operating cash flow (LTM) | 14.1 bn |
| ROE | 8.9% |
| Dividend yield (12m) | 0.6% |
| EV/EBITDA, 3-year average | 30.0 |
Bottom line
COSTCO WHOLESALE CORP /NEW показала сильный квартал: ускорение выручки до 11,6%, расширение EBITDA-маржи до 5,1% и рост чистой прибыли на 15,2%. Компания генерирует стабильный денежный поток и имеет отрицательный чистый долг, что делает её финансово устойчивой. Однако текущая оценка в 30,5 EV/EBITDA лишь немного выше собственного трёхлетнего среднего, и потенциал роста по нашей модели составляет 9%. При таком раскладе акции выглядят скорее привлекательными, но не с большой скидкой.
Open the company's financial profile COST →
See also: market overview · valuation map · stock screeners