California Resources Corporation: Q2 profit tripled, but the year opened with a $711 million loss

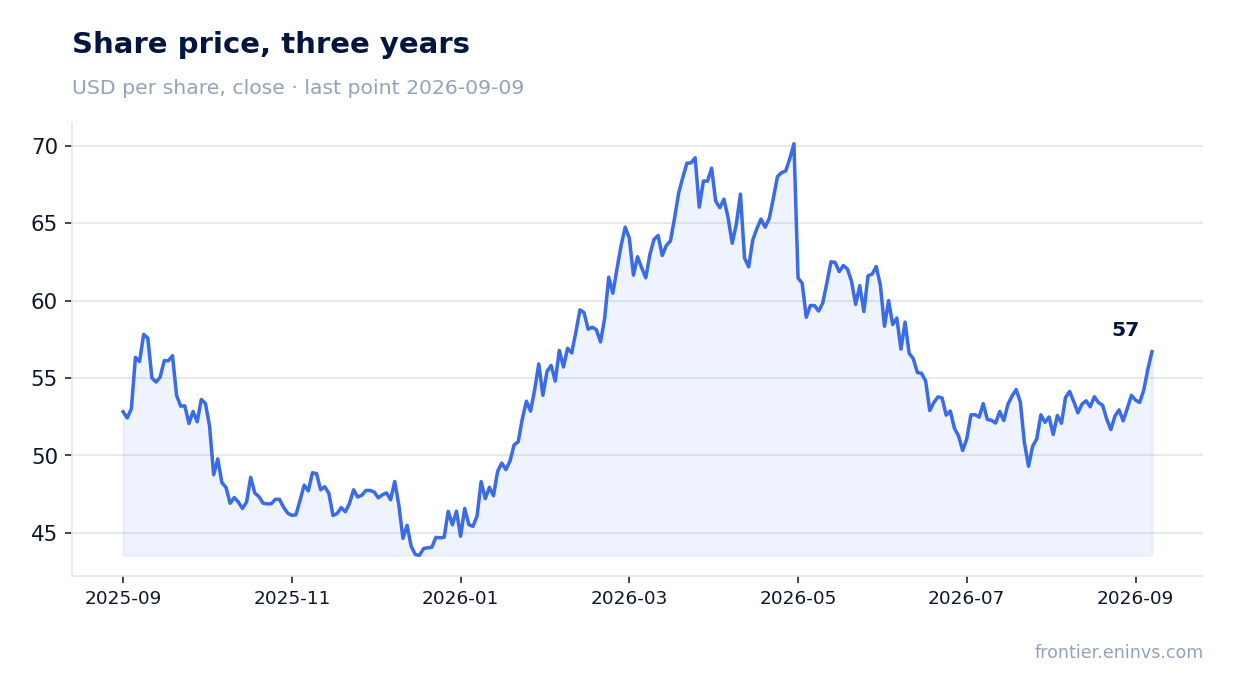
California Resources Corporation reported Q2 2026 results on July 30. Revenue rose 32.6% year-on-year to $1,297 million, EBITDA grew 62.5% to $642 million, and net profit nearly tripled to $514 million. However, the first quarter brought a $711 million loss, and that is what defines the year. At the current price the stock looks attractive: EV/EBITDA LTM of 13.7 versus the three-year average of 5.0, but the portal model implies 44% upside to fair value, and the 2.9% dividend yield exceeds the key rate.
Key takeaways
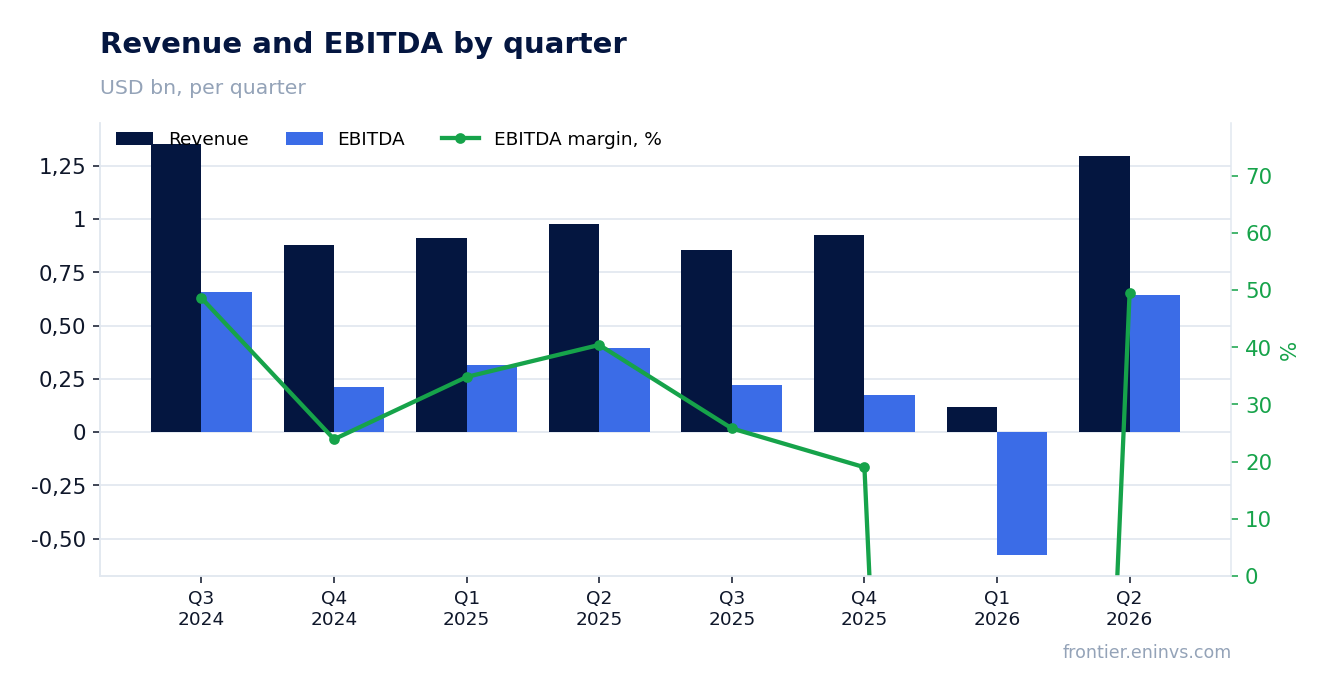
— Q2 revenue rose 32.6% year-on-year to $1,297 million, but the first quarter collapsed to $119 million
— Q2 EBITDA jumped 62.5% to $642 million, with margin reaching 49.5% versus 40.4% a year earlier
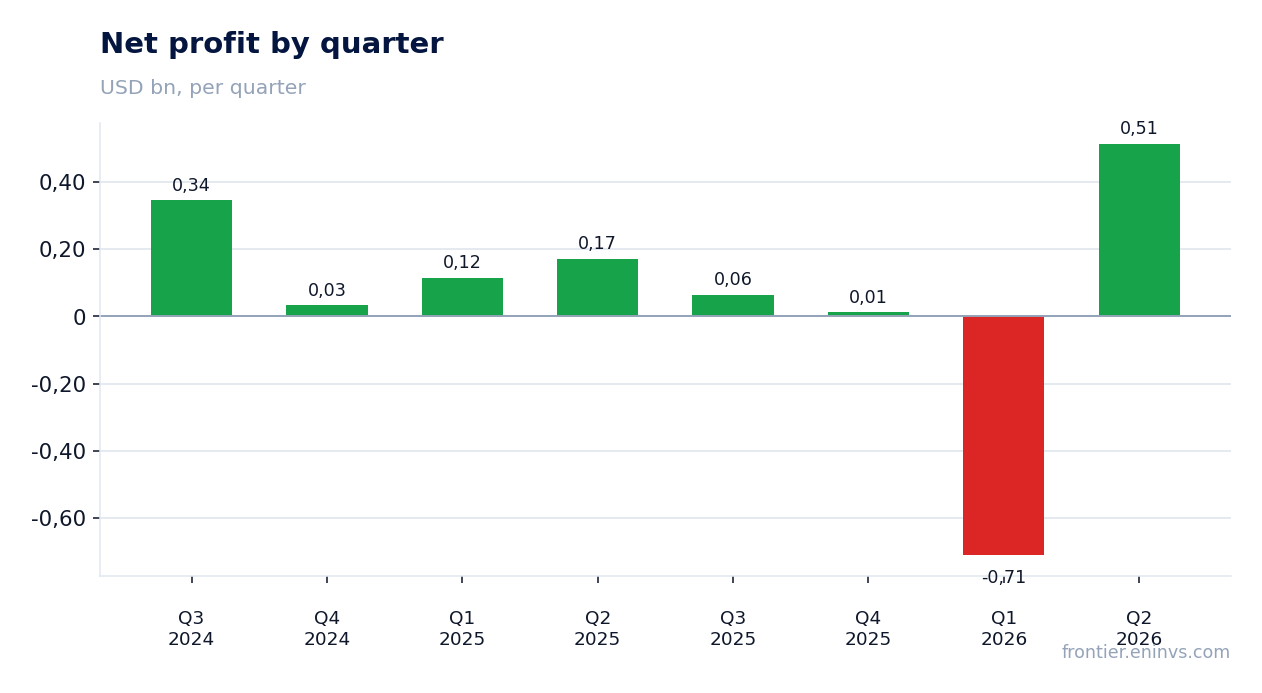
— Q2 net profit was $514 million, but the first-quarter loss of $711 million more than offset it
— Operating cash flow over the last twelve months was $865 million, while Q2 capex rose to $149 million
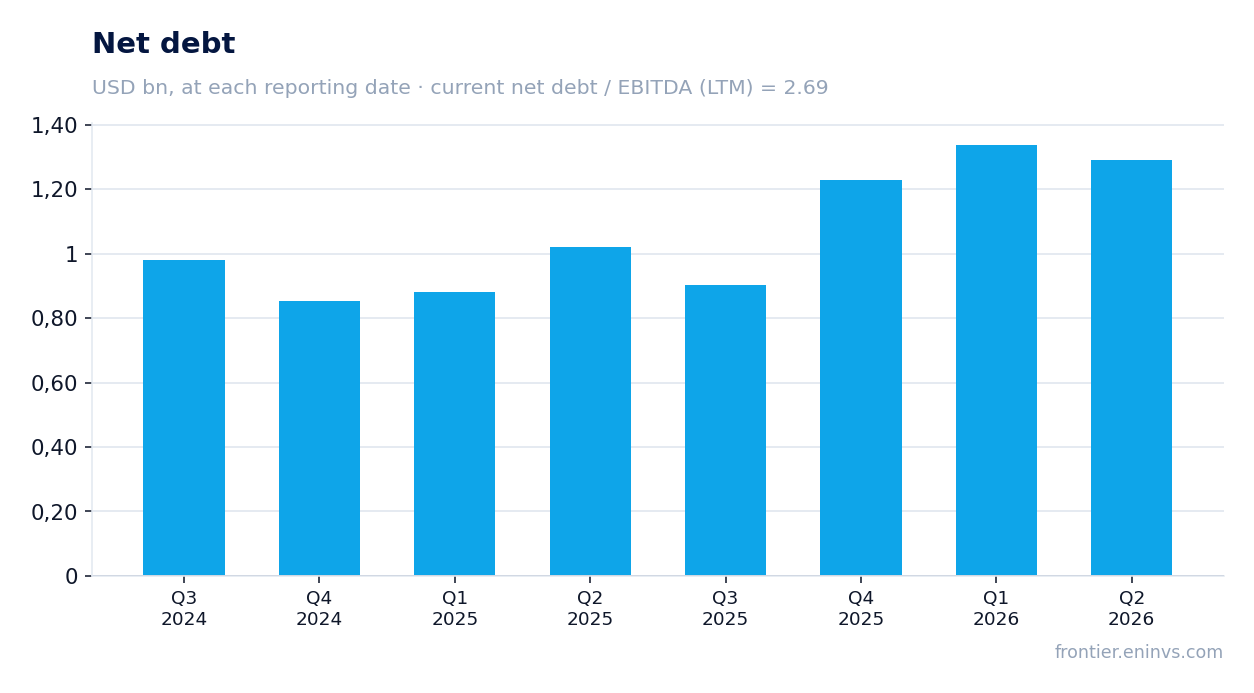
— Net debt stands at $1,291 million, or 2.69x LTM EBITDA; leverage has not declined
— Dividend yield of 2.9% rests on a payout supported by $363 million of LTM net profit
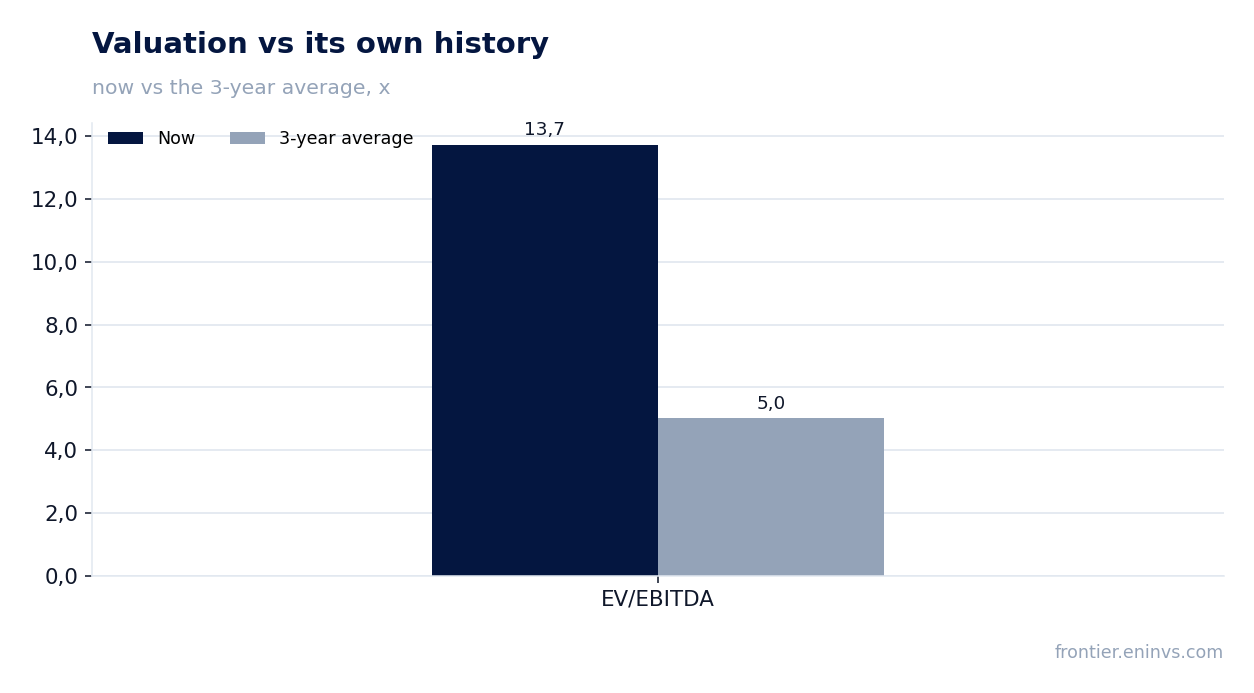
— EV/EBITDA LTM of 13.7 versus the three-year average of 5.0 – the market prices a profit recovery not yet confirmed
Attractiveness
Key figures, USD bn
| Metric | Q2 2025 | Q2 2026 | Change |
|---|---|---|---|
| Revenue | 0.98 | 1.30 | +32.6% |
| EBITDA | 0.40 | 0.64 | +62.5% |
| Operating profit | 0.27 | 0.51 | +91.4% |
| Net profit | 0.17 | 0.51 | +198.8% |
| Operating cash flow | 0.17 | 0.26 | +59.4% |
| Capex | 0.06 | 0.15 | +166.1% |
| EBITDA margin | 40.4% | 49.5% | +9.1 pp |
| Net margin | 17.6% | 39.6% | +22.0 pp |
Q2 revenue rose 32.6% year-on-year to $1,297 million, but the first quarter collapsed to $119 million
In Q2 2026, California Resources Corporation's revenue reached $1,297 million, up 32.6% from the same quarter a year earlier. This is the best quarterly result in at least two years: in the previous three quarters revenue did not exceed $924 million. The growth was driven by both higher production and favourable pricing in the California oil and gas market.
The first quarter of 2026 was disastrous: revenue was only $119 million, down 87.0% year-on-year. Such a collapse cannot be explained by market conditions alone – it points to one-off factors, likely operational disruptions or write-offs. Without details from the report, the exact cause cannot be named, but the scale of the decline indicates a serious setback.
Over the last twelve months, revenue totalled $3,200 million. This is less than in the comparable prior period, judging by quarterly dynamics: three of the four quarters showed decline or stagnation. The Q2 2026 recovery has not yet offset the losses of the first quarter.
Q2 EBITDA jumped 62.5% to $642 million, with margin reaching 49.5% versus 40.4% a year earlier
EBITDA in Q2 2026 was $642 million, up 62.5% year-on-year. The EBITDA margin reached 49.5% versus 40.4% in the same quarter last year. This margin level is among the highest in the past two years: in the previous three quarters it did not exceed 40%.
A margin increase of almost 9 percentage points means revenue grew faster than costs. This could result from both higher realised prices and lower unit operating costs. However, without data on the cost structure, the exact source of the improvement cannot be identified. Importantly, the improvement came after a disastrous first quarter when EBITDA was negative at minus $578 million.
Over the last twelve months, EBITDA totalled $456.5 million. This is significantly lower than in prior periods due to the first-quarter loss. The LTM EBITDA margin is just above 14%, well below the Q2 quarterly level. Judging by multiples, the market values the company on the assumption of a sustained margin recovery, not on the actual results of the last twelve months.
Q2 net profit was $514 million, but the first-quarter loss of $711 million more than offset it
Net profit in Q2 2026 was $514 million, nearly tripling year-on-year. The net margin reached 39.6% versus 17.6% in the same quarter last year. This profitability level is a record over the past two years: in previous quarters net profit did not exceed $345 million.
However, the first quarter of 2026 brought a loss of $711 million. This loss fully offset the Q2 profit and determined a negative result for the first half. The cause of the loss is not disclosed in the facts, but its scale is comparable to quarterly revenue, suggesting a one-off write-off or impairment. Without these details, the sustainability of Q2 profit remains questionable.
Over the last twelve months, net profit totalled $363 million. This is significantly lower than in the prior twelve months, judging by quarterly dynamics. The LTM net margin is about 11%. Judging by the P/E LTM of 13.9, the market values the company on the assumption of normalised earnings, not the actual LTM figure.
Operating cash flow over the last twelve months was $865 million, while Q2 capex rose to $149 million
Operating cash flow over the last twelve months was $865 million. This is significantly less than EBITDA for the same period ($456.5 million), which is explained by one-off write-offs and changes in working capital. In Q2 2026, operating cash flow was positive at $263 million, below net profit but above the first quarter ($99 million).
Capital expenditures in Q2 2026 rose to $149 million versus $56 million a year earlier. The more than twofold increase reflects higher investment in production. Over the last twelve months, capex totalled $425 million, covered by operating cash flow. However, rising capex reduces free cash flow available for dividends and debt reduction.
Free cash flow over the last twelve months, calculated as operating cash flow minus capex, was about $440 million. This is less than net profit for the same period, indicating a high level of non-cash charges. To sustain dividends and service debt, the company needs to generate stable operating cash flow, and the second quarter showed this is possible.
Net debt stands at $1,291 million, or 2.69x LTM EBITDA; leverage has not declined
Net debt at the end of Q2 2026 was $1,291 million. This is 0.3 billion roubles higher than twelve months ago and virtually unchanged from the previous reporting date. The net debt to EBITDA ratio over the last twelve months is 2.69. This is a moderate level, but it is not declining despite the Q2 profit growth.
The increase in net debt over the year is explained by the first-quarter loss, which required funding. In Q2 the company did not make significant efforts to reduce debt, directing funds to capex and dividends. At the current LTM EBITDA level ($456.5 million), debt servicing requires about 10% of revenue, which is acceptable but leaves little margin of safety.
It is important to note that the net debt to EBITDA ratio has not declined, even though Q2 quarterly EBITDA was high. This is because the denominator (LTM EBITDA) remains low due to the first quarter. If the company can sustain EBITDA at the Q2 level, the debt to EBITDA ratio would fall below 1.0, but for now that is only a prospect.
Dividend yield of 2.9% rests on a payout supported by $363 million of LTM net profit
The dividend yield over the last twelve months is 2.9%. The company pays dividends supported by LTM net profit of $363 million. At the current market capitalisation of $5,036 million, dividend payments amount to about $144 million per year. This corresponds to a payout ratio of about 40% of LTM net profit, which is a moderate level.
Our estimate for the current year's dividend assumes the company maintains a payout ratio of 40% of normalised earnings. If Q2 profit ($514 million) proves sustainable, annual profit could reach about $1,000 million, allowing dividends of about $400 million, or roughly 4.0% yield. However, this estimate is ours, and it depends on the absence of new one-off write-offs similar to the first-quarter loss.
The 2.9% yield exceeds the key rate, making the stock attractive for income investors. However, the dividend is not protected from a profit decline: if LTM EBITDA remains at $456.5 million, the payout ratio could rise to 80% or more, creating a risk of a dividend cut. The company may reduce payments if capex continues to grow, as in Q2 ($149 million).
EV/EBITDA LTM of 13.7 versus the three-year average of 5.0 – the market prices a profit recovery not yet confirmed
EV/EBITDA over the last twelve months is 13.7. This is significantly above the three-year average of 5.0. Such a high multiple is explained by the low LTM EBITDA base ($456.5 million), which was hit by the first-quarter loss. If we use Q2 EBITDA ($642 million) annualised, the multiple falls to about 5.0, in line with the historical average.
P/E LTM is 13.9, also above historical levels but not as dramatically as EV/EBITDA. Market capitalisation is $5,036 million, net debt is $1,291 million, giving an EV of about $6,327 million. With LTM EBITDA of $456.5 million, EV/EBITDA = 13.9. The market thus values the company on expectations of EBITDA recovery to a level close to the quarterly figure.
Our model, based on current commodity prices and a target EV/EBITDA, implies 44% upside to fair value. This is our own estimate, not a market consensus. It assumes EBITDA normalises at a level close to the Q2 figure and that one-off write-offs do not recur. If the first-quarter loss was structural rather than one-off, the current valuation may prove overstated.
Valuation on the latest reported figures
| Metric | Value |
|---|---|
| Market cap | 5.04 bn USD |
| P/E (LTM) | 13.9 |
| EV/EBITDA (LTM) | 13.7 |
| P/B | 1.37 |
| Net debt / EBITDA (LTM) | 2.69 |
| Operating cash flow (LTM) | 0.86 bn |
| ROE | 65.1% |
| Dividend yield (12m) | 2.9% |
| EV/EBITDA, 3-year average | 5.0 |
Bottom line
Bottom line: Q2 2026 showed a strong recovery – revenue up 32.6%, EBITDA up 62.5%, net profit nearly tripled. However, these results came after a disastrous first quarter with a $711 million loss that offset all Q2 profit. The company retains a high EV/EBITDA multiple (13.7 versus the historical average of 5.0), reflecting market expectations of a sustained recovery. The 2.9% dividend yield and 44% upside on the portal model make the stock attractive, but only if the first-quarter loss was one-off. The key question for a holder is whether the company can sustain quarterly EBITDA at $642 million and reduce debt.
Open the company's financial profile CRC →
See also: market overview · valuation map · stock screeners