Devon Energy Corporation: quarterly profit doubled on merger and hedging, but debt rose by $2.5 billion

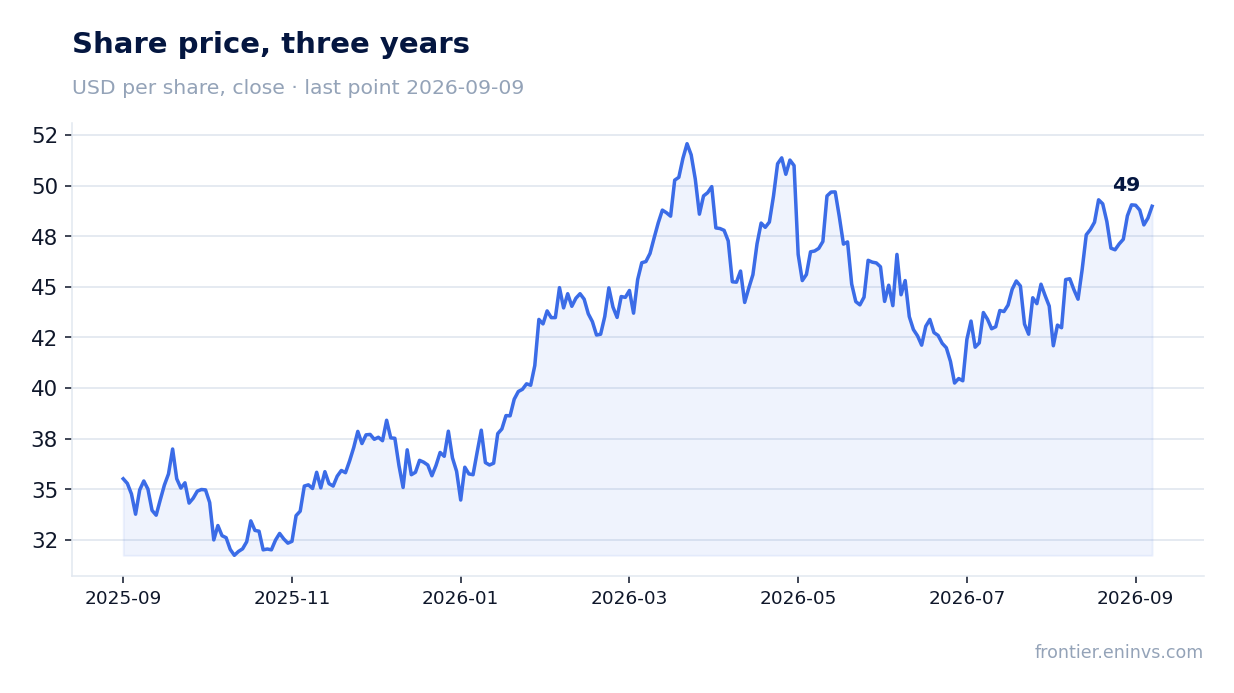
4 августа Devon Energy Corporation раскрыла результаты за второй квартал 2026 года: выручка выросла на 19,0% год к году до 5 100 млн долл., EBITDA – на 83,1% до 3 800 млн, чистая прибыль – на 111,3% до 1 900 млн. Рост во многом обеспечен слиянием с Coterra и переоценкой деривативов, тогда как долг за квартал увеличился на 2,5 млрд долл. Акции выглядят скорее привлекательно: мультипликаторы ниже собственной истории, но модель портала указывает на потенциал снижения.
Key takeaways
— Выручка выросла на 19% за счёт слияния с Coterra и высоких цен на нефть
— EBITDA-маржа удвоилась до 74,5% благодаря разовым эффектам от деривативов и слияния
— Чистая прибыль выросла более чем вдвое, но значительная часть – бумажная
— Операционный денежный поток вырос до 3 700 млн, но капзатраты поглотили 36%
— Долг вырос на 2,5 млрд за квартал из-за финансирования слияния
— Дивидендная доходность 2,1% – ниже исторической, но выплаты подкреплены денежным потоком
— Оценка: P/E 11,7 и EV/EBITDA 5,8 – ниже средних за 3 года, но модель портала даёт -67%
Attractiveness
Key figures, USD bn
| Metric | Q2 2025 | Q2 2026 | Change |
|---|---|---|---|
| Revenue | 4.28 | 5.10 | +19.0% |
| EBITDA | 2.08 | 3.80 | +83.1% |
| Operating profit | 1.16 | 2.38 | +105.3% |
| Net profit | 0.90 | 1.90 | +111.3% |
| Operating cash flow | 1.54 | 3.70 | +139.5% |
| Capex | 0.96 | 1.32 | +37.9% |
| EBITDA margin | 48.4% | 74.5% | +26.1 pp |
| Net margin | 21.0% | 37.3% | +16.3 pp |
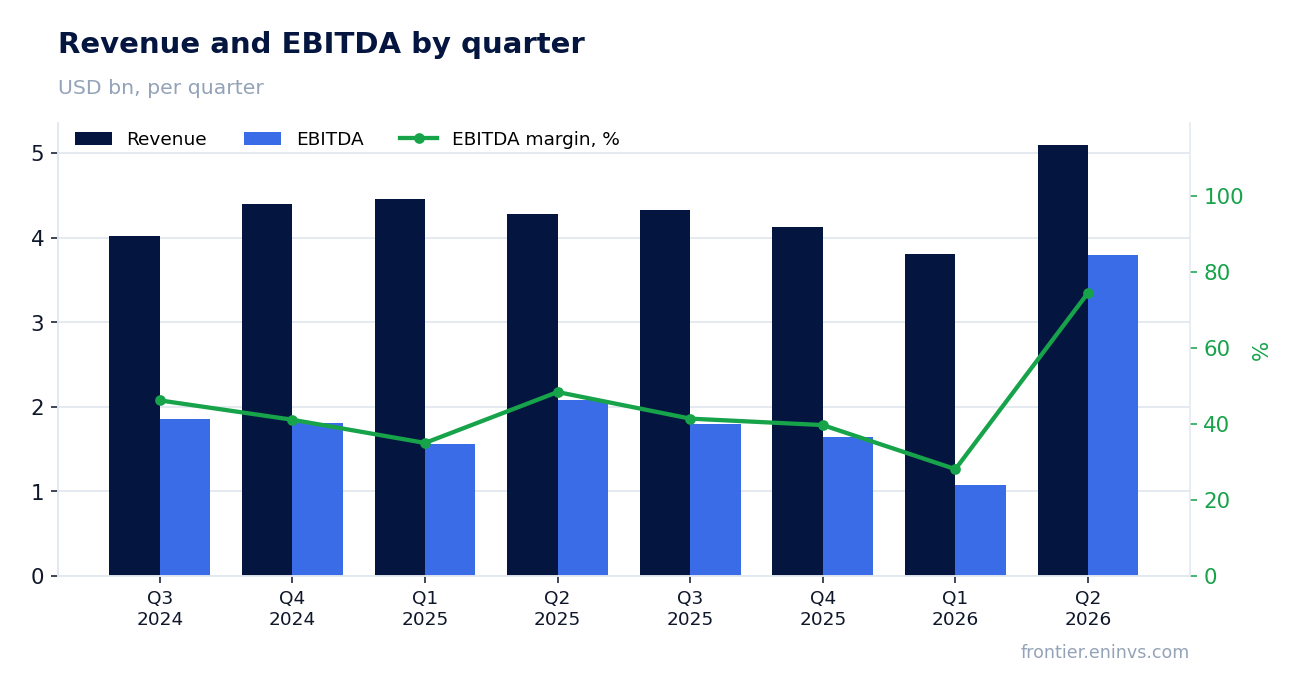
Revenue grew 19% on the Coterra merger and higher oil prices
In Q2 2026, Devon Energy Corporation's revenue reached $5,100 million, up 19.0% year-over-year. The main driver was the merger with Coterra completed on May 7, 2026: oil production rose from 387 to 503 thousand barrels per day, and total production in oil equivalent from 841 to 1,359 thousand barrels per day. Higher oil prices also contributed: the average WTI price in Q2 was $92.47 per barrel versus $63.95 a year earlier.
Revenue growth accelerated after two quarters of decline: in Q4 2025 revenue fell 6.4% YoY, and in Q1 2026 by 14.5%. In Q2 2026 growth reached 19.0%, reflecting both the Coterra consolidation and favorable pricing.
EBITDA margin doubled to 74.5% on one-off derivative and merger effects
EBITDA in Q2 2026 reached $3,800 million, up 83.1% YoY. The EBITDA margin rose to 74.5% from 48.4% a year earlier. This jump is explained not only by operational efficiency but also by one-off items: derivative gains were $414 million versus $236 million a year earlier, as well as merger effects including asset revaluation.
Excluding these factors, operating profit rose from $1,161 to $2,384 million, also reflecting higher prices and volumes. However, the sustainability of the 74.5% margin is questionable: in Q1 2026 the EBITDA margin was only 28.1% ($1,070 million EBITDA on $3,807 million revenue), indicating volatility.
Net profit more than doubled, but a significant part is paper
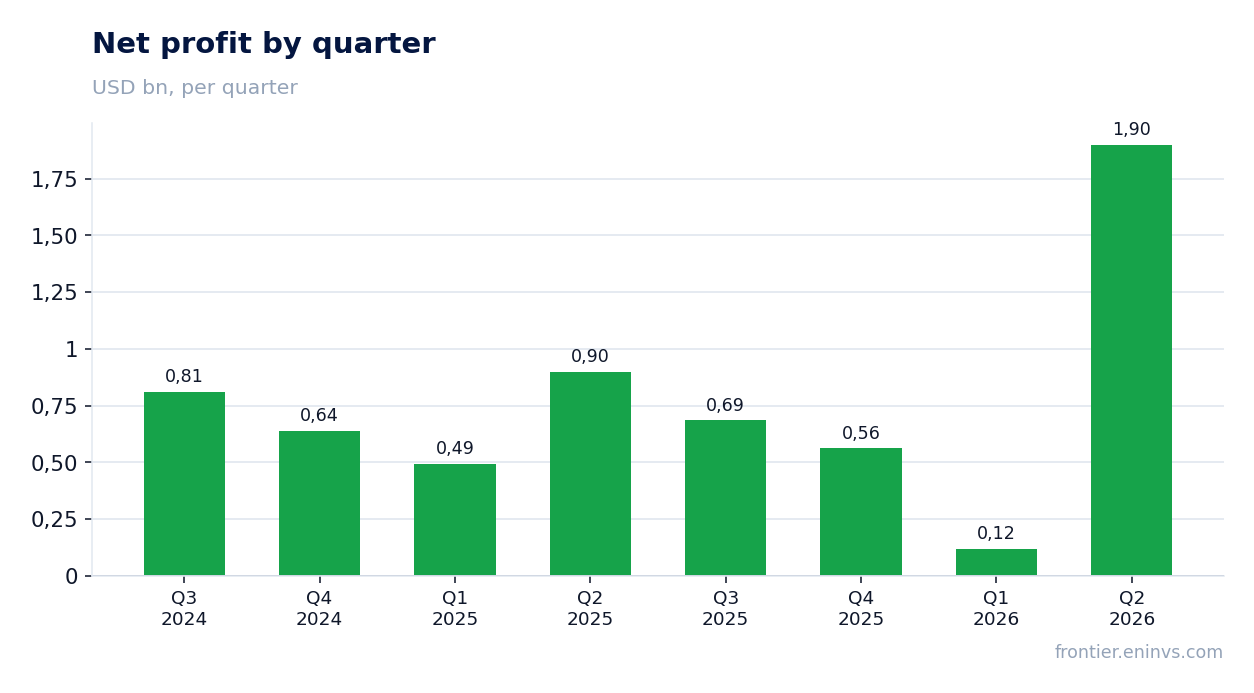
Net profit in Q2 2026 reached $1,900 million, up 111.3% YoY ($899 million a year earlier). Growth was driven by operating results and derivative revaluation: the fair value of financial instruments rose by $530 million pre-tax. Excluding these and other one-off items, core earnings were $1,479 million, or $1.57 per share.
In Q1 2026 net profit was only $120 million due to a derivative loss of $701 million. Thus, quarterly profit dynamics are highly dependent on market volatility, and Q2 figures should not be extrapolated to the full year.
Operating cash flow rose to $3,700 million, but capex absorbed 36%
Operating cash flow in Q2 2026 was $3,700 million versus $1,545 million a year earlier. Growth is related to higher profits and Coterra consolidation. Capital expenditures rose to $1,318 million from $956 million a year earlier, reflecting expanded operations after the merger. Free cash flow (OCF minus capex) was $2,382 million.
Over the last twelve months, operating cash flow was $6,700 million with capital expenditures of about $4,000 million (sum of quarterly values), yielding free cash flow of roughly $2,700 million. The company directs a significant portion of cash flow to dividends and buybacks: in Q2 dividends were $366 million and buybacks $197 million.
Debt rose by $2.5 billion in the quarter due to merger financing
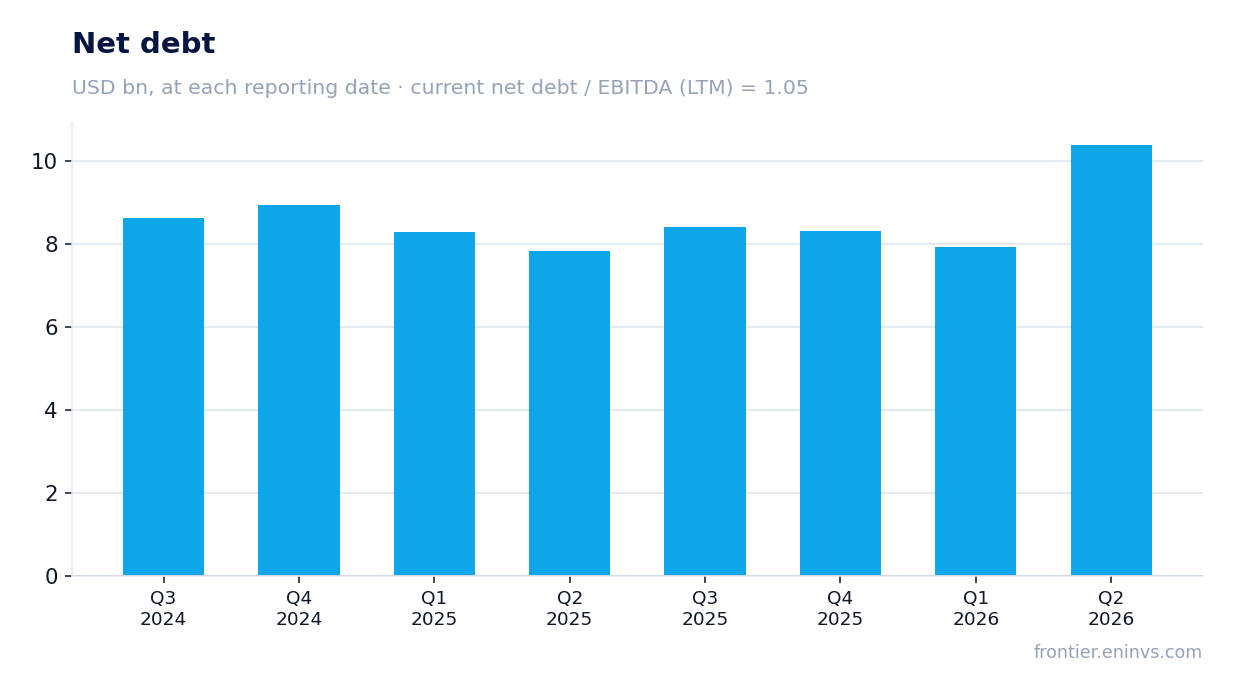
Net debt at the end of Q2 2026 was $10,388 million, up $2,457 million from the end of Q1 ($7,931 million). The increase is related to financing the Coterra merger: the company raised debt and spent $2,729 million on acquisitions. Total debt rose from $8,386 to $11,388 million, while cash fell from $1,815 to $1,009 million.
The ratio of net debt to EBITDA over the last twelve months was 1.05, a moderate level for an oil and gas company. However, given rising debt and potentially lower oil prices, this metric could deteriorate. The company retains an investment-grade rating and access to capital markets.
Dividend yield of 2.1% is below historical, but payments are backed by cash flow
Over the last twelve months, Devon Energy Corporation paid dividends yielding 2.12% on the current share price. In Q2 2026 dividends were $366 million, roughly $0.39 per share. The company pays a fixed dividend plus a variable dividend tied to free cash flow.
At the current price of $44.57 per share and a dividend yield of 2.1%, payments look moderate. However, given free cash flow of about $2,700 million over the last twelve months and dividend payments of roughly $800 million over the same period, the coverage ratio exceeds 3 times. This leaves room to maintain or increase dividends if oil prices remain at current levels.
Valuation: P/E 11.7 and EV/EBITDA 5.8 – below 3-year averages, but portal model gives -67%
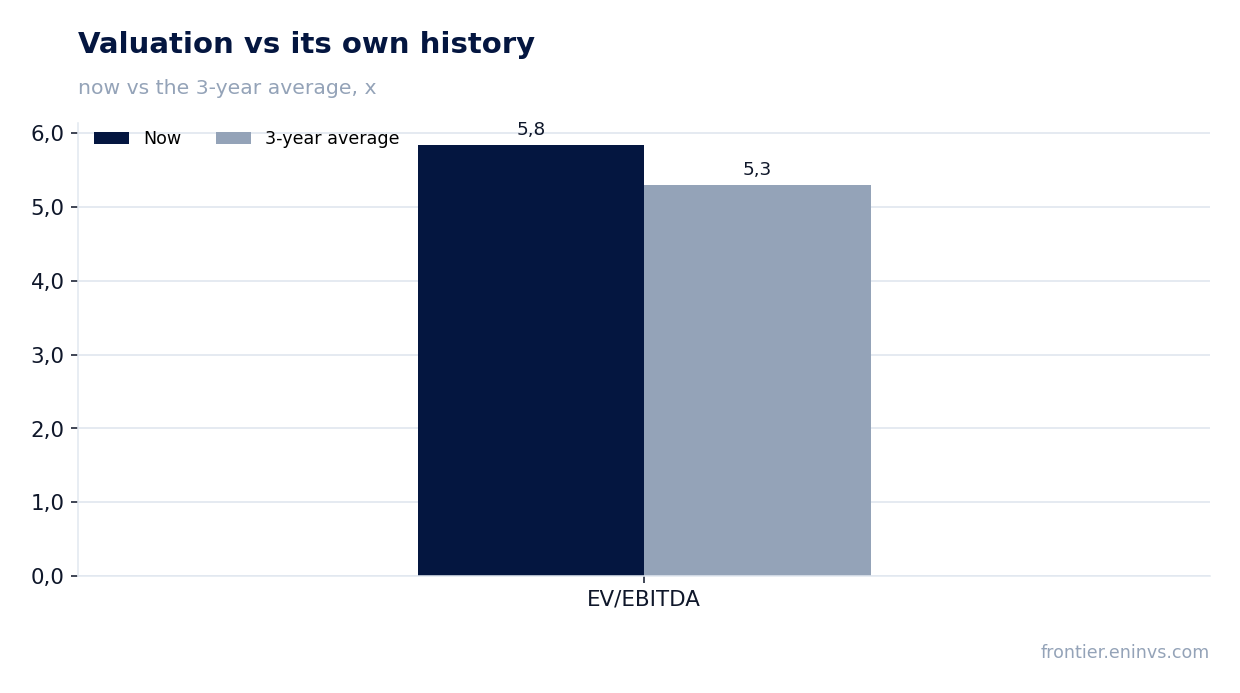
Current multiples for Devon Energy Corporation: P/E over the last twelve months is 11.7, EV/EBITDA is 5.8. The three-year average EV/EBITDA is 5.3, meaning the current multiple is 9% above its own history. P/E also looks moderate, but given one-off items in profit, the adjusted P/E may be higher.
The portal's model, which re-prices EBITDA at current commodity prices and target EV/EBITDA, shows a potential downside of 67% from the current price. This implies the market is already pricing in high oil prices, and any decline could lead to a significant correction. The shares look rather attractive against their own history, but with caution given the portal model.
Valuation on the latest reported figures
| Metric | Value |
|---|---|
| Market cap | 38.1 bn USD |
| P/E (LTM) | 11.7 |
| EV/EBITDA (LTM) | 5.8 |
| P/B | 2.45 |
| Net debt / EBITDA (LTM) | 1.05 |
| Operating cash flow (LTM) | 6.70 bn |
| ROE | 26.6% |
| Dividend yield (12m) | 2.1% |
| EV/EBITDA, 3-year average | 5.3 |
Bottom line
The Q2 2026 report showed strong results: revenue and profit more than doubled YoY, driven by the Coterra merger and high oil prices. However, a significant part of profit is paper, related to derivative revaluation, and debt rose by $2.5 billion to finance the deal. Dividends are covered by free cash flow with a margin, but the yield of 2.1% is modest. At the current price, shares trade below their three-year average multiples, but the portal model indicates downside potential. Verdict – rather attractive: growth is backed by real assets, but investors should watch oil prices and the company's ability to reduce debt.
Open the company's financial profile DVN →
See also: market overview · valuation map · stock screeners