EQT Corporation: Q2 2026 revenue down 29.2%, yet EBITDA margin holds at 66.5%
On August 25, EQT Corporation reported Q2 2026 results: revenue fell 29.2% YoY to $1,809.94 million, EBITDA dropped 31.6% to $1,083.63 million, and net profit declined 73.0% to $211.425 million. Despite the drop, EBITDA margin remained high at 66.5% versus 68.7% a year earlier. At the current price, the share looks rather unattractive: EV/EBITDA of 5.97 is below its own three-year average of 9.63, but the portal's model implies a -30% downside.
Key takeaways
— Q2 2026 revenue fell 29.2% YoY to $1,809.94 million, after a 94.2% surge in the previous quarter.
— EBITDA margin stayed high at 66.5% versus 68.7% a year earlier, despite the revenue decline.
— Net profit dropped 73.0% to $211.425 million, reflecting a 65.3% decrease in operating profit.
— Leverage stood at 1.09x EBITDA for the trailing twelve months, with net debt down $0.1 billion from the previous reporting date.
— The stock trades at 5.97x EV/EBITDA – below its three-year average of 9.63x, but the portal's model implies a 30% downside.
— Trailing dividend yield is 1.19%, below the level we consider fair for this sector.
Attractiveness
Key figures, USD bn
| Metric | Q2 2025 | Q2 2026 | Change |
|---|---|---|---|
| Revenue | 2.56 | 1.81 | -29.2% |
| EBITDA | 1.76 | 1.20 | -31.6% |
| Operating profit | 1.13 | 0.39 | -65.3% |
| Net profit | 0.78 | 0.21 | -73.0% |
| Operating cash flow | 1.24 | 1.05 | -15.6% |
| Capex | 0.55 | 0.65 | +18.3% |
| EBITDA margin | 68.7% | 66.5% | -2.2 pp |
| Net margin | 30.7% | 11.7% | -19.0 pp |
Q2 2026 revenue fell 29.2% YoY to $1,809.94 million, after a 94.2% surge in the previous quarter.
In Q2 2026, EQT Corporation's revenue amounted to $1,809.94 million, down 29.2% from the same period a year earlier. This is a sharp slowdown after an impressive 94.2% surge in Q1 2026, when revenue reached $3,378.736 million.
The decline reflects dynamics in natural gas prices and sales volumes. The company does not disclose the revenue structure in the provided data, so the exact reason for the decrease is not stated, but it is clear that after an abnormally strong first quarter, a correction followed.
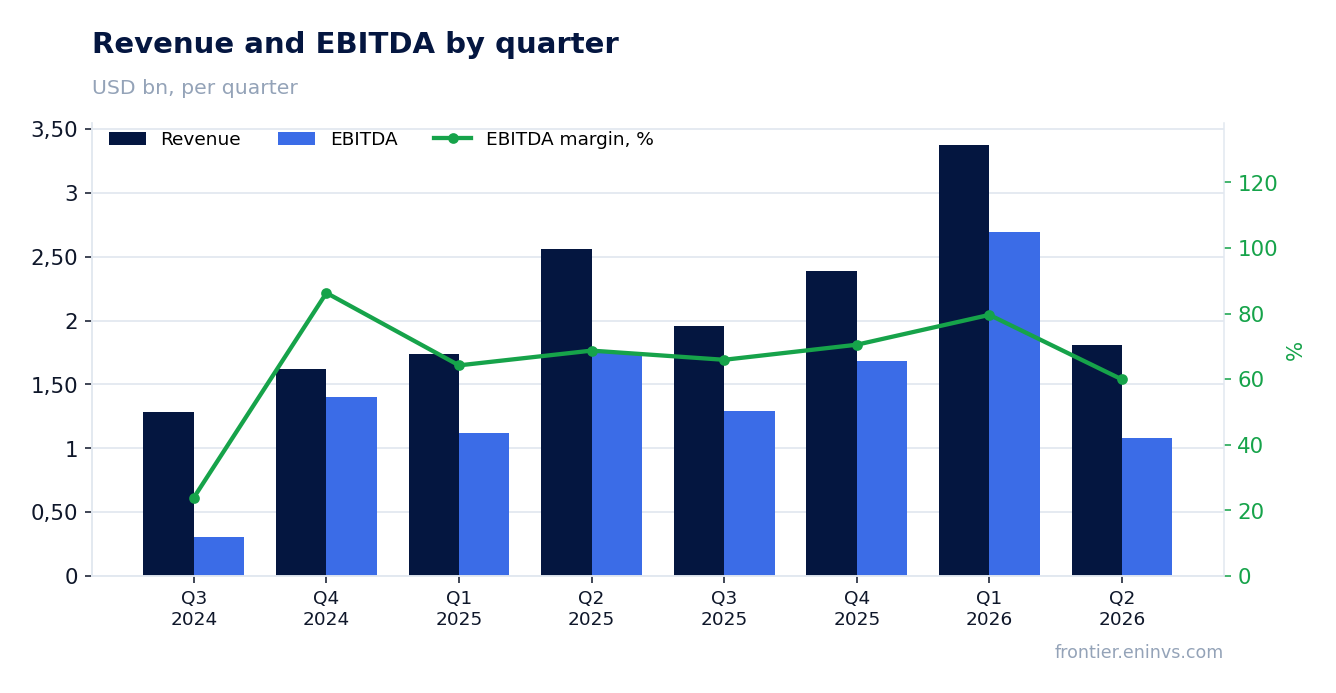
EBITDA margin stayed high at 66.5% versus 68.7% a year earlier, despite the revenue decline.
EBITDA in Q2 2026 amounted to $1,083.63 million, down 31.6% YoY. However, the EBITDA margin remained high at 66.5% versus 68.7% in Q2 2025.
The 2.2 percentage point decline in margin is relatively modest, indicating control over operating costs. Nevertheless, operating profit fell more sharply – by 65.3% to $394.038 million – pointing to higher depreciation or other non-EBITDA items.
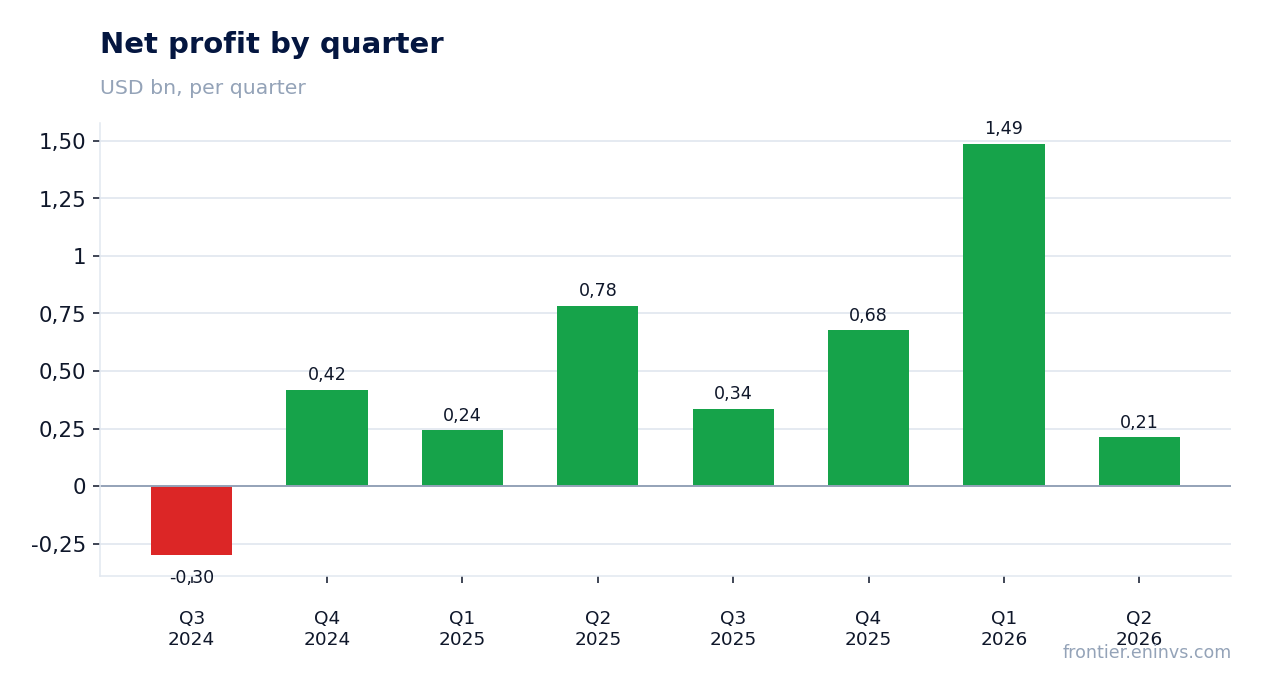
Net profit dropped 73.0% to $211.425 million, reflecting a 65.3% decrease in operating profit.
Net profit in Q2 2026 was $211.425 million, down 73.0% from a year earlier. The decline significantly outpaced the EBITDA drop, suggesting higher interest expenses or tax charges.
Operating profit fell to $394.038 million from $1,134.038 million in Q2 2025. Net margin dropped to 11.7% from 30.7% a year earlier, reflecting not only the operational decline but also, likely, one-off factors affecting financial items.
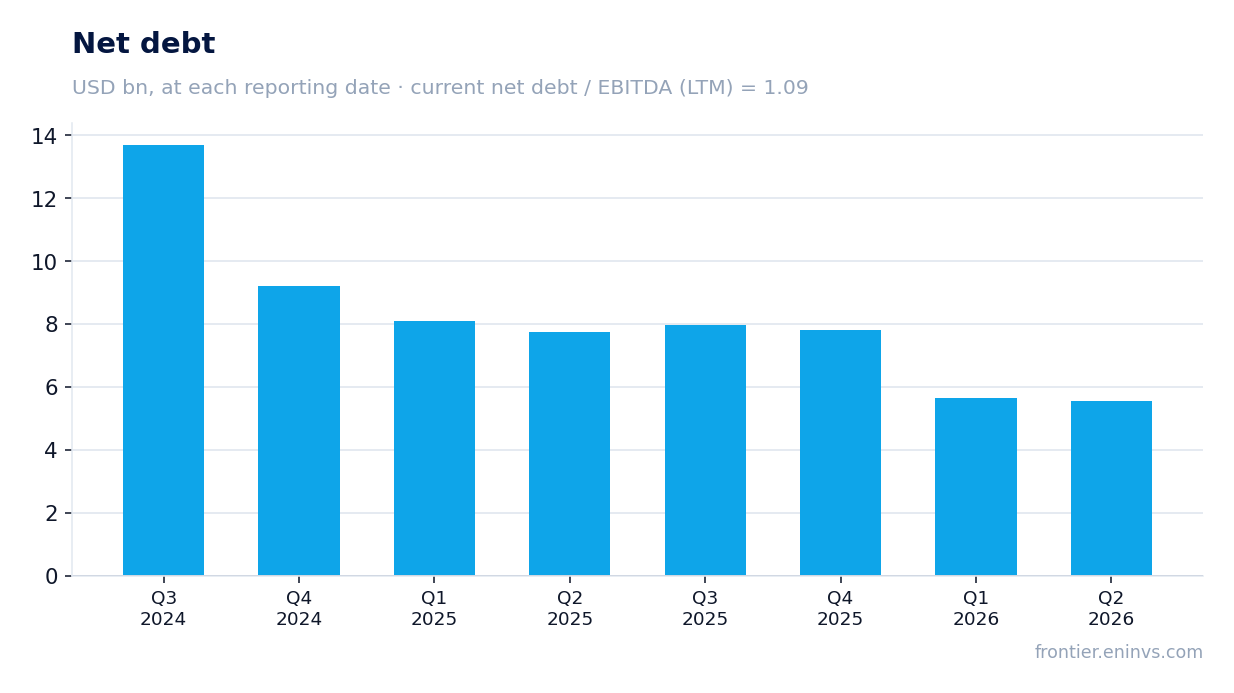
Leverage stood at 1.09x EBITDA for the trailing twelve months, with net debt down $0.1 billion from the previous reporting date.
At the end of Q2 2026, EQT Corporation's net debt stood at $5,542.9 million, down $0.1 billion from the previous reporting date ($5,665.843 million). Over the trailing twelve months, net debt decreased by $2.2 billion.
The net debt to EBITDA ratio for the trailing twelve months – 1.09 – remains moderate for the sector. Operating cash flow for the quarter was $1,048.012 million, comfortably covering capital expenditures of $650.171 million.
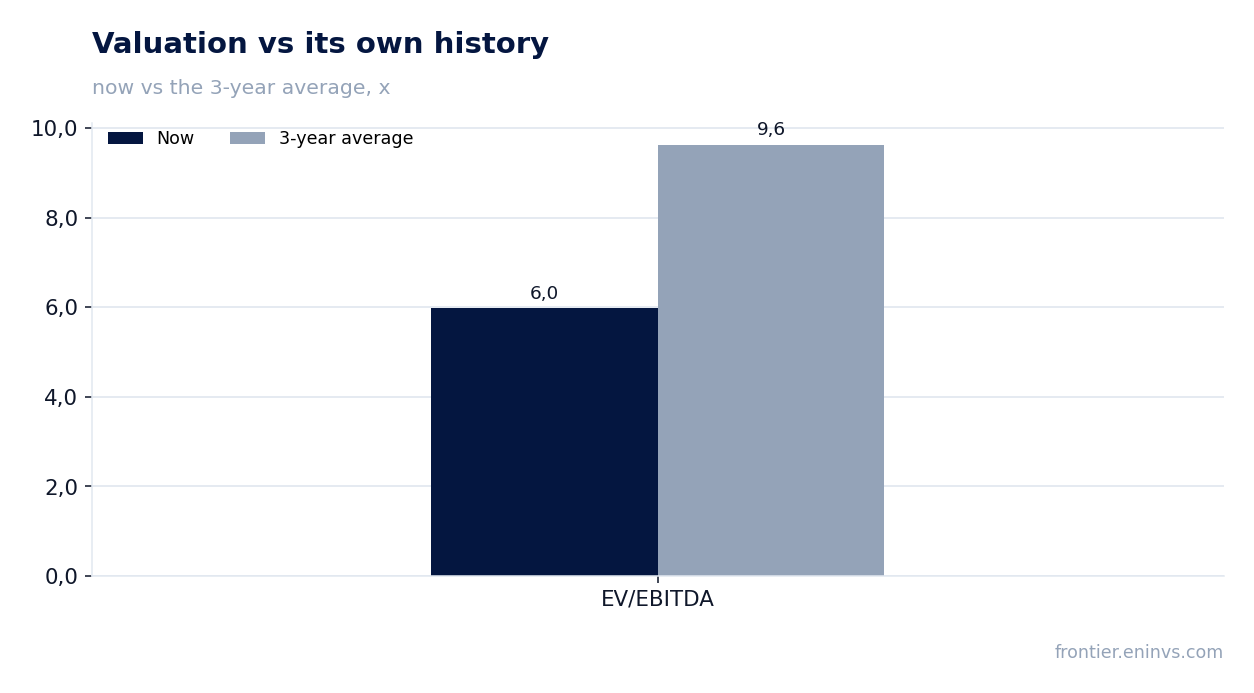
The stock trades at 5.97x EV/EBITDA – below its three-year average of 9.63x, but the portal's model implies a 30% downside.
The current EV/EBITDA multiple is 5.97, notably below the three-year average of 9.63. Formally, this suggests a cheap valuation relative to its own history.
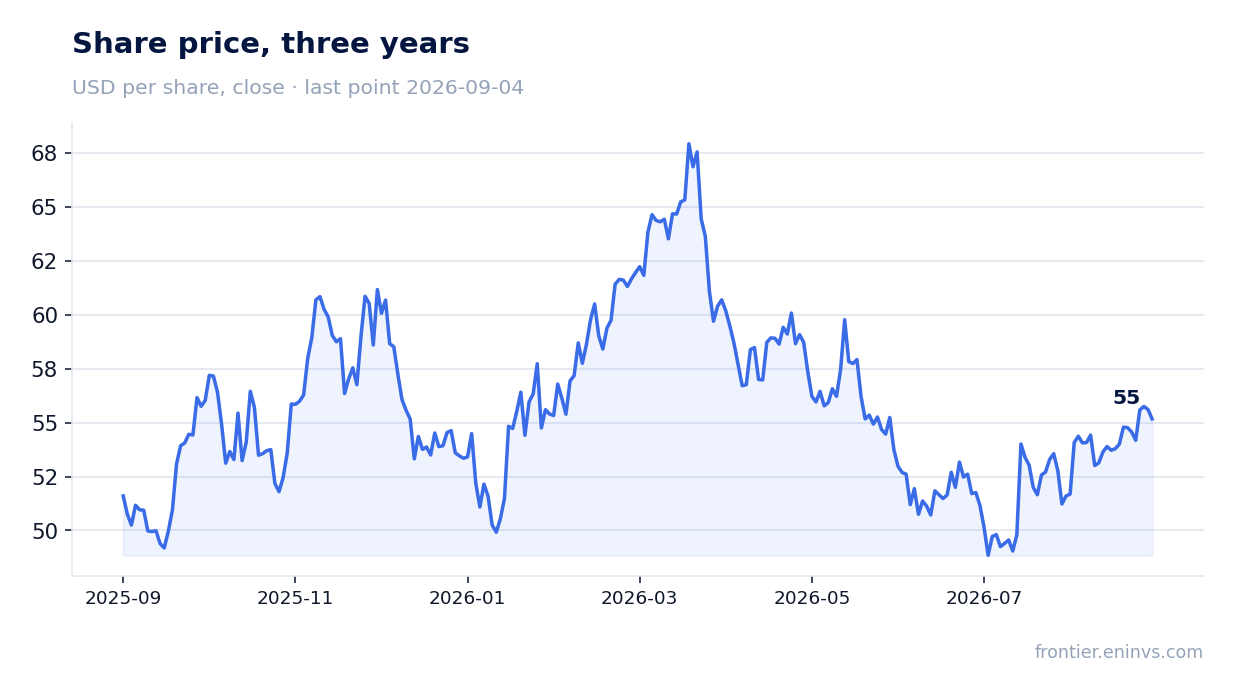
However, the portal's model, which re-prices EBITDA at current commodity prices and applies a target multiple, implies a -30% downside from the current market price. This means the market may already be pricing in a deterioration in the environment, but the model believes the decline is not yet fully reflected in the price.
Trailing dividend yield is 1.19%, below the level we consider fair for this sector.
Over the trailing twelve months, EQT Corporation's dividend yield was 1.19%. This is a modest level that is unlikely to attract income-oriented investors.
At the same time, the company generates sufficient operating cash flow – $5,100.0 million over the trailing twelve months – to support dividends and fund capital expenditures. However, given the potential downside per the portal's model, the current yield does not compensate for possible capital losses.
Valuation on the latest reported figures
| Metric | Value |
|---|---|
| Market cap | 34.8 bn USD |
| P/E (LTM) | 12.8 |
| EV/EBITDA (LTM) | 6.0 |
| P/B | 1.46 |
| Net debt / EBITDA (LTM) | 1.09 |
| Operating cash flow (LTM) | 5.10 bn |
| ROE | 3.4% |
| Dividend yield (12m) | 1.2% |
| EV/EBITDA, 3-year average | 9.6 |
Bottom line
In Q2 2026, EQT Corporation showed a sharp decline in financial results: revenue fell 29.2%, net profit dropped 73.0%. EBITDA margin remained high, and leverage was moderate. However, the stock's valuation does not look attractive: despite a multiple below its historical average, the portal's model implies a 30% downside. Dividend yield is low. We view the share as rather unattractive: the current price does not account for possible further deterioration in the market environment.
Open the company's financial profile EQT →
See also: market overview · valuation map · stock screeners