Diamondback Energy: Q2 2026 revenue and profit soar on higher oil prices, but the stock price already reflects this
On August 25, 2026, Diamondback Energy reported results for the second quarter of 2026. Revenue rose 51.2% year-over-year to $5,562 million, EBITDA increased 63.8% to $3,940 million, and net profit jumped 169.2% to $1,882 million. Against these figures, the shares look attractive, but only if oil prices remain at current levels.
Key takeaways
— Revenue in Q2 2026 rose 51.2% year-over-year to $5,562 million, driven by higher oil prices and increased production volumes
— EBITDA margin reached 70.8% in Q2 2026 versus 65.4% a year earlier, reflecting operating leverage at high oil prices
— Net profit in Q2 2026 was $1,882 million, up 169.2% year-over-year, helped by higher oil prices and lower costs
— Operating cash flow in Q2 2026 was $3,589 million, allowing net debt to be reduced by $1.6 billion compared to the previous quarter
— Capital expenditures in Q2 2026 fell to $438 million, contributing to higher free cash flow
— Dividend yield over the trailing twelve months is 2.1%, below the key rate, but payments are backed by strong cash flow
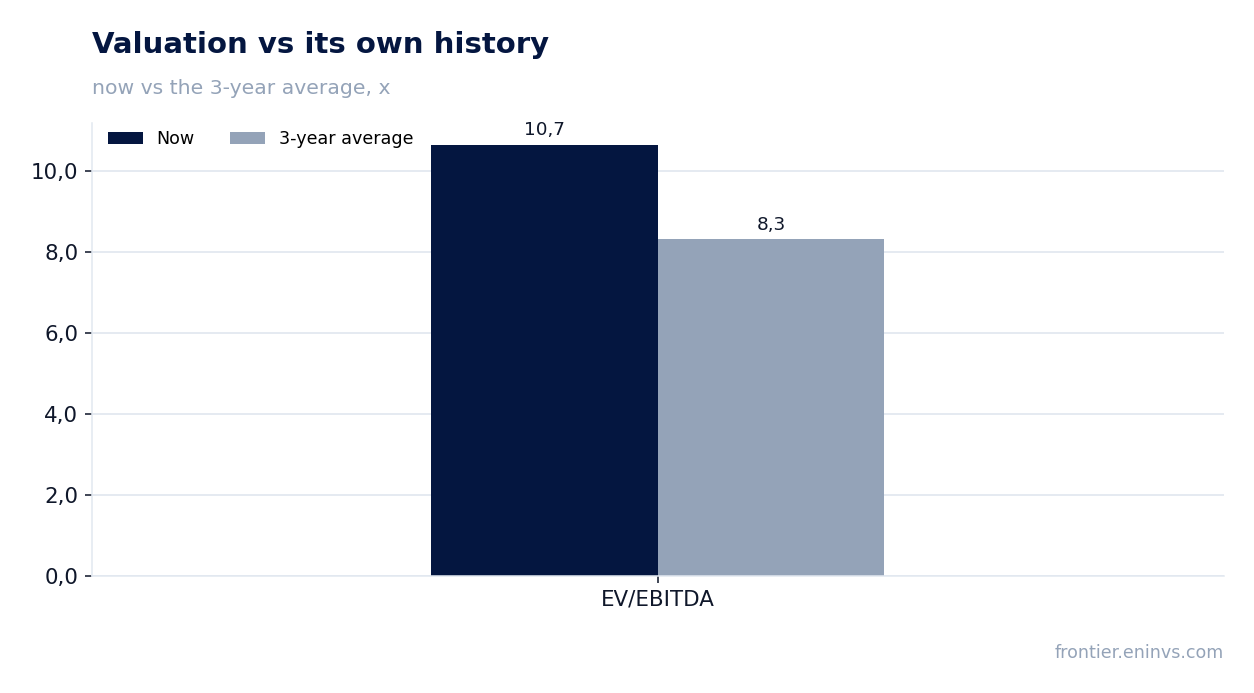
— Shares trade at an EV/EBITDA multiple of 10.65, above the three-year average of 8.31, and the portal's model implies -77% upside
Attractiveness
Key figures, USD bn
| Metric | Q2 2025 | Q2 2026 | Change |
|---|---|---|---|
| Revenue | 3.68 | 5.56 | +51.2% |
| EBITDA | 2.40 | 3.94 | +63.8% |
| Operating profit | 1.14 | 2.51 | +120.5% |
| Net profit | 0.70 | 1.88 | +169.2% |
| Operating cash flow | 1.68 | 3.59 | +114.0% |
| Capex | 0.86 | 0.44 | -49.3% |
| EBITDA margin | 65.4% | 70.8% | +5.4 pp |
| Net margin | 19.0% | 33.8% | +14.8 pp |
Revenue in Q2 2026 rose 51.2% year-over-year to $5,562 million, driven by higher oil prices and increased production volumes
In Q2 2026, Diamondback Energy reported revenue of $5,562 million, up 51.2% from the same period last year. The main driver was higher oil prices, which accounted for a significant portion of the increase. The company also ramped up production volumes, further supporting revenue.
Revenue dynamics over recent quarters have been uneven: in Q1 2026, growth was only 4.7% year-over-year, while in Q2 it accelerated to 51.2%. This reflects the volatility of oil prices and their direct impact on the company's financial results.
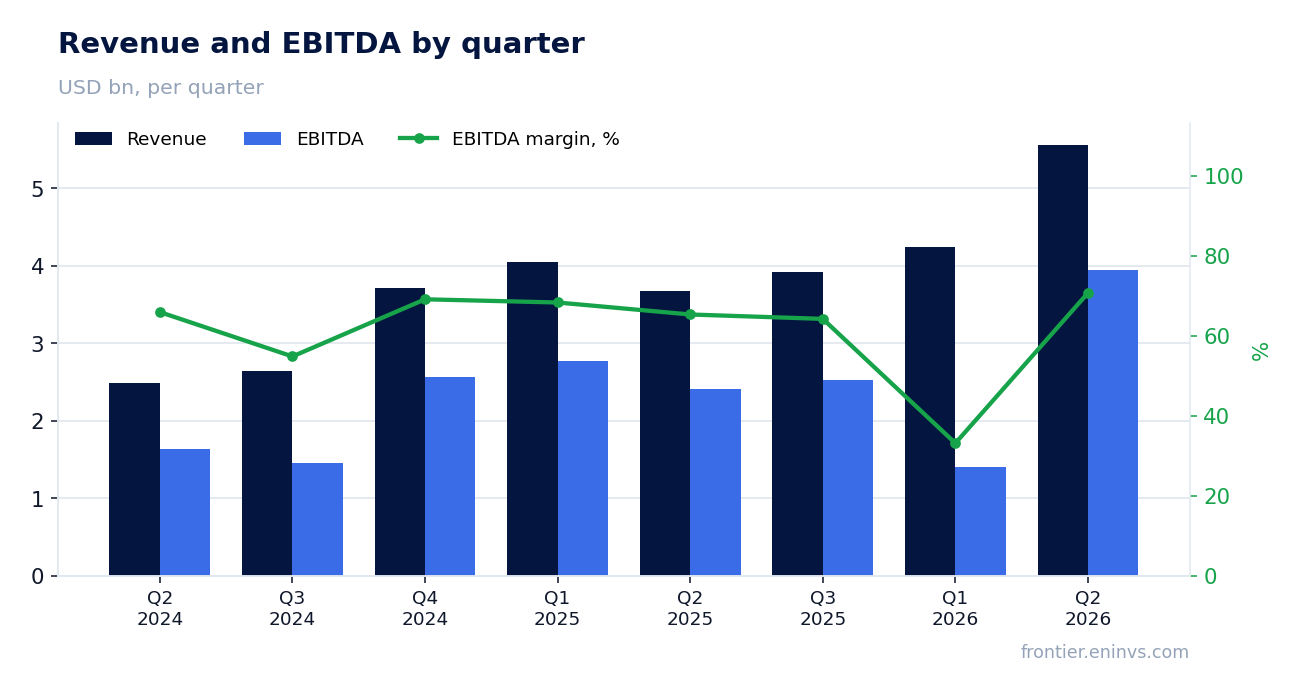
EBITDA margin reached 70.8% in Q2 2026 versus 65.4% a year earlier, reflecting operating leverage at high oil prices
EBITDA in Q2 2026 was $3,940 million, corresponding to a margin of 70.8%. A year earlier, the margin was lower at 65.4%. The increase in profitability is explained by the fact that production costs did not rise proportionally to revenue, providing operating leverage.
High margin is a key indicator for an oil producer, as it shows how much of the revenue remains after covering operating expenses. The level of 70.8% is among the highest in the industry, indicating the efficiency of Diamondback Energy's operations.
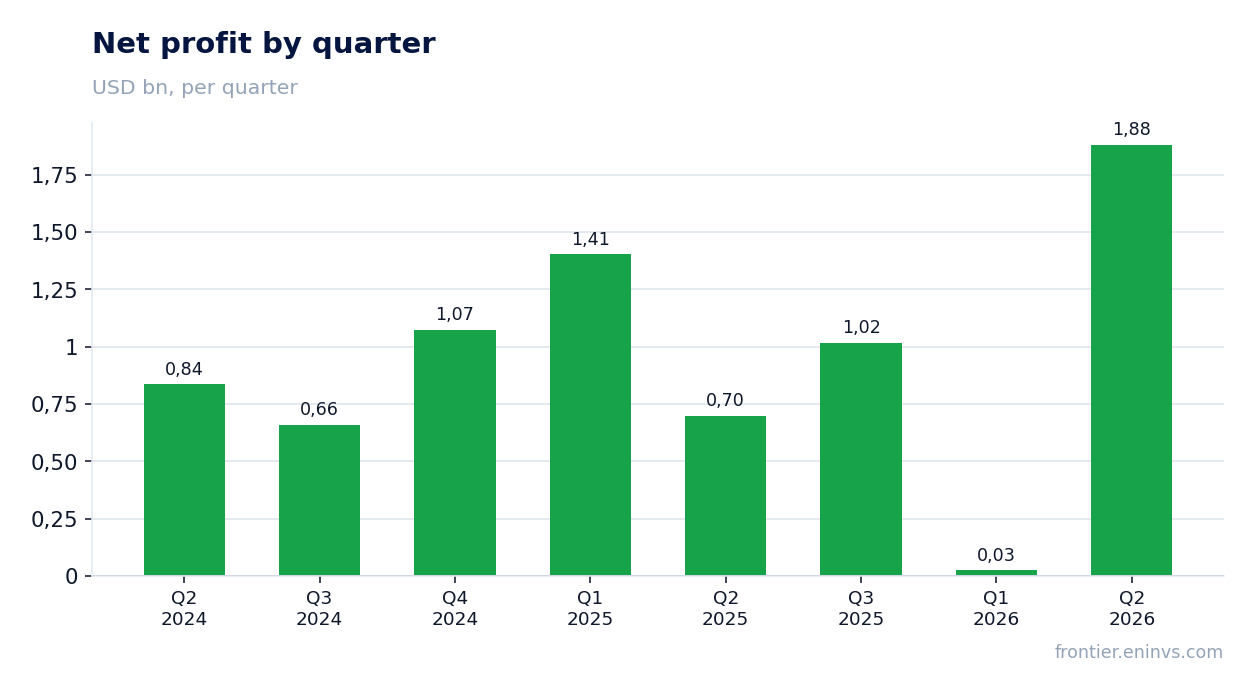
Net profit in Q2 2026 was $1,882 million, up 169.2% year-over-year, helped by higher oil prices and lower costs
Net profit in Q2 2026 reached $1,882 million, up 169.2% year-over-year. Profit growth significantly outpaced revenue growth, which is explained by operating leverage and possibly one-off factors such as revaluation or tax effects.
For comparison, in Q1 2026 net profit was only $25 million, due to low operating profit ($116 million). In Q2, operating profit rose to $2,512 million, driving the jump in net profit.
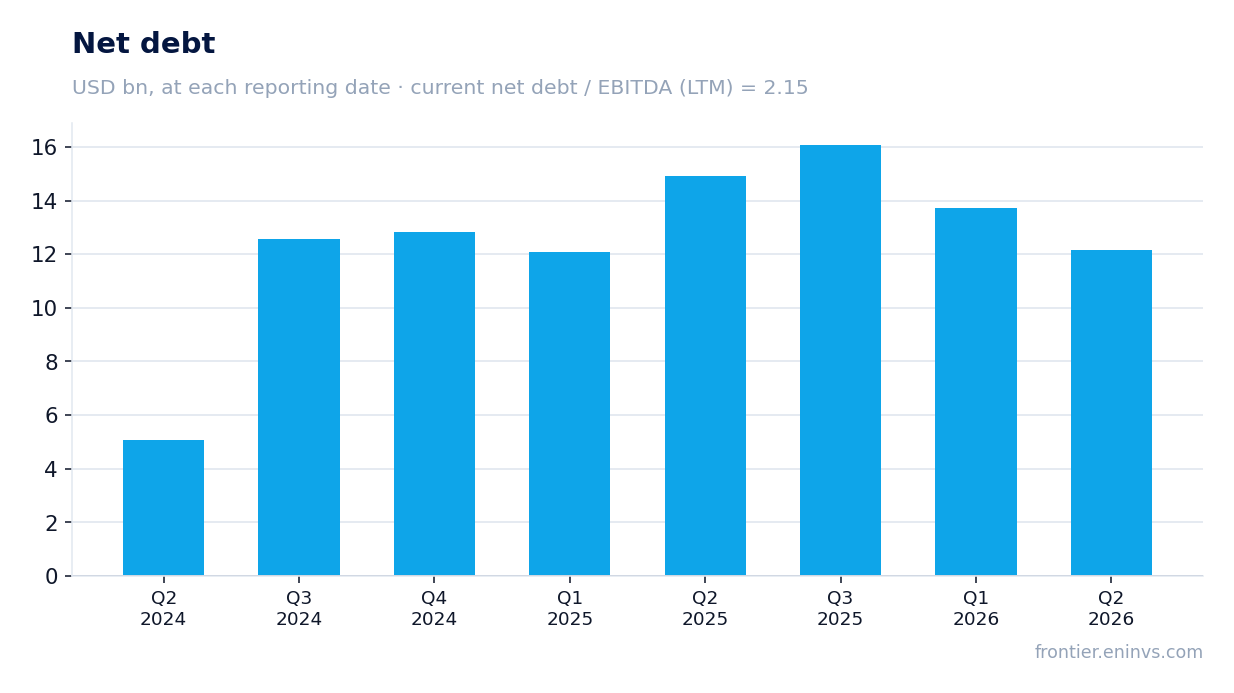
Operating cash flow in Q2 2026 was $3,589 million, allowing net debt to be reduced by $1.6 billion compared to the previous quarter
Operating cash flow in Q2 2026 was $3,589 million, significantly higher than in previous quarters. This allowed the company to reduce net debt by $1.6 billion compared to the end of Q1 2026, when it stood at $13,724 million.
At the end of Q2 2026, net debt was $12,152 million. The ratio of net debt to EBITDA over the trailing twelve months is 2.15, which is a moderate level for an oil producer.
Capital expenditures in Q2 2026 fell to $438 million, contributing to higher free cash flow
Capital expenditures in Q2 2026 were $438 million, significantly lower than in previous quarters (e.g., $933 million in Q1 2026). The reduction in capex, combined with high operating cash flow, led to an increase in free cash flow.
Free cash flow (OCF minus capex) in Q2 2026 was approximately $3,151 million. This gives the company the ability to increase dividends, reduce debt, or conduct share buybacks.
Dividend yield over the trailing twelve months is 2.1%, below the key rate, but payments are backed by strong cash flow
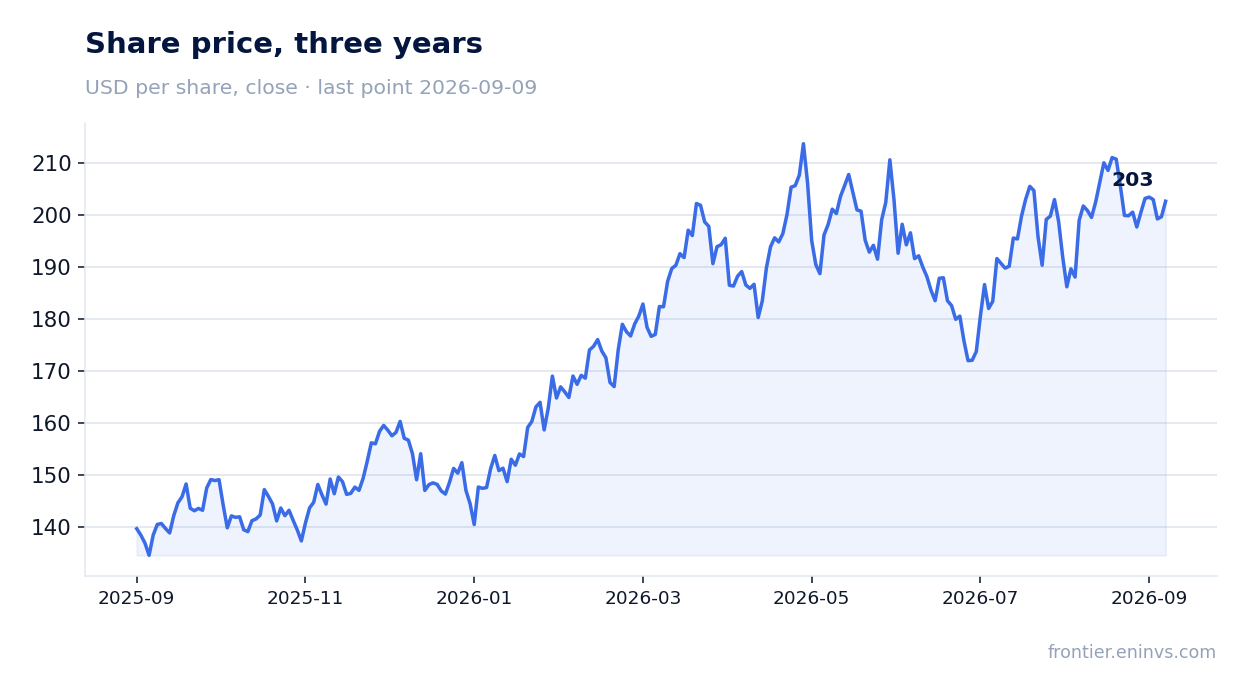
Over the trailing twelve months, Diamondback Energy has paid dividends providing a yield of 2.1% at the current share price. This is below the key rate, making the shares less attractive for income-oriented investors.
However, payments are backed by strong operating cash flow: over the trailing twelve months it was $8,800 million, which comfortably covers dividend payments. If oil prices remain at current levels, the company can afford to increase dividends.
Shares trade at an EV/EBITDA multiple of 10.65, above the three-year average of 8.31, and the portal's model implies -77% upside
The current EV/EBITDA multiple is 10.65, above the three-year average of 8.31. This means the market values the company higher than the average over the past three years, which may be justified by rising oil prices and improved operating performance.
According to the portal's model, which reprices EBITDA at current oil prices and applies a target EV/EBITDA, the upside potential for the shares is -77%. This indicates that the current price already reflects an optimistic scenario, and investors should be cautious.
Valuation on the latest reported figures
| Metric | Value |
|---|---|
| Market cap | 56.9 bn USD |
| P/E (LTM) | 38.8 |
| EV/EBITDA (LTM) | 10.7 |
| P/B | 1.54 |
| Net debt / EBITDA (LTM) | 2.15 |
| Operating cash flow (LTM) | 8.80 bn |
| ROE | 20.2% |
| Dividend yield (12m) | 2.1% |
| EV/EBITDA, 3-year average | 8.3 |
Bottom line
In Q2 2026, Diamondback Energy delivered strong results: revenue rose 51.2%, EBITDA margin reached 70.8%, and net profit more than doubled. The company generates robust operating cash flow, allowing it to reduce debt and support dividends. However, the shares already trade at a multiple above their own three-year history, and the portal's model indicates negative upside. The verdict is 'neutral': at current oil prices, the company looks solid, but upside potential is limited, and investors should wait for a more attractive entry point.
Open the company's financial profile FANG →
See also: market overview · valuation map · stock screeners