FLEX LTD.: revenue accelerated to +20.6%, but free cash flow collapsed to $41 million

29 июля FLEX LTD. раскрыла результаты за первый квартал 2026 финансового года (квартал, закончившийся 26 июня 2026). Выручка выросла на 20,6% год к году до $7 928 млн, чистая прибыль – на 48,4% до $285 млн. Однако свободный денежный поток составил лишь $41 млн против $268 млн годом ранее, что ставит вопрос о качестве прибыли. При текущей цене акция выглядит скорее привлекательно: рост ускоряется, но оценка (P/E 42,3, EV/EBITDA 22,5) значительно выше собственной трёхлетней истории, и лишь модель портала даёт потенциал +11%.
Key takeaways
— FLEX LTD. revenue accelerated to +20.6% on AI infrastructure demand
— Net profit rose 48.4%, but operating cash flow fell to $276 million
— Free cash flow collapsed to $41 million due to higher capex and one-off spin-off costs
— Net debt rose to $3,090 million, but the ratio to LTM EBITDA remains moderate at 1.08
— The company confirmed plans to spin off its Cloud & Power Infrastructure segment, creating uncertainty
— Management raised FY2027 guidance: revenue $33.7–35.2 billion, EPS $4.42–4.74
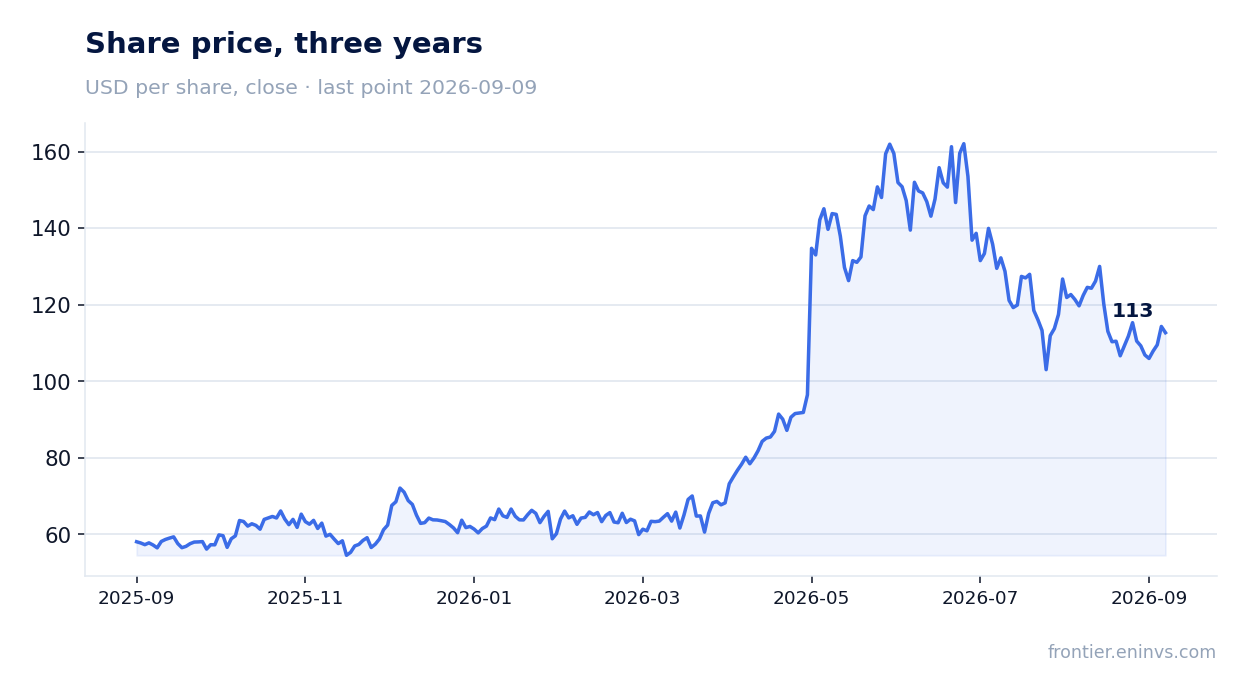
— Shares fell 9.1% on the release day but have been nearly flat since
Attractiveness
Key figures, USD bn
| Metric | Q1 2025 | Q1 2026 | Change |
|---|---|---|---|
| Revenue | 6.58 | 7.93 | +20.6% |
| EBITDA | 0.45 | 0.53 | +17.4% |
| Operating profit | 0.31 | 0.39 | +26.0% |
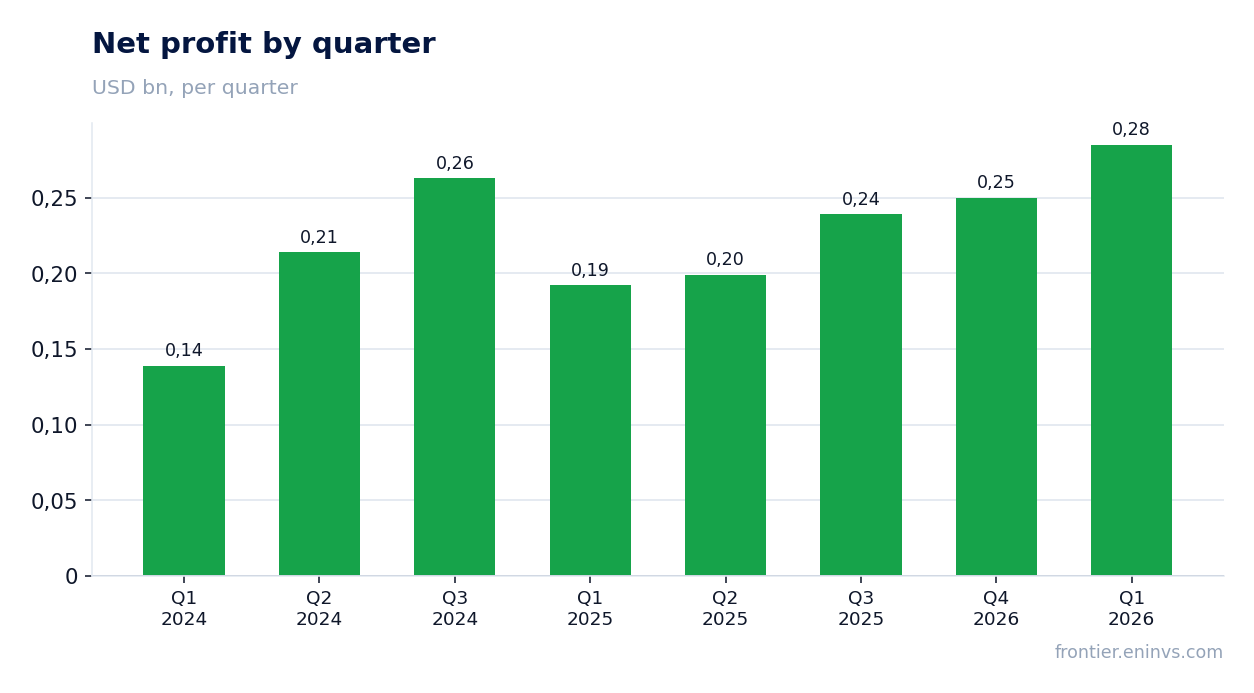
| Net profit | 0.19 | 0.28 | +48.4% |
| Operating cash flow | 0.40 | 0.28 | -30.8% |
| Capex | 0.13 | 0.24 | +77.4% |
| EBITDA margin | 6.9% | 6.7% | -0.2 pp |
| Net margin | 2.9% | 3.6% | +0.7 pp |
FLEX LTD. revenue accelerated to +20.6% on AI infrastructure demand
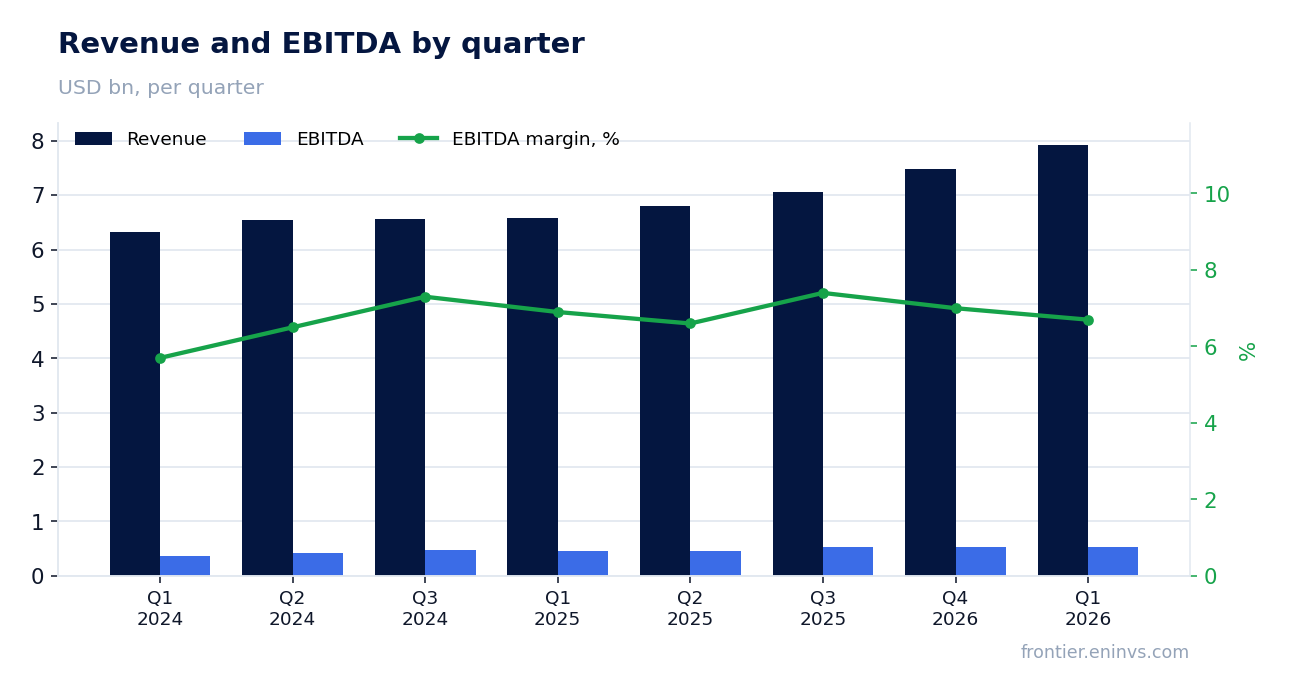
In the first quarter of fiscal 2026 (quarter ended June 26, 2026), FLEX LTD. revenue reached $7,928 million, up 20.6% year over year. This is a marked acceleration from 4.1% growth in Q1 FY2025 and 7.7% in Q3 FY2025. The company attributes the momentum to its expanding role in AI infrastructure, helping customers accelerate data center deployment.
Revenue growth was accompanied by higher operating profit: GAAP operating income rose to $392 million from $311 million a year earlier. However, GAAP operating margin was 4.9% versus 4.7% last year, reflecting faster cost growth, including restructuring and legal charges.
Net profit rose 48.4%, but operating cash flow fell to $276 million
Net profit for the reported quarter was $285 million versus $192 million a year earlier – up 48.4%. Net margin widened to 3.6% from 2.9%. The profit includes one-off items: the company recognized a $46 million gain on the divestiture of a subsidiary, partially offsetting spin-off and legal costs.
Operating cash flow, in contrast, fell to $276 million from $399 million a year earlier. The main driver was higher inventories and receivables amid rapid revenue growth: working capital changes consumed $149 million versus an inflow of $65 million last year.
Free cash flow collapsed to $41 million due to higher capex and one-off spin-off costs
Free cash flow for the quarter was just $41 million versus $268 million a year earlier. Capital expenditures rose to $236 million from $133 million, while operating cash flow declined. Additionally, FCF was negatively impacted by $24 million of separation costs related to the spin-off of the Cloud & Power Infrastructure segment.
Such a low free cash flow is rare for FLEX LTD., which typically generates substantial FCF. If the company does not restore cash generation in coming quarters, it could limit capacity for dividends and debt reduction.
Net debt rose to $3,090 million, but the ratio to LTM EBITDA remains moderate at 1.08
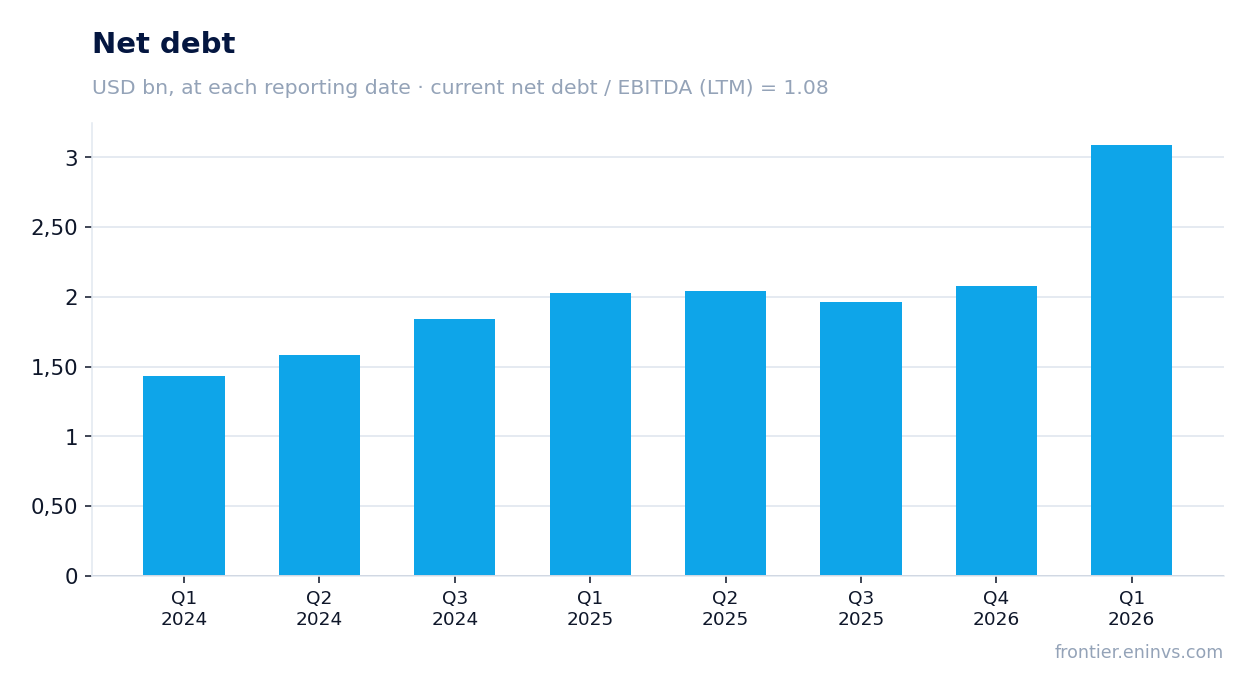
At quarter-end, net debt stood at $3,090 million, up $1,014 million from the previous reporting date ($2,076 million). The increase is linked to acquisition financing: the company spent $1,134 million on business purchases, including Electrical Power Products, Inc.
The ratio of net debt to EBITDA for the trailing twelve months is 1.08. This is a moderate level, although it excludes lease liabilities. Interest expense for the quarter rose to $60 million from $51 million, but the company still generates enough EBITDA to service debt.
The company confirmed plans to spin off its Cloud & Power Infrastructure segment, creating uncertainty
In the press release, FLEX LTD. confirmed plans to spin off its Cloud & Power Infrastructure segment into a separate public company (SpinCo). This explains part of the one-off costs: $53 million in the reported quarter were related to spin-off preparation, plus $14 million in acquisition costs.
The spin-off creates uncertainty for investors: after the transaction, shareholders will hold shares of two companies, and the valuation of each may differ significantly from the current one. Management states that both Flex and SpinCo have leadership positions and can capitalize on the opportunities ahead.
Management raised FY2027 guidance: revenue $33.7–35.2 billion, EPS $4.42–4.74
FLEX LTD. raised its full-year FY2027 guidance: revenue of $33.7–35.2 billion (23% growth at the midpoint) and adjusted EPS of $4.42–4.74 (39% growth at the midpoint). Previously, the company guided $32.3–33.8 billion and $4.21–4.51, respectively.
For Q2 FY2027, the company expects revenue of $7.95–8.25 billion (19% growth at the midpoint) and adjusted EPS of $1.00–1.07 (32% growth at the midpoint). The guidance does not reflect the impact of the Cloud & Power Infrastructure spin-off.
Shares fell 9.1% on the release day but have been nearly flat since
FLEX LTD. shares closed at $113.28 before the release. On the release day, shares fell 9.1%, reflecting investor disappointment with weak free cash flow and uncertainty around the spin-off. From the release to September 9, 2026, shares declined another 0.5%.
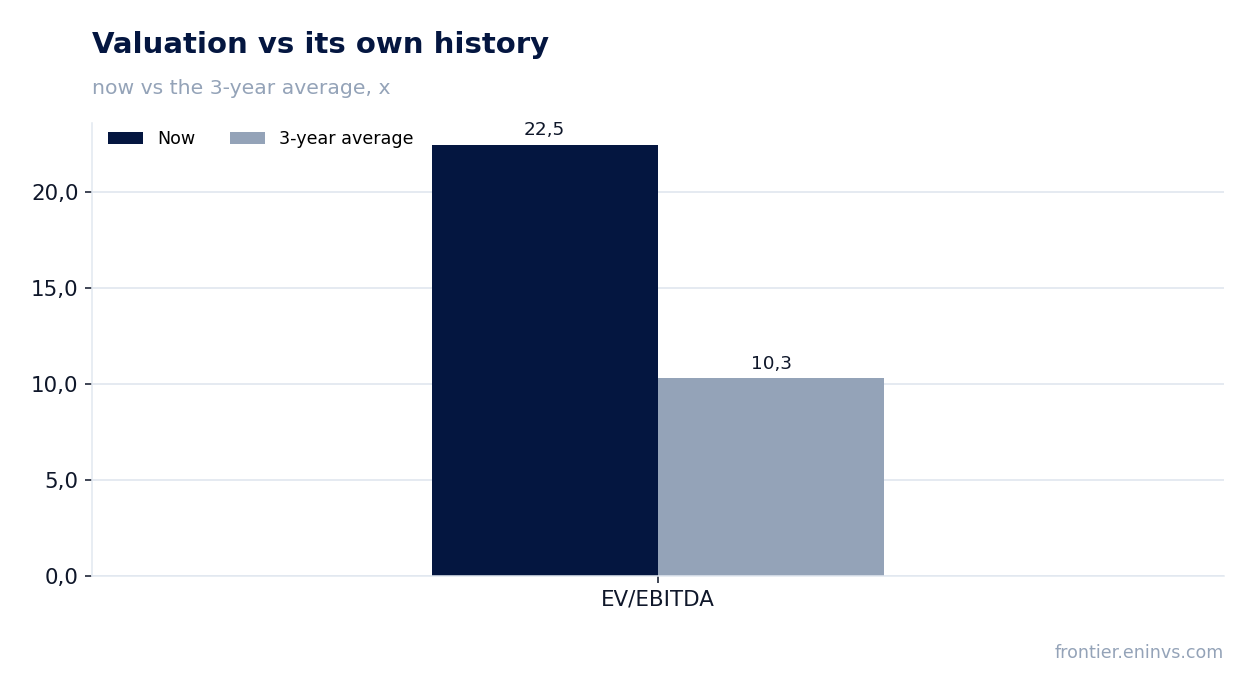
Despite the drop, valuation remains high: P/E LTM is 42.3, and EV/EBITDA LTM is 22.5, well above the three-year average of 10.3. Market capitalization is $41,206 million.
Valuation on the latest reported figures
| Metric | Value |
|---|---|
| Market cap | 41.2 bn USD |
| P/E (LTM) | 42.3 |
| EV/EBITDA (LTM) | 22.5 |
| P/B | 8.01 |
| Net debt / EBITDA (LTM) | 1.08 |
| Operating cash flow (LTM) | 1.70 bn |
| ROE | 21.4% |
| EV/EBITDA, 3-year average | 10.3 |
Bottom line
Отчёт FLEX LTD. за первый квартал 2026 финансового года показал сильный рост выручки (+20,6%) и чистой прибыли (+48,4%), что подтверждает успех стратегии в ИИ-инфраструктуре. Однако качество прибыли вызывает вопросы: операционный денежный поток упал до $276 млн, а свободный денежный поток – до $41 млн из-за роста оборотного капитала и разовых расходов на выделение бизнеса. Компания повысила прогноз на год, но инвесторы отреагировали снижением на 9,1%, что отражает опасения по поводу денежной генерации и неопределённости со SpinCo. При текущей цене акция выглядит скорее привлекательно: рост ускоряется, долговая нагрузка умеренная (1,08 EBITDA), а модель портала даёт потенциал +11%. Главный вопрос для держателя – сможет ли компания восстановить свободный денежный поток в ближайшие кварталы.
Open the company's financial profile FLEX →
See also: market overview · valuation map · stock screeners