Fabrinet: record quarter and 45% revenue growth, yet shares fell 29% after the report
17 августа Fabrinet раскрыла результаты за четвёртый квартал 2026 финансового года: выручка выросла на 44,6% год к году до 1 315,8 млн долларов, чистая прибыль – на 59,7% до 139,3 млн долларов. Компания превысила собственный прогноз по выручке и дала оптимистичный взгляд на следующий год, однако с момента публикации акции потеряли 28,6%. При текущей цене бумага выглядит скорее привлекательно: мультипликатор EV/EBITDA на 25% выше собственного трёхлетнего среднего, но модель портала оценивает потенциал роста в +23%.
Key takeaways
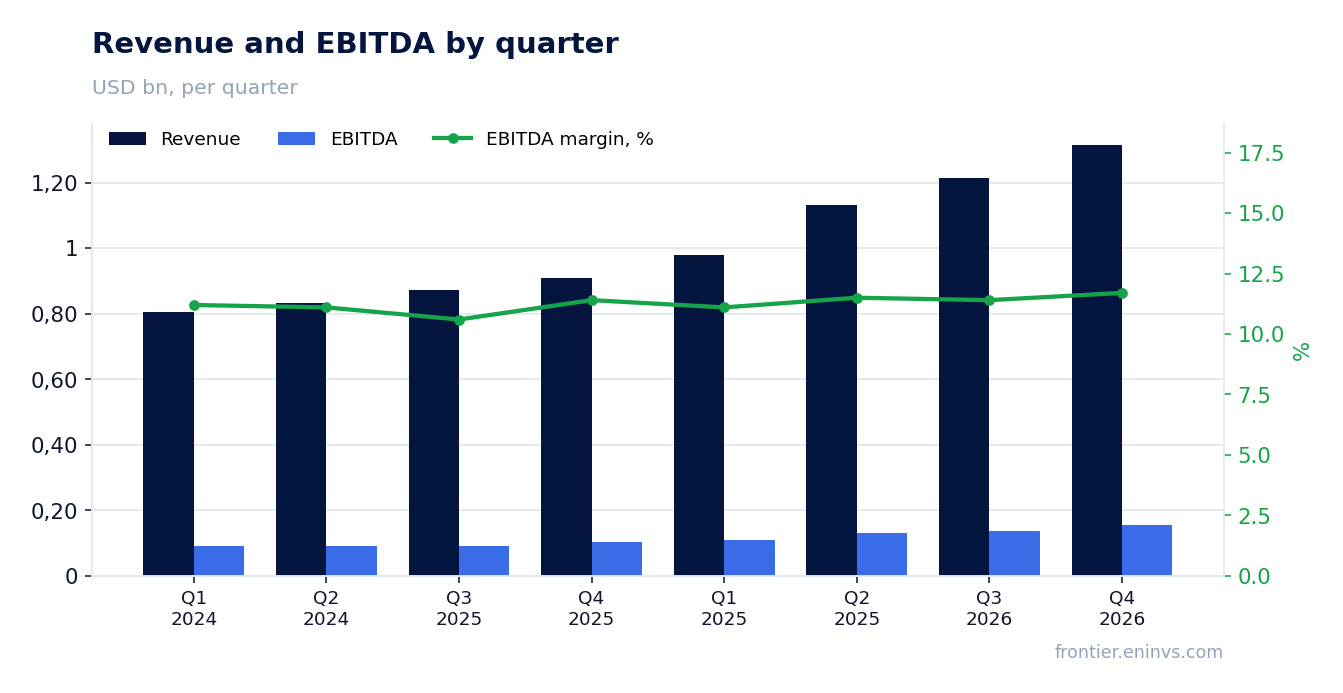
— Fourth-quarter revenue rose 44.6% to a record $1,315.8 million
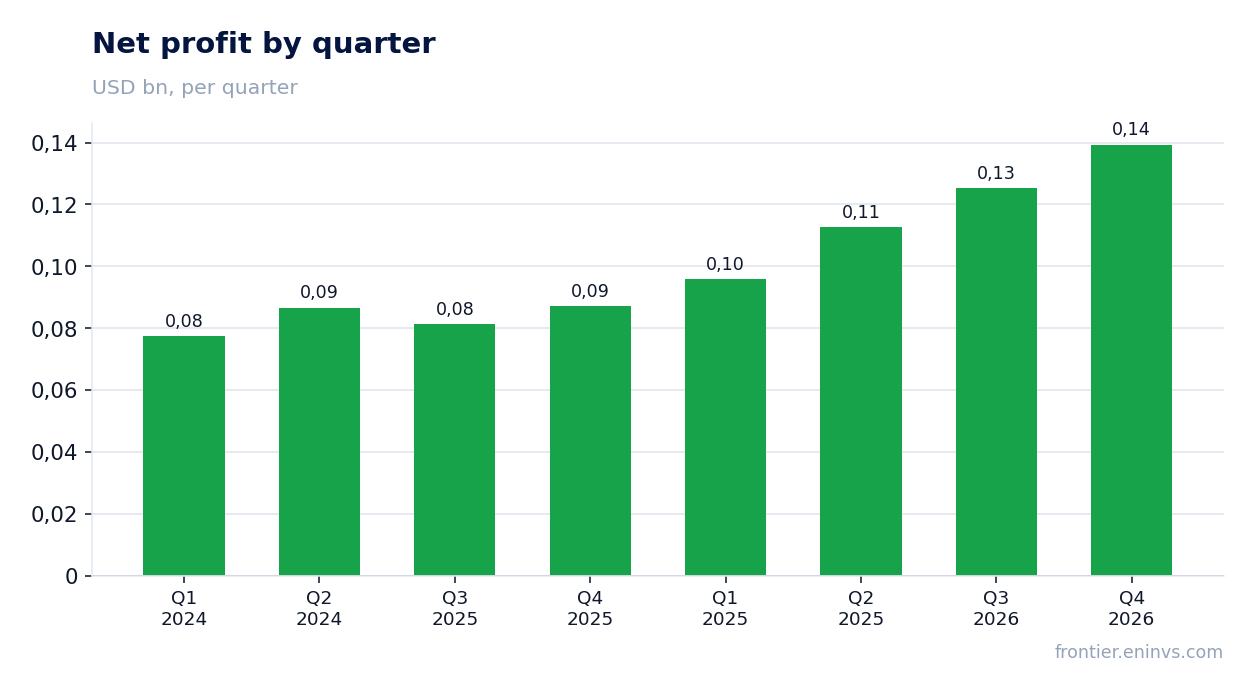
— Net profit for the quarter increased 59.7% to $139.3 million, driven by operating leverage and one-off gains
— EBITDA margin expanded 0.3 p.p. to 11.7%, and net margin – 1.0 p.p. to 10.6%
— The company guided first-quarter fiscal 2027 revenue of $1,375–1,425 million, implying about 20% year-on-year growth
— Free cash flow for the quarter was negative at minus $36.9 million due to higher capex of $91.9 million
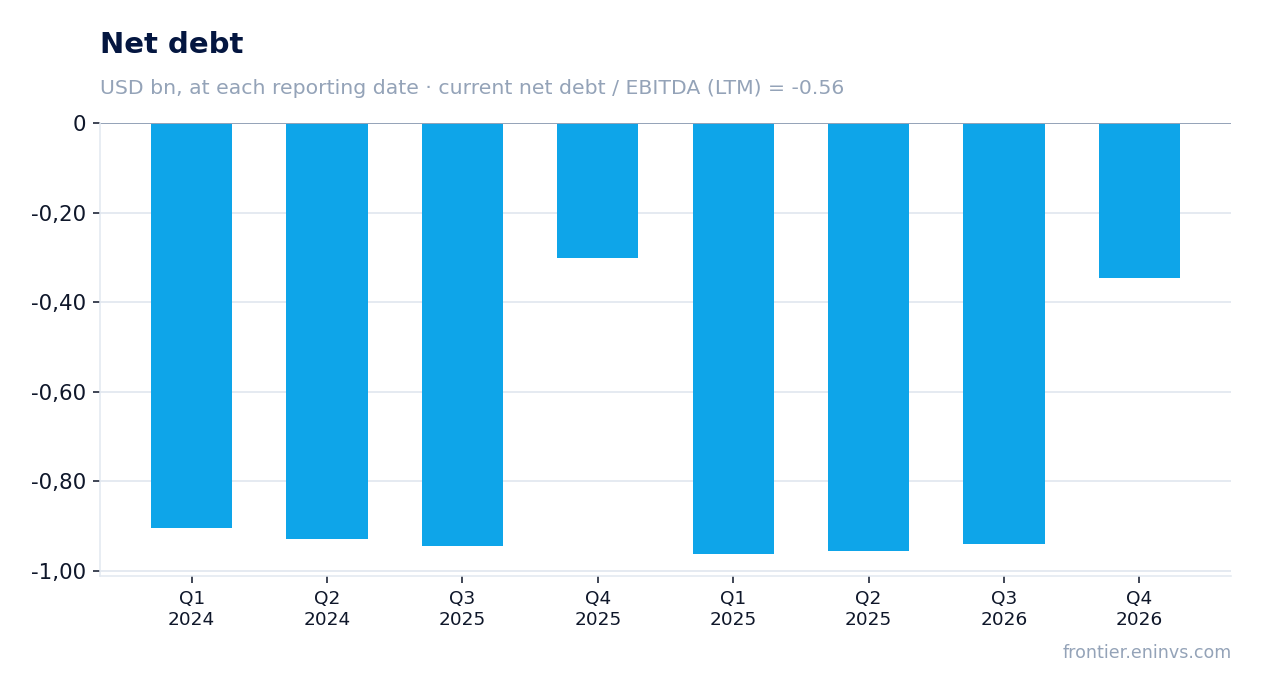
— Net debt is negative but rose by $0.6 billion over the year to minus $346.7 million
— Shares fell 28.6% after the report despite strong results, creating a discount to the portal's model
Attractiveness
Key figures, USD bn
| Metric | Q4 2025 | Q4 2026 | Change |
|---|---|---|---|
| Revenue | 0.91 | 1.32 | +44.6% |
| EBITDA | 0.10 | 0.15 | +49.0% |
| Operating profit | 0.09 | 0.13 | +50.7% |
| Net profit | 0.09 | 0.14 | +59.7% |
| Operating cash flow | 0.06 | 0.06 | -0.2% |
| Capex | 0.05 | 0.09 | +82.3% |
| EBITDA margin | 11.4% | 11.7% | +0.3 pp |
| Net margin | 9.6% | 10.6% | +1.0 pp |
Fourth-quarter revenue rose 44.6% to a record $1,315.8 million
In the fourth quarter of fiscal 2026 (ended June 26, 2026), Fabrinet reported revenue of $1,315.8 million, up 44.6% from a year earlier. This is a record quarterly figure that exceeded the company's own guidance range. Growth is accelerating: in the prior quarter revenue rose 39.3% year on year, and at the start of the year – 21.6%.
For the full fiscal 2026, revenue reached $4.64 billion, up 36% from the previous year. The company attributes the momentum to sustained demand in data-center and communications-infrastructure markets, although specific segment figures are not disclosed in the press release.
Net profit for the quarter increased 59.7% to $139.3 million, driven by operating leverage and one-off gains
Net profit in the reported quarter was $139.3 million, compared with $87.2 million a year earlier. The 59.7% increase significantly outpaced revenue growth, indicating operating leverage: operating profit rose from $89.1 million to $134.2 million.
Other income included a revaluation of non-marketable equity securities of $56.7 million – a one-off, non-cash effect. Without it, net profit would have been around $82.5 million, still above last year's $87.2 million, but growth would have been more modest. The company also incurred a one-off tax charge related to the implementation of the OECD Pillar Two global minimum tax framework of $57.4 million, partially offsetting the revaluation gain.
EBITDA margin expanded 0.3 p.p. to 11.7%, and net margin – 1.0 p.p. to 10.6%
EBITDA for the quarter grew 49.0% year on year to $153.9 million, with an EBITDA margin of 11.7% versus 11.4% a year earlier. Net margin rose to 10.6% from 9.6%, helped by both the one-off revaluation gain and operating leverage.
Profitability remains modest for a manufacturer of complex optics – gross margin for the quarter was 12.0% on a GAAP basis. The company operates in contract manufacturing, where competition is intense and value added is limited. Still, margin expansion amid accelerating revenue growth suggests that scale is starting to pay off.
The company guided first-quarter fiscal 2027 revenue of $1,375–1,425 million, implying about 20% year-on-year growth
Fabrinet expects first-quarter fiscal 2027 revenue (ending September 25, 2026) of $1,375–1,425 million. This implies growth of roughly 20% from the comparable quarter last year ($1,132.9 million). GAAP EPS guidance is $3.39–3.54, and non-GAAP EPS is $4.10–4.25.
The deceleration from the fourth quarter's +44.6% may reflect seasonality or management caution. Still, the absolute level of guidance remains high, and the company expresses confidence in the durability of growth trends into fiscal 2027.
Free cash flow for the quarter was negative at minus $36.9 million due to higher capex of $91.9 million
Operating cash flow in the fourth quarter was only $55.0 million, while capital expenditures rose to $91.9 million – nearly double the prior year. As a result, free cash flow turned negative: minus $36.9 million versus plus $4.7 million a year earlier.
For the full year, capex reached $252.5 million (2.1 times the prior year), reflecting capacity expansion. Operating cash flow for the year fell to $256.7 million from $328.4 million, mainly due to higher inventories and receivables. This is typical for a phase of rapid production scaling, but investors should watch when capex starts to pay off.
Net debt is negative but rose by $0.6 billion over the year to minus $346.7 million
At the end of the quarter, the net cash position was $346.7 million (negative net debt). Over the year, the metric changed by +$0.6 billion – the company deployed part of its accumulated liquidity into investments and share repurchases. The ratio of net debt to EBITDA for the trailing twelve months is minus 0.56, indicating a conservative balance sheet.
Higher capex and increased working capital are being funded from internal resources, without taking on significant debt. Interest expense for the quarter was only $0.1 million, confirming minimal leverage.
Shares fell 28.6% after the report despite strong results, creating a discount to the portal's model
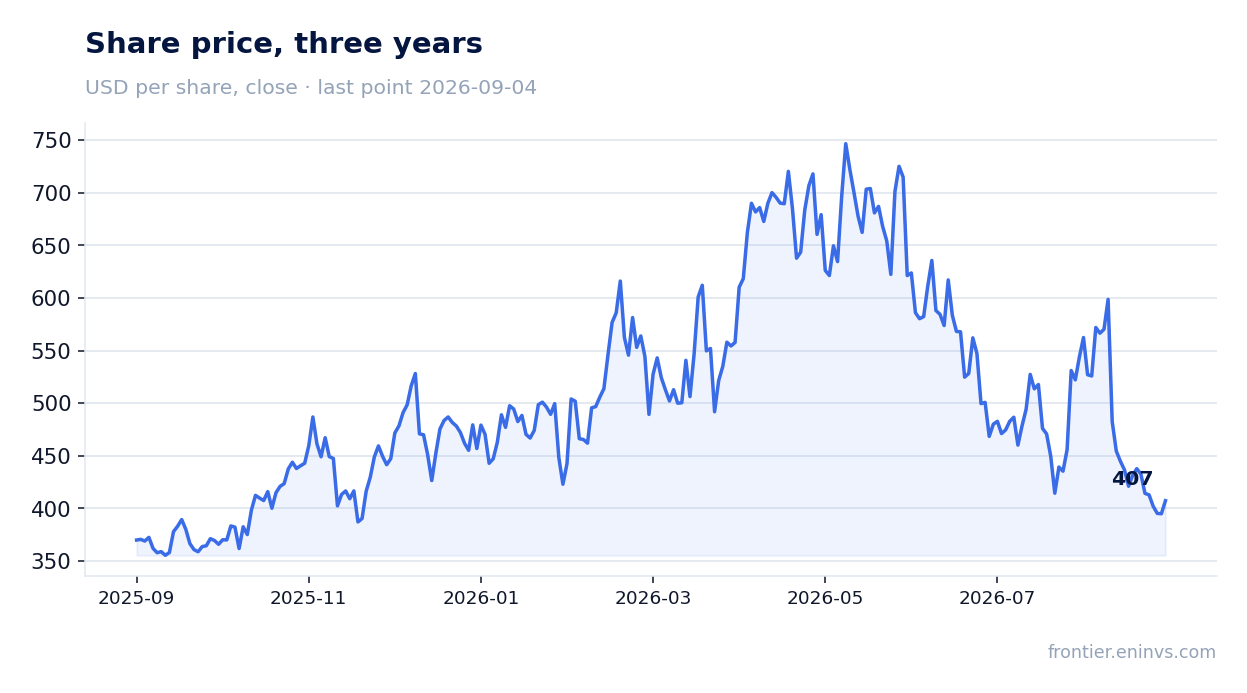
On the day of the report, shares rose 5.0%, but by September 4, 2026, they had lost 28.6% from the pre-report close. This suggests the market may have expected even stronger results or is concerned about decelerating growth in the coming quarter.
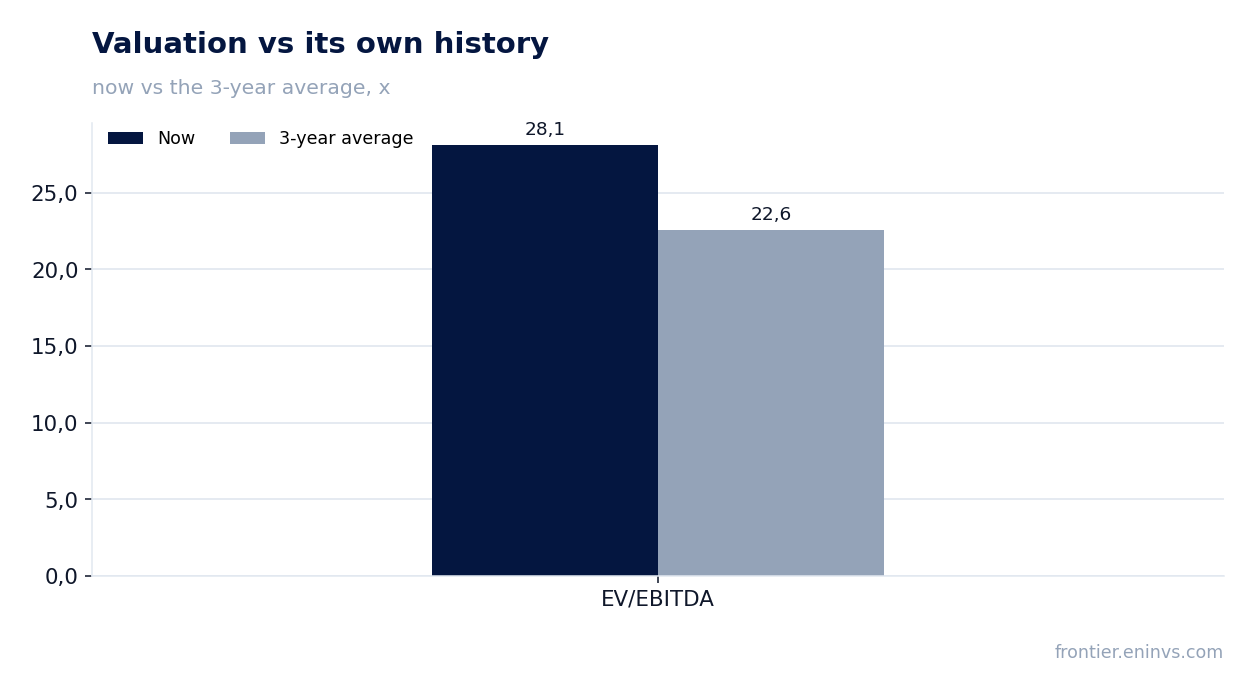
At the current price, shares trade at an EV/EBITDA multiple of 28.1 for the trailing twelve months, 25% above the company's own three-year average of 22.6. P/E LTM is 32.3. According to the portal's model, which assesses EBITDA growth and a target multiple, the upside to fair value is +23%. The stock is held in the 'US AI Infrastructure' strategy on the portal, reflecting its role in the AI supply chain.
Valuation on the latest reported figures
| Metric | Value |
|---|---|
| Market cap | 15.3 bn USD |
| P/E (LTM) | 32.3 |
| EV/EBITDA (LTM) | 28.1 |
| P/B | 7.71 |
| Net debt / EBITDA (LTM) | -0.56 |
| Operating cash flow (LTM) | 0.26 bn |
| ROE | 23.4% |
| EV/EBITDA, 3-year average | 22.6 |
Bottom line
Fabrinet delivered a strong quarter: record revenue, accelerating growth, margin expansion, and an optimistic outlook. However, part of the profit came from one-off items, and free cash flow was negative due to heavy investment. Shares fell 29% after the report, and the valuation is now closer to fair: EV/EBITDA of 28.1 versus a three-year average of 22.6, but the portal's model implies +23% upside. The question for holders is whether the company can sustain double-digit growth and convert capex into cash flow; if so, the current price could prove attractive.
Open the company's financial profile FN →
See also: market overview · valuation map · stock screeners