FORMFACTOR INC: profit up sixfold, but almost all of the margin gain came from a one-off reserve reversal
On 29 July FORMFACTOR INC reported results for the second quarter of 2026. Revenue rose 31.9% year on year to $258.2 million, EBITDA by 215.2% to $66.8 million, and net income by 518.6% to $56.2 million. The EBITDA margin climbed to 25.9% from 10.8% a year earlier, but most of that jump came from a one-off reduction in inventory reserves and restructuring, not from a durable improvement in operations. With an EV/EBITDA of 53.6 against its own three-year average of 33.9, the stock looks expensive, so the assessment is neutral.
Key takeaways
— Revenue rose 31.9% year on year, and growth accelerated for two consecutive quarters after the 2025 slump
— The EBITDA margin climbed to 25.9%, but almost all of the gain came from a one-off reversal of inventory reserves
— Net income rose sixfold, with one-off items accounting for about half of the quarterly result
— Free cash flow was $52.6 million, but the year-on-year improvement came mainly from a collapse in capital expenditure
— Net debt is negative, and the cash cushion grew to $345.6 million
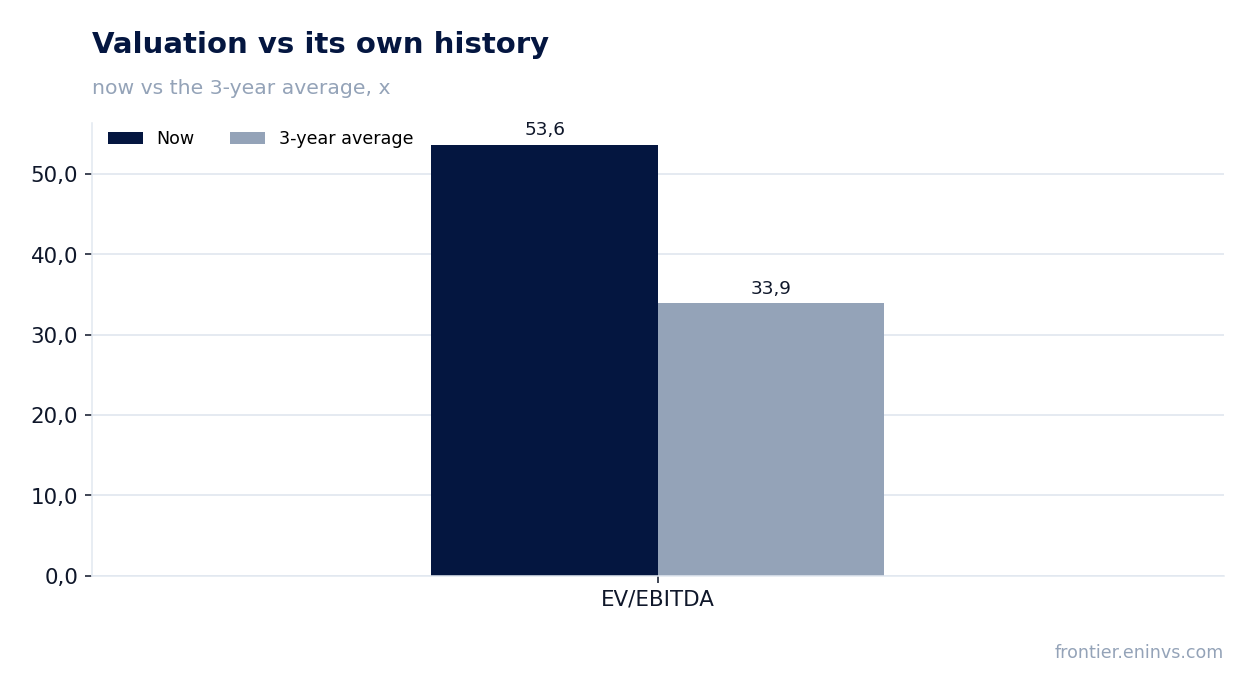
— EV/EBITDA of 53.6 against its own three-year average of 33.9 – the stock trades well above its history
— The third-quarter guidance implies another revenue record but does not promise a repeat of the one-off effects
Attractiveness
Key figures, USD bn
| Metric | Q2 2025 | Q2 2026 | Change |
|---|---|---|---|
| Revenue | 0.20 | 0.26 | +31.9% |
| EBITDA | 0.02 | 0.07 | +215.2% |
| Operating profit | 0.01 | 0.06 | +369.7% |
| Net profit | 0.01 | 0.06 | +518.6% |
| Operating cash flow | 0.02 | 0.06 | +227.1% |
| Capex | 0.07 | 0.01 | -85.5% |
| EBITDA margin | 10.8% | 25.9% | +15.1 pp |
| Net margin | 4.6% | 21.8% | +17.2 pp |
Revenue rose 31.9% year on year, and growth accelerated for two consecutive quarters after the 2025 slump
In the second quarter of 2026, revenue reached $258.2 million, up 31.9% from a year earlier. This is the second consecutive quarter with growth of around 32%: in the first quarter of 2026, revenue rose 32.0%. For comparison, 2025 was weak: growth was 1.6% in Q1, a decline of 0.8% in Q2, a decline of 2.5% in Q3, and only in Q4 did growth appear at 13.6%.
The acceleration began in the fourth quarter of 2025 and continued into 2026. The company attributes this to broad-based demand in key growth initiatives – High Bandwidth Memory (HBM) and Co-Packaged Optics (CPO), which drove sequential revenue increases in the Probe Cards and Systems segments, respectively.
Sequential growth is also present: second-quarter 2026 revenue is 14.2% higher than in the first quarter of 2026 ($226.1 million). This indicates that demand was not a one-off spike but is sustained.
The company expects third-quarter 2026 revenue of $270 million plus or minus $10 million, implying further growth. The guidance assumes continued strong demand in Foundry & Logic and Systems.
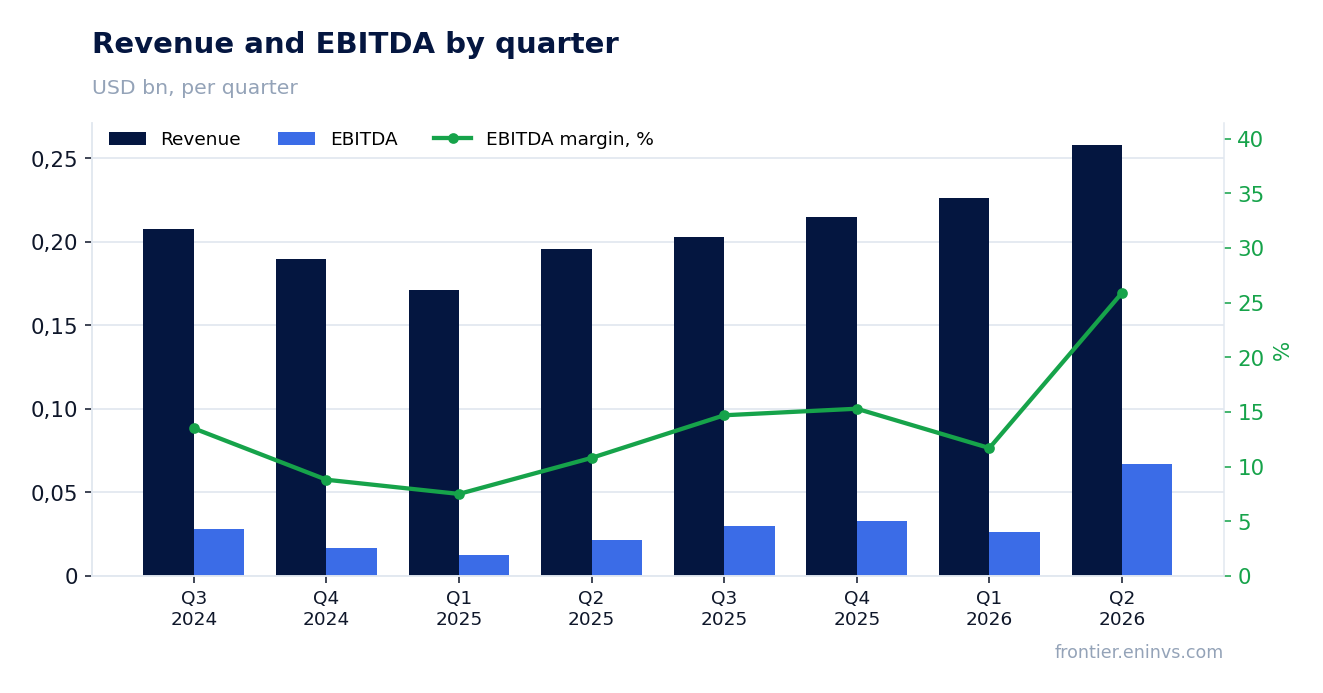
The EBITDA margin climbed to 25.9%, but almost all of the gain came from a one-off reversal of inventory reserves
The EBITDA margin in the second quarter of 2026 was 25.9% versus 10.8% a year earlier. Such growth looks impressive, but it is largely explained by one-off factors. The report states that in the first quarter of 2026 the company recorded significant inventory reserves, and in the second quarter part of these reserves was reversed, boosting gross profit.
GAAP gross margin rose to 50.7% from 38.4% in the first quarter of 2026 and 37.3% in the second quarter of 2025. However, the non-GAAP gross margin was 53.3% versus 49.0% in Q1 2026 and 38.5% a year earlier. The difference between GAAP and non-GAAP is mainly due to restructuring and stock-based compensation.
The cash flow statement for the first half of 2026 shows a provision for excess and obsolete inventories of $7.9 million, down from $6.7 million in the first half of 2025. This confirms that a reduction in reserves occurred in the second quarter, increasing profit.
Without this one-off effect, the EBITDA margin would have been lower. Operating expenses also rose: R&D expenses increased to $31.1 million from $28.8 million a year earlier, and SG&A to $37.2 million from $31.5 million. This limits the sustainability of the margin.
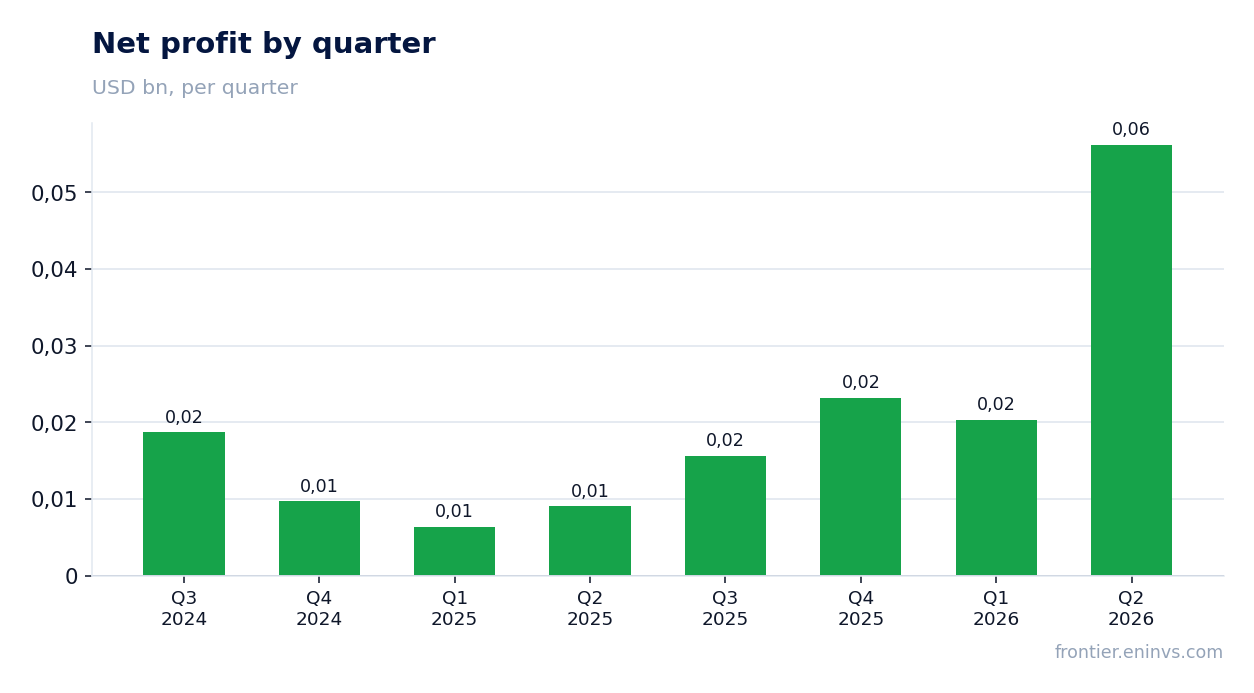
Net income rose sixfold, with one-off items accounting for about half of the quarterly result
Net income in the second quarter of 2026 was $56.2 million, up 518.6% from a year earlier. However, a significant portion of this growth is due to one-off items. The report states that in the first quarter of 2026 there were significant restructuring charges ($23.3 million), which decreased to $4.5 million in the second quarter. In addition, the company recorded income from equity investment of $2.2 million versus a loss of $3.5 million a year earlier.
Non-GAAP net income was $65.0 million, or $0.82 per diluted share, versus $21.2 million ($0.27) a year earlier. The difference between GAAP and non-GAAP includes restructuring, stock-based compensation, and amortization. Thus, even excluding one-off items, profit more than tripled.
Nevertheless, one-off items made a substantial contribution. Excluding the impact of the reserve reversal and lower restructuring charges, profit growth would have been less impressive. This is important to consider when assessing the sustainability of the result.
The company expects third-quarter 2026 GAAP diluted EPS of $0.75 plus or minus $0.09, and non-GAAP of $0.86. This implies some decline from the $0.71 GAAP in the second quarter, but reflects seasonality and the absence of one-off effects.
Free cash flow was $52.6 million, but the year-on-year improvement came mainly from a collapse in capital expenditure
Free cash flow in the second quarter of 2026 was $52.6 million versus negative $47.1 million a year earlier. The improvement looks sharp, but it is largely explained by lower capital expenditure: in Q2 2026 it was $9.6 million versus $66.3 million in Q2 2025. A year earlier, the company invested in capacity expansion, which weighed on free cash flow.
Operating cash flow rose to $61.8 million from $18.9 million a year earlier. This reflects higher profit and improved working capital management. However, note that in the first half of 2026 operating cash flow was $106.8 million and capital expenditure was $24.8 million, giving free cash flow of $83.3 million.
The company does not disclose specific capital expenditure plans for the second half of 2026, but revenue guidance implies further growth, which may require investment. If capital expenditure returns to 2025 levels, free cash flow could shrink.
Nevertheless, the current level of free cash flow allows the company to fund operations and return capital to shareholders. In the first half of 2026, the company did not repurchase shares, but did it pay dividends? The cash flow statement shows no share purchases and no dividend payments. It is possible the company does not pay dividends.
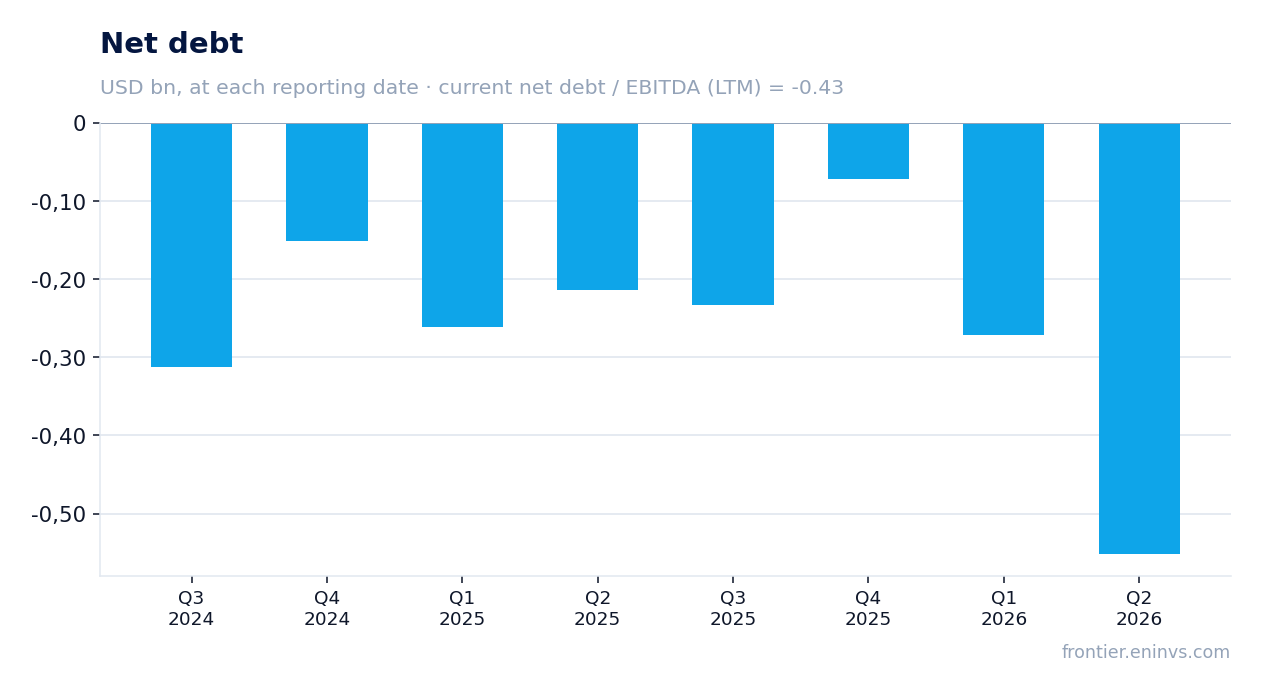
Net debt is negative, and the cash cushion grew to $345.6 million
Net debt at the end of the second quarter of 2026 was negative $552.2 million, meaning the company has a substantial cash cushion. This is an improvement from negative $271.4 million at the end of the first quarter of 2026. Growth in cash and equivalents to $109.8 million and marketable securities to $235.9 million increased liquidity.
The net debt to EBITDA ratio for the trailing twelve months is negative 0.43, reflecting a net cash position. This is a level, not a direction of change, as the previous value is not disclosed. The company has no significant debt: long-term lease liabilities and a small loan do not exert significant pressure.
Interest income exceeds interest expense: in the second quarter of 2026, net interest income was $2.7 million. This adds to profit and supports financial stability.
The cash cushion allows the company to fund investments and potential acquisitions without raising debt. However, a high share of marketable securities may yield low returns, limiting return on capital.
EV/EBITDA of 53.6 against its own three-year average of 33.9 – the stock trades well above its history
The EV/EBITDA multiple for the trailing twelve months is 53.6, well above its own three-year average of 33.9. This indicates that the market values the company significantly higher than its average over the past three years. Such a gap may be justified by expectations of sustained growth, but it creates a risk of correction if growth slows.
The P/E for the trailing twelve months is 77.4, also high. For comparison, net income for the trailing twelve months was $115.5 million, and market capitalisation was $8.94 billion. The high multiple reflects expectations of further profit growth.
Our fundamental value-creation model estimates the upside to fair value at +26%. This is our own estimate, not a market consensus. It assumes that the current price does not fully reflect future EBITDA growth.
However, it is worth noting that current profit growth is largely due to one-off factors. Excluding them, the multiples would be even higher, making the stock vulnerable to negative news.
The third-quarter guidance implies another revenue record but does not promise a repeat of the one-off effects
The company guides third-quarter 2026 revenue to $270 million plus or minus $10 million, which is 4.6% above actual second-quarter revenue. This implies a new record. The guidance is based on expected strong demand in Foundry & Logic and Systems.
Gross margin guidance for the third quarter is 52.0% plus or minus 1.5% on a GAAP basis and 54.0% plus or minus 1.5% on a non-GAAP basis. This is below the actual second-quarter gross margin (50.7% GAAP and 53.3% non-GAAP), which may indicate no repeat of the one-off reserve reversal.
EPS guidance: $0.75 plus or minus $0.09 GAAP and $0.86 plus or minus $0.09 non-GAAP. This implies some decline from the $0.71 GAAP in the second quarter, but reflects seasonality and the absence of one-off effects.
Thus, the guidance confirms sustained demand but does not promise a repeat of the record margin. Investors should watch actual gross margin and operating expenses in the next report.
Valuation on the latest reported figures
| Metric | Value |
|---|---|
| Market cap | 8.94 bn USD |
| P/E (LTM) | 77.4 |
| EV/EBITDA (LTM) | 53.6 |
| P/B | 8.64 |
| Net debt / EBITDA (LTM) | -0.43 |
| Operating cash flow (LTM) | 0.12 bn |
| ROE | 20.7% |
| EV/EBITDA, 3-year average | 33.9 |
Bottom line
In the second quarter of 2026, FORMFACTOR INC reported record revenue of $258.2 million (+31.9% year on year) and a sixfold increase in net income to $56.2 million. However, almost the entire jump in the EBITDA margin to 25.9% is explained by a one-off reversal of inventory reserves and lower restructuring charges. Free cash flow of $52.6 million also improved mainly due to a collapse in capital expenditure to $9.6 million from $66.3 million a year earlier. With EV/EBITDA at 53.6 against its own three-year average of 33.9, the stock trades well above its history, leaving no room for error. The verdict is neutral: strong demand and a cash cushion are balanced by the one-off nature of profit and the high valuation.
Open the company's financial profile FORM →
See also: market overview · valuation map · stock screeners