GE Vernova Inc.: revenue accelerated to +21.9%, but shares fell 8.7% on disappointing EBITDA guidance
22 июля GE Vernova Inc. раскрыла результаты за второй квартал 2026 года: выручка выросла на 21,9% до 11 104 млн долл., скорректированная EBITDA – на 83,9% до 1 250 млн долл., свободный денежный поток составил 5 107 млн долл. Несмотря на сильные цифры, акции упали на 8,7% в день публикации, поскольку компания сохранила прогноз по марже EBITDA на уровне 12–14%, что разочаровало рынок. По нашей оценке, бумага выглядит скорее привлекательной: рост ускоряется, маржа расширяется, а модель портала даёт потенциал +12% к справедливой стоимости.
Key takeaways
— Revenue in Q2 rose 21.9% to $11,104 million, driven by Power and Electrification segments
— Adjusted EBITDA jumped 83.9% to $1,250 million, with organic margin expansion of 340 bps
— Free cash flow of $5,107 million in the quarter exceeded the full-year 2025 figure
— Backlog grew to $176 billion, gas turbine contracts to 116 GW
— Net profit includes one-off items: sale of China XD Electric stake and Prolec GE remeasurement
— Company raised revenue and free cash flow guidance but kept EBITDA margin guidance unchanged
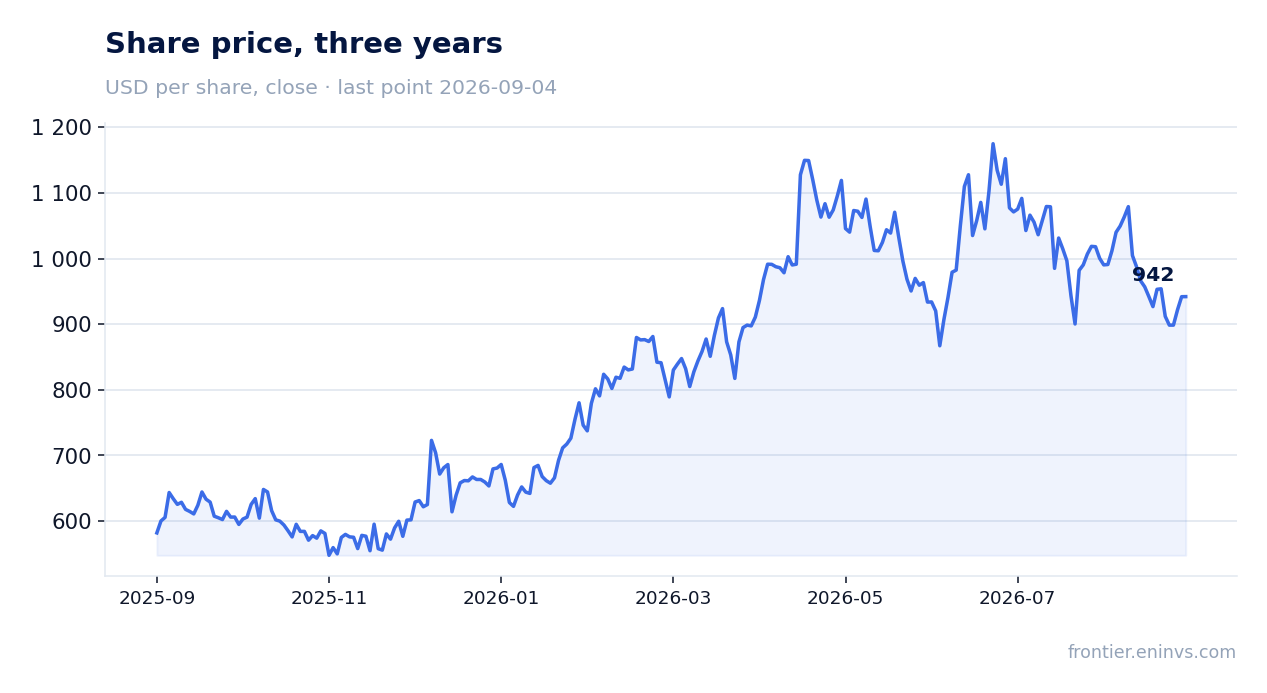
— Shares fell 8.7% on the release day and 12.7% from release to September 4
Attractiveness
Key figures, USD bn
| Metric | Q2 2025 | Q2 2026 | Change |
|---|---|---|---|
| Revenue | 9.11 | 11.1 | +21.9% |
| EBITDA | 0.58 | 1.07 | +83.9% |
| Operating profit | 0.38 | 0.65 | +72.8% |
| Net profit | 0.51 | 0.67 | +30.0% |
| Operating cash flow | 0.37 | 5.49 | +1396.5% |
| Capex | 0.17 | 0.39 | +123.1% |
| EBITDA margin | 6.4% | 9.7% | +3.3 pp |
| Net margin | 5.6% | 6.0% | +0.4 pp |
Revenue in Q2 rose 21.9% to $11,104 million, driven by Power and Electrification segments
In Q2 2026, GE Vernova Inc. revenue reached $11,104 million, up 21.9% year-over-year. Organic growth was 12%, meaning part of the increase came from acquisitions, primarily the consolidation of Prolec GE in the Electrification segment.
The main driver was the Power segment: revenue rose 14% to $5,477 million on strong demand for gas turbines. Electrification grew 68% (organically +29%) to $3,637 million, driven by transformers and grid solutions. Wind declined 10% to $2,026 million due to weak orders in H1 2025.
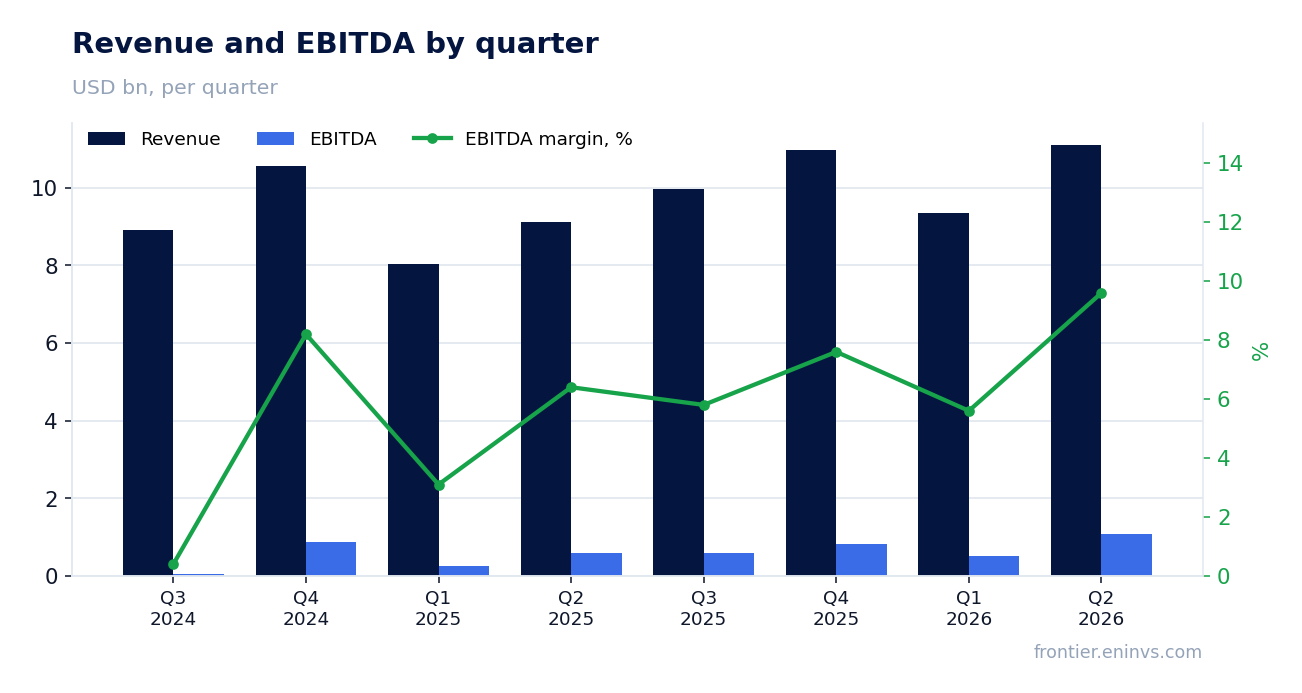
Adjusted EBITDA jumped 83.9% to $1,250 million, with organic margin expansion of 340 bps
Adjusted EBITDA in Q2 reached $1,250 million versus $770 million a year earlier, up 83.9%. EBITDA margin expanded from 6.4% to 9.7% on a GAAP basis, while adjusted organic margin rose 340 bps to 11.2%.
Power and Electrification were the main contributors: Power margin expanded 320 bps organically to 19.1%, Electrification by 700 bps to 19.1%. Wind's EBITDA loss widened to $275 million due to lower equipment deliveries and higher offshore project costs.
Free cash flow of $5,107 million in the quarter exceeded the full-year 2025 figure
Operating cash flow in Q2 reached $5,492 million, nearly 15 times higher than a year earlier ($367 million). Capital expenditures were $386 million, resulting in free cash flow of $5,107 million, exceeding the full-year 2025 figure.
The company attributes the surge to positive working capital effects and higher EBITDA. Cash balance at quarter-end was $13.1 billion, up $4.3 billion from the start of the year, despite share repurchases and dividends.
Backlog grew to $176 billion, gas turbine contracts to 116 GW
Orders in Q2 were $24.2 billion, up 88% organically. Backlog (RPO) grew $13.0 billion sequentially to $176 billion.
Power signed contracts for 20 GW of gas equipment, including 18 GW of slot reservation agreements. Combined contracted and reserved capacity rose from 100 to 116 GW, with the company expecting at least 125 GW by year-end 2026. Electrification data center orders exceeded $5 billion year-to-date, more than double the 2025 total.
Net profit includes one-off items: sale of China XD Electric stake and Prolec GE remeasurement
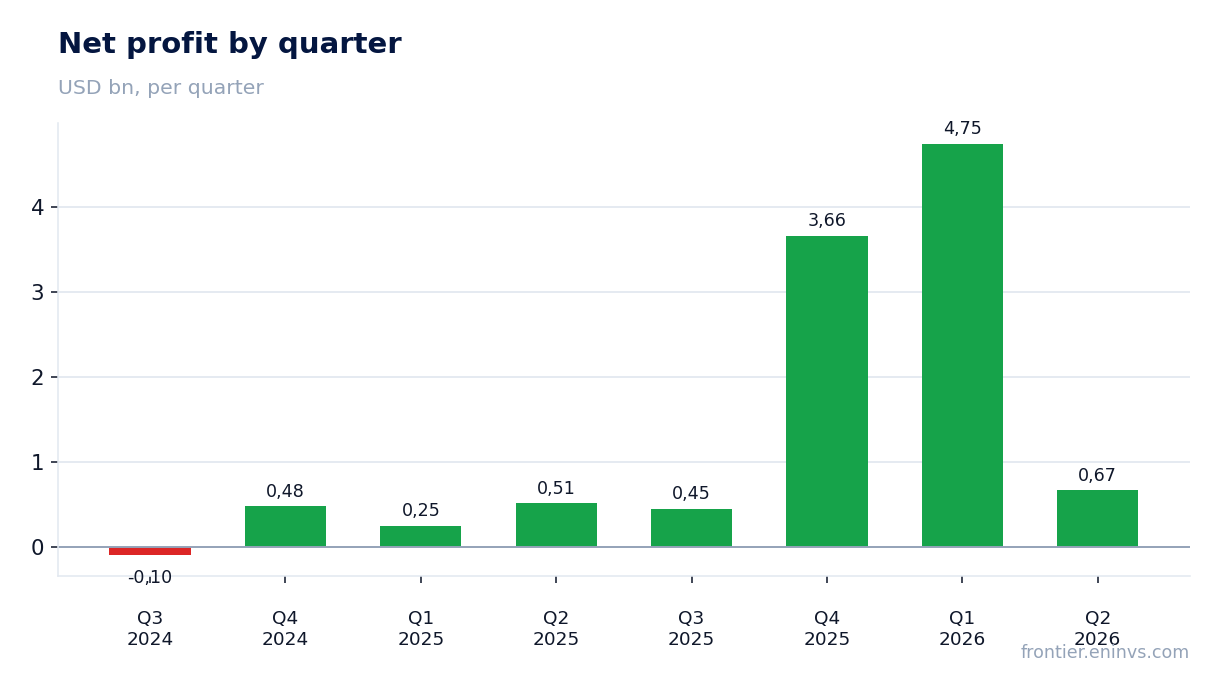
Net profit for the quarter was $668 million, up 30% year-over-year. However, H1 net profit reached $5,398 million thanks to one-off gains: remeasurement of the previously held stake in Prolec GE upon acquiring the remaining 50% contributed $3,992 million pre-tax, and the sale of Proficy business added $330 million.
In Q2, the company also monetized its remaining stake in China XD Electric, receiving approximately $0.6 billion pre-tax. These items do not reflect operational dynamics, so EBITDA and cash flow are better indicators of profitability.
Company raised revenue and free cash flow guidance but kept EBITDA margin guidance unchanged
GE Vernova Inc. raised its 2026 revenue guidance to $45.5–46.5 billion (from $44.5–45.5 billion) and free cash flow to $11.5–12.5 billion (from $6.5–7.5 billion). Adjusted EBITDA margin guidance remained at 12–14%.
Maintaining the margin guidance despite a strong quarter likely disappointed investors who expected an increase. The company also reaffirmed plans to ramp gas turbine production to 20 GW annually by Q3 2026 and 30 GW by 2030.
Shares fell 8.7% on the release day and 12.7% from release to September 4
The closing price before the release was $1,078.81, shares fell 8.7% on the release day and 12.7% by September 4. Despite strong operational results, the market reacted negatively to the unchanged margin guidance.
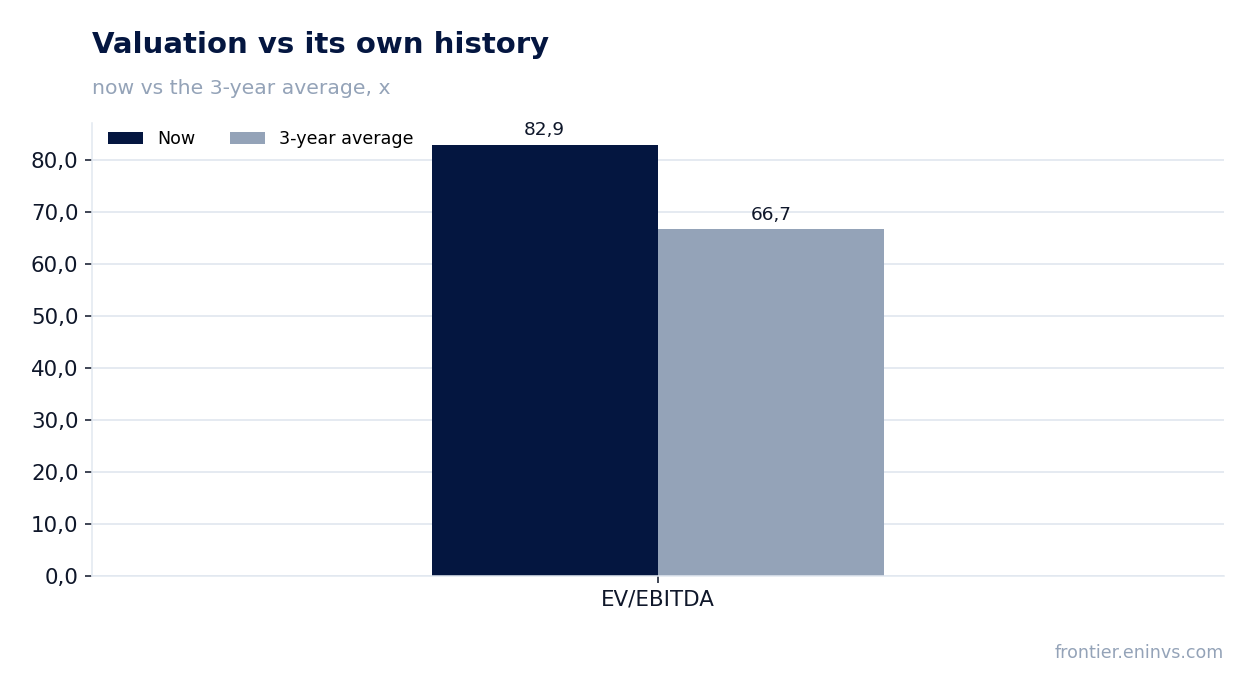
Valuation multiples remain elevated: P/E LTM 26.9, EV/EBITDA LTM 82.9 versus the three-year average of 66.7. Market capitalization is $256,210 million. The portal's model implies +12% upside to fair value.
Valuation on the latest reported figures
| Metric | Value |
|---|---|
| Market cap | 256 bn USD |
| P/E (LTM) | 26.9 |
| EV/EBITDA (LTM) | 82.9 |
| P/B | 22.92 |
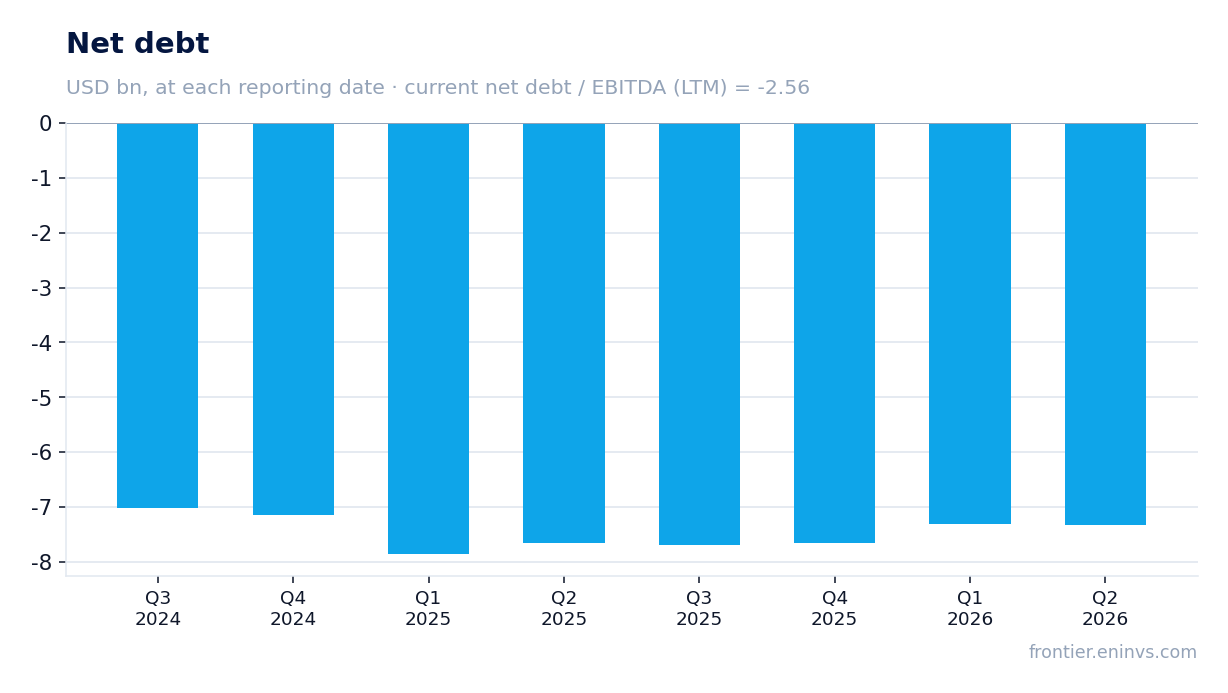
| Net debt / EBITDA (LTM) | -2.56 |
| Operating cash flow (LTM) | 5.00 bn |
| ROE | 20.6% |
| Dividend yield (12m) | 0.2% |
| EV/EBITDA, 3-year average | 66.7 |
Bottom line
Q2 2026 results showed strong operational momentum: revenue accelerated to +21.9%, adjusted EBITDA rose 83.9%, and quarterly free cash flow exceeded the full-year 2025 figure. Backlog and demand for gas turbines and grid equipment remain robust, supporting the raised revenue and FCF guidance. However, unchanged EBITDA margin guidance and high valuation (EV/EBITDA 82.9 vs. 66.7 average) led to a 12.7% share decline after the release. The portal's model implies +12% upside, making the stock rather attractive, but the key factor will be the company's ability to expand margins in line with expectations.
Open the company's financial profile GEV →
See also: market overview · valuation map · stock screeners