Home Depot: strong quarter, but revenue growth is slowing

On August 18, 2026, Home Depot reported results for the second quarter of fiscal 2026. Revenue grew 5.7% to $47.9 billion, net profit rose 4.7% to $4.8 billion. The stock fell 5% after the release, and at current valuation we find it rather attractive.
Key takeaways
— Revenue in the second quarter grew 5.7% to $47.9 billion, but comparable sales rose only 1.7%
— EBITDA margin declined from 16.4% to 16.2% due to higher operating expenses
— Net profit rose 4.7% to $4.8 billion, with no one-off items mentioned
— Debt leverage stands at 2.27 EBITDA, above the three-year average
— Dividend yield of 2.9% looks modest relative to historical valuation
— According to the portal's model, upside potential is 9%
Attractiveness
Key figures, USD bn
| Metric | Q2 2025 | Q2 2026 | Change |
|---|---|---|---|
| Revenue | 45.3 | 47.9 | +5.7% |
| EBITDA | 7.42 | 7.77 | +4.7% |
| Operating profit | 6.55 | 6.84 | +4.3% |
| Net profit | 4.55 | 4.77 | +4.7% |
| Operating cash flow | 4.64 | 5.39 | +16.1% |
| Capex | 0.92 | 0.88 | -4.0% |
| EBITDA margin | 16.4% | 16.2% | -0.2 pp |
| Net margin | 10.1% | 10.0% | -0.1 pp |
Revenue in the second quarter grew 5.7% to $47.9 billion, but comparable sales rose only 1.7%
In the second quarter of fiscal 2026, Home Depot reported revenue of $47.9 billion, up 5.7% from the same period last year. New stores and acquisitions contributed most, while comparable sales rose only 1.7%, and 1.3% in the US.
Average ticket rose 2.8% to $92.50, but transactions fell 0.8%. This suggests customers are spending more per project but visiting less often – a trend the company attributes to a focus on smaller projects.
In the first half, revenue reached $89.6 billion (+5.3% YoY), consistent with the annual guidance of 2.5–4.5% growth. The company reaffirmed its full-year outlook.
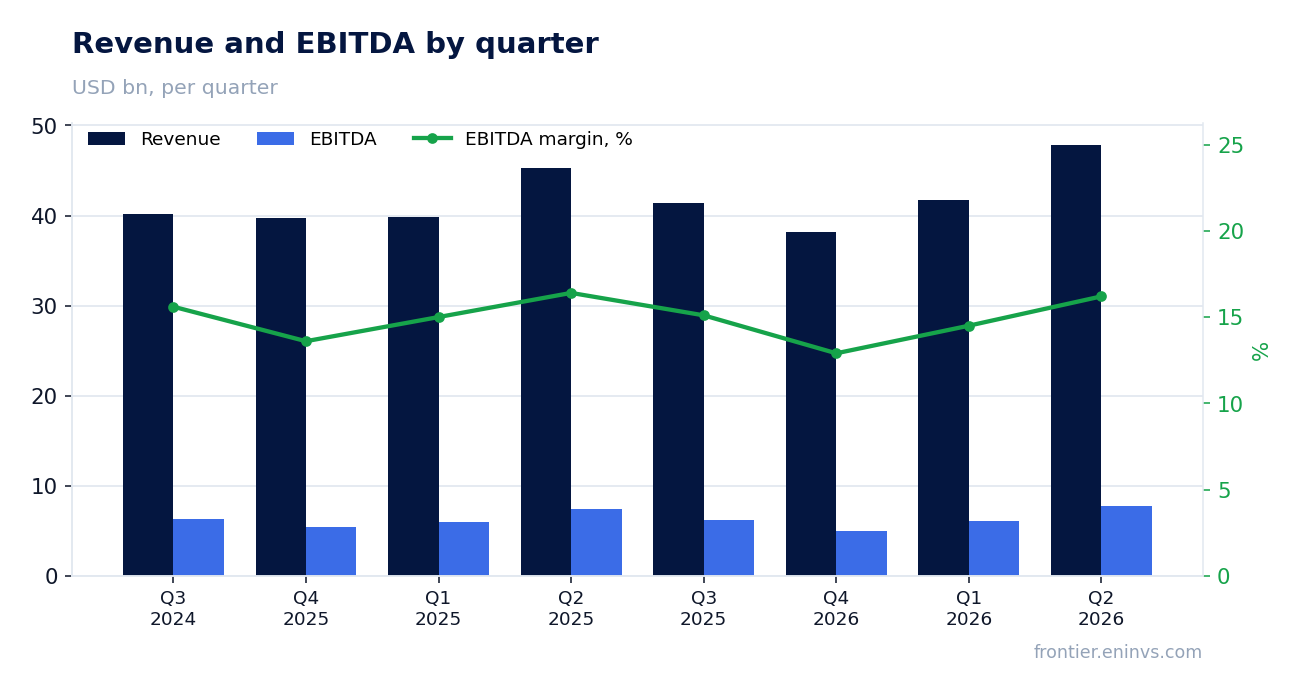
EBITDA margin declined from 16.4% to 16.2% due to higher operating expenses
EBITDA in the second quarter rose 4.7% to $7.8 billion, but the EBITDA margin fell from 16.4% to 16.2%. Operating expenses grew faster than revenue: SG&A increased 8.5%.
Gross margin, by contrast, improved: gross profit rose 6.5% on revenue growth of 5.7%. The pressure on EBITDA came from operating expenses, including amortization of acquired intangibles.
Adjusted operating margin (excluding acquired intangibles amortization) was 14.7% versus 14.8% a year earlier. The company expects full-year adjusted operating margin of 12.8–13.0%.
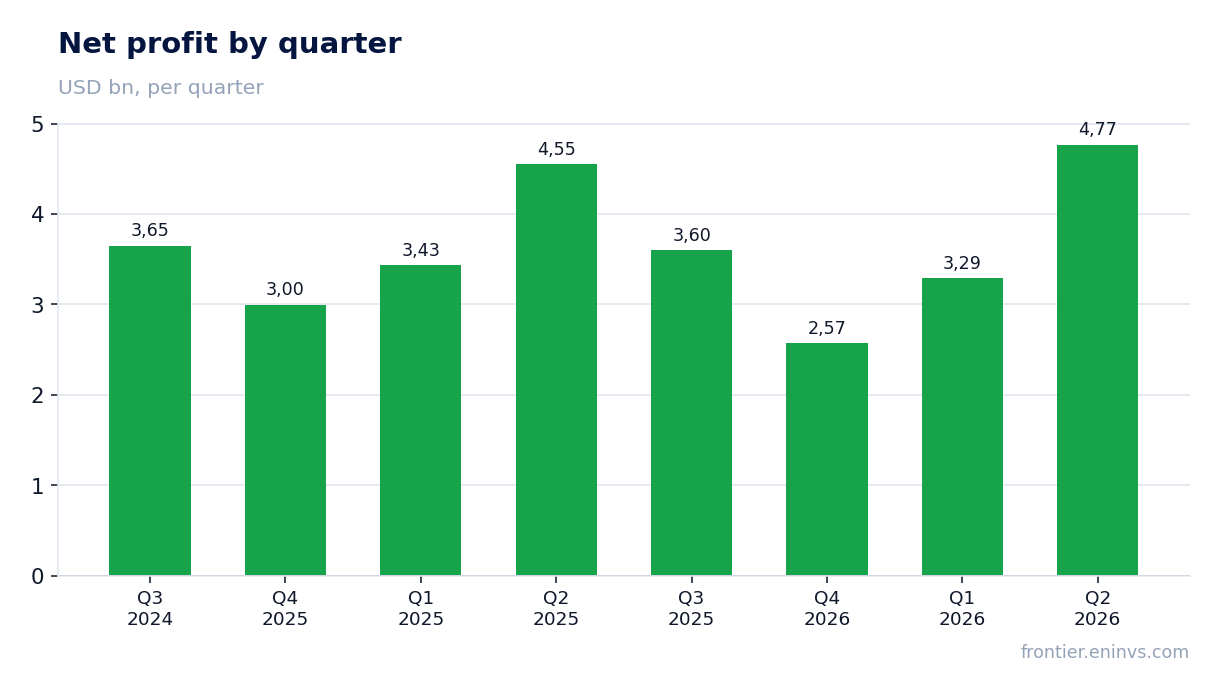
Net profit rose 4.7% to $4.8 billion, with no one-off items mentioned
Net profit in the second quarter was $4.8 billion, up 4.7% from a year earlier. Diluted EPS rose from $4.58 to $4.79, and adjusted to $4.92.
Profit growth was driven by operations, with no apparent one-off items. Interest expense remained almost flat at $583 million versus $575 million a year earlier.
Over the trailing twelve months, net profit reached $14.2 billion, implying a P/E of about 22.4 – above the three-year average.
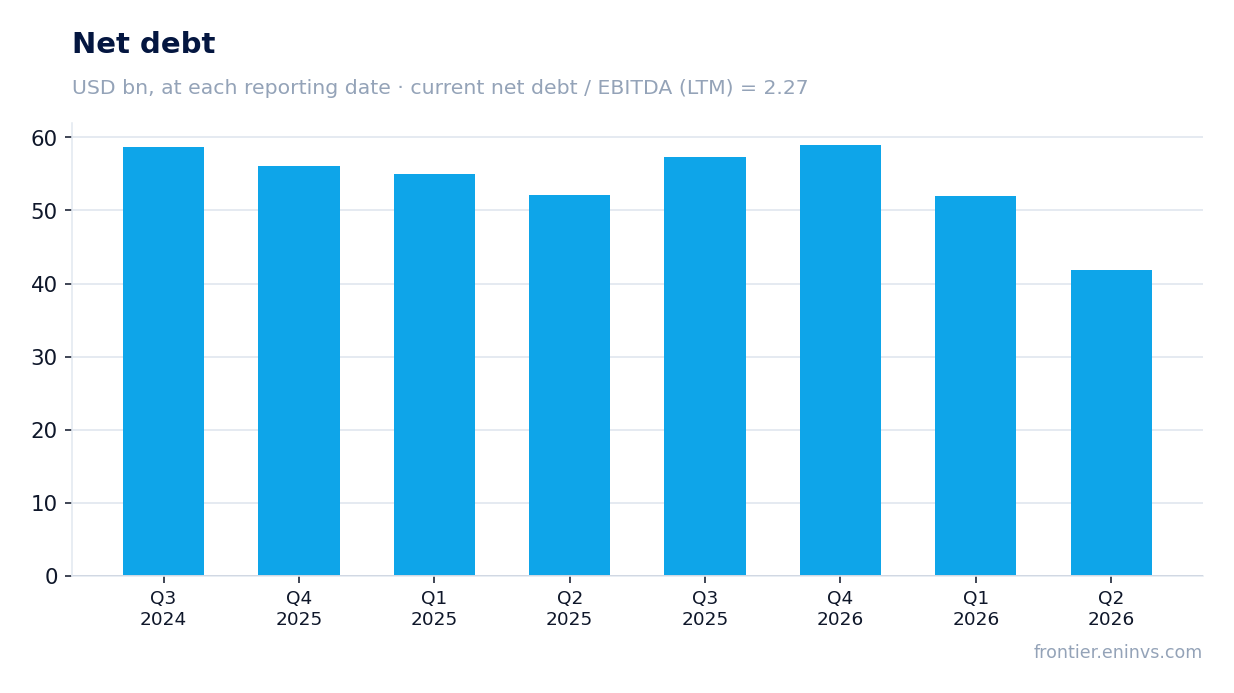
Debt leverage stands at 2.27 EBITDA, above the three-year average
At the end of the second quarter, Home Depot's net debt stood at $58.994 billion, and the net debt to EBITDA ratio over the trailing twelve months was 2.27. This is noticeably above the three-year average, although the company reduced debt by $7.1 billion from the previous quarter.
The reduction was driven by strong operating cash flow: over the trailing twelve months it reached $16.3 billion. Capital expenditures for the half-year were $1.7 billion, in line with the annual guidance of about 2.5% of sales.
The elevated debt level reflects recent acquisitions, including SRS Distribution. The company continues to generate sufficient cash to service debt and pay dividends.
Dividend yield of 2.9% looks modest relative to historical valuation
Home Depot's current dividend yield is 2.9% over the trailing twelve months. This is below the average for companies with stable cash flow, but consistent with the company's policy of returning a significant portion of free cash flow via dividends and buybacks.
In the first half, the company paid $4.6 billion in dividends, comparable to operating cash flow of $11.4 billion over the same period. Capital expenditures do not threaten payments.
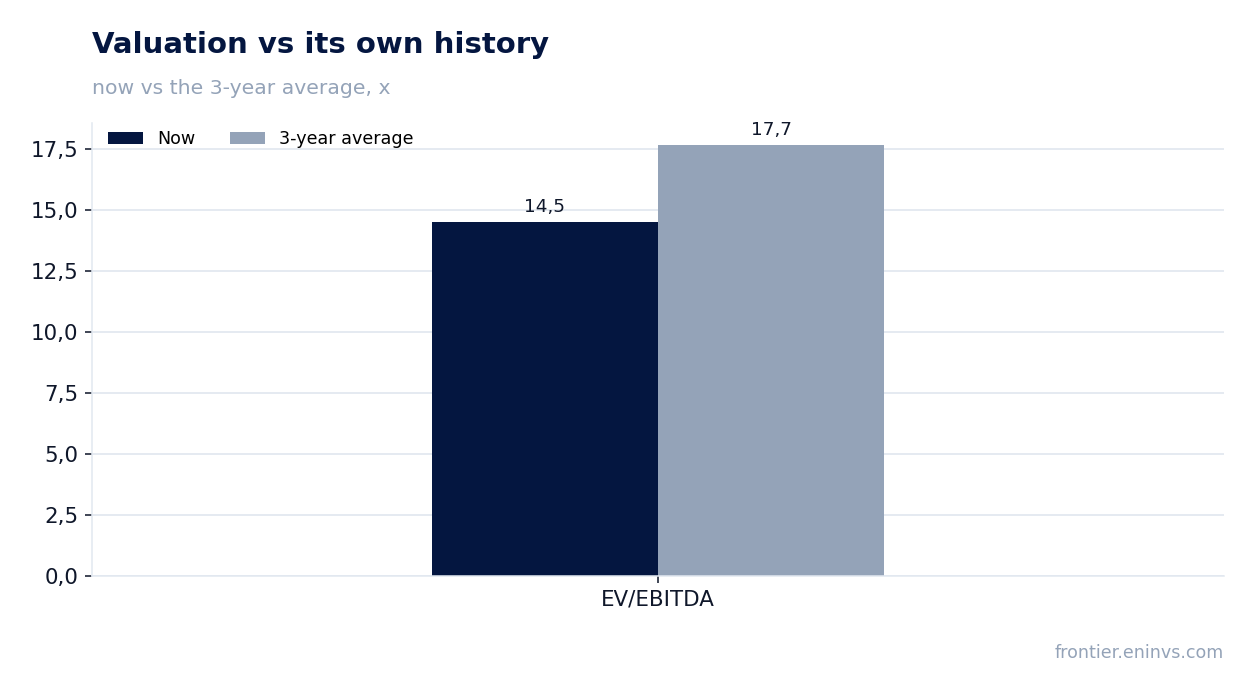
However, with a P/E of 22.4 and EV/EBITDA of 14.5 versus the three-year average of 17.7, the stock looks more expensive than its history, making the dividend yield less attractive for new investors.
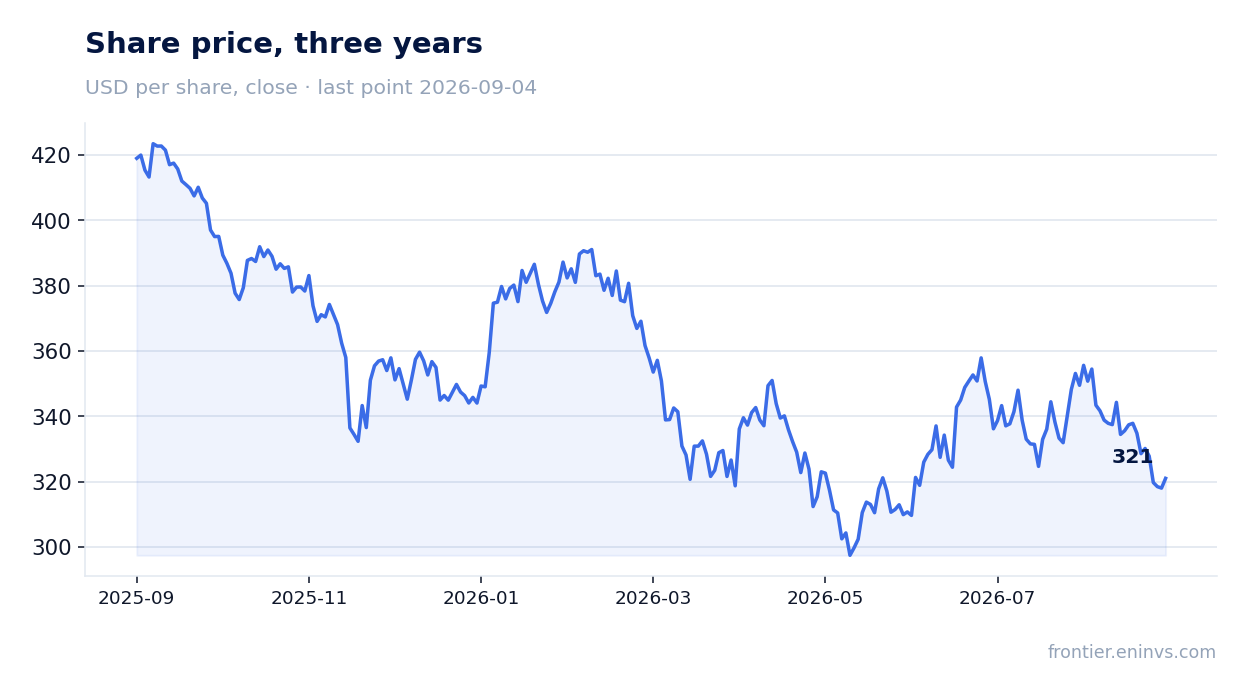
According to the portal's model, upside potential is 9%
Our fundamental value-creation model, based on EBITDA growth and target multiple, estimates upside potential of +9% for Home Depot's shares from the current price. This is moderately positive, especially since the stock fell 5% after the release.
The EV/EBITDA multiple is 14.5, below the three-year average of 17.7. This suggests the market has already priced in slowing growth and margin pressure.
If the company confirms its annual guidance and maintains revenue growth, the stock has room to recover. The key risk remains a further decline in consumer activity in the home improvement segment.
Valuation on the latest reported figures
| Metric | Value |
|---|---|
| Market cap | 319 bn USD |
| P/E (LTM) | 22.4 |
| EV/EBITDA (LTM) | 14.5 |
| P/B | 24.88 |
| Net debt / EBITDA (LTM) | 2.27 |
| Operating cash flow (LTM) | 16.3 bn |
| ROE | 125.0% |
| Dividend yield (12m) | 2.9% |
| EV/EBITDA, 3-year average | 17.7 |
Bottom line
Home Depot's second-quarter report beat expectations: revenue and profit grew, and the company reaffirmed its annual guidance. However, behind these figures lies a slowdown in comparable sales and margin compression, explaining the 5% drop in the stock after the release. At the same time, the EV/EBITDA multiple (14.5) is below the three-year average, and the portal's model implies +9% upside. We view the shares as rather attractive: the current price already reflects the negatives, but signs of accelerating sales and margin stabilization are needed for sustained growth.
Open the company's financial profile HD →
See also: market overview · valuation map · stock screeners