Hewlett Packard Enterprise Co: record revenue and profit, but growth came from AI servers, not the whole company

2 сентября 2026 года Hewlett Packard Enterprise Co раскрыла результаты за третий квартал 2026 финансового года. Выручка выросла на 33,7% год к году до 12,2 млрд долл., EBITDA – на 141,6% до 2,3 млрд долл., чистая прибыль – на 404,9% до 1,5 млрд долл.. Акции выглядят привлекательно: мультипликатор EV/EBITDA в 2,3 раза выше собственного трёхлетнего среднего, но модель портала даёт потенциал роста на 70%.
Key takeaways
— Revenue grew a third thanks to AI servers, but without them growth would have been more modest
— EBITDA margin doubled to 18.5% on operating leverage and revenue mix shift
— Net profit grew fivefold, but $444 million of it was a one-off stake sale
— Leverage is 2.85x EBITDA, and net debt fell by $5.1 billion over the year
— Dividend increased, but yield of 0.95% is below the market average
— Valuation: EV/EBITDA 14.9 vs 6.4 three-year average, but portal model gives +70%
Attractiveness
Key figures, USD bn
| Metric | Q3 2025 | Q3 2026 | Change |
|---|---|---|---|
| Revenue | 9.14 | 12.2 | +33.7% |
| EBITDA | 0.93 | 2.26 | +141.6% |
| Operating profit | 0.25 | 1.39 | +464.0% |
| Net profit | 0.30 | 1.54 | +404.9% |
| Operating cash flow | 1.30 | 1.64 | +25.7% |
| Capex | 0.58 | 0.74 | +29.3% |
| EBITDA margin | 10.2% | 18.5% | +8.3 pp |
| Net margin | 3.3% | 12.6% | +9.3 pp |
Revenue grew a third thanks to AI servers, but without them growth would have been more modest
In the third quarter of fiscal 2026, Hewlett Packard Enterprise Co revenue reached $12.2 billion, up 33.7% year-over-year. The main contribution came from the Cloud & AI segment, whose revenue grew 25.4% to $9.0 billion, and within it servers – up 35.3% to $6.8 billion. Demand for AI infrastructure continues to fuel growth, and the company raised its full-year fiscal 2026 revenue growth outlook to 34–37%.
Excluding servers, the dynamics would have been noticeably weaker: storage grew only 10.2%, financial services were virtually flat (–0.3%), and Corporate Investments and Other added just 3%. Thus, growth remains concentrated in AI servers, creating dependence on the cyclicality of capital spending by large cloud providers.
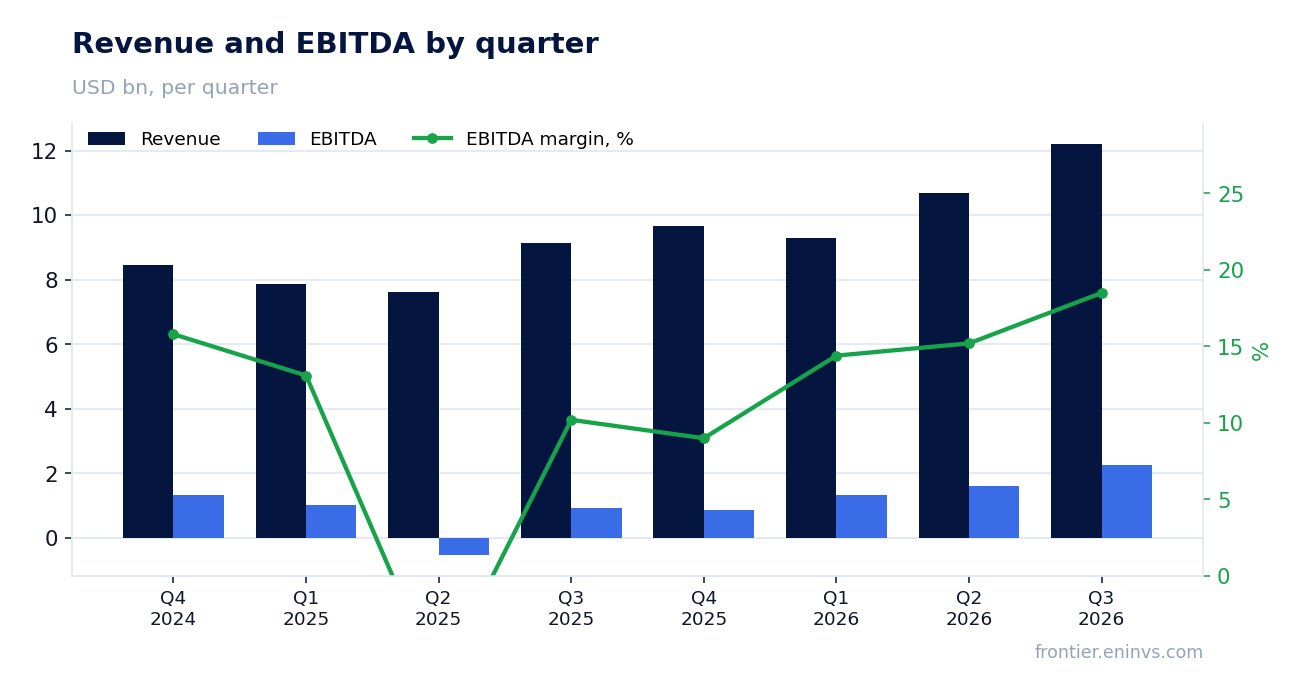
EBITDA margin doubled to 18.5% on operating leverage and revenue mix shift
EBITDA for the reported quarter grew 141.6% year-over-year to $2.3 billion, and EBITDA margin expanded from 10.2% to 18.5%. GAAP operating profit jumped 464% to $1.4 billion, reflecting operating leverage: revenue grows faster than fixed costs.
In the Cloud & AI segment, operating margin rose from 7.0% to 17.0%, while in Networking it remained virtually unchanged – 22.0% versus 22.1% a year earlier. The margin expansion in Cloud & AI is likely due to scaling of the AI business and improved sales mix, although the company does not disclose details.
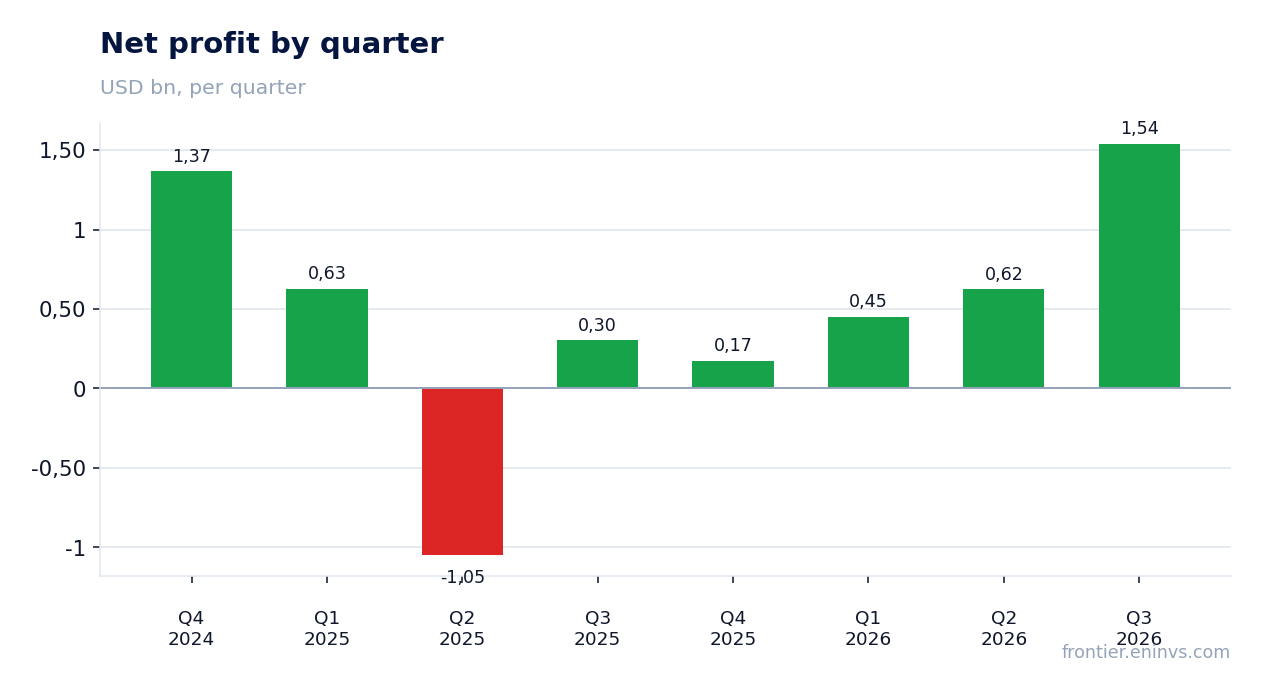
Net profit grew fivefold, but $444 million of it was a one-off stake sale
Net profit for the third quarter of fiscal 2026 was $1.5 billion versus $305 million a year earlier – growth of 404.9%. However, the profit includes a one-off gain of $444 million from the sale of an equity interest. Without it, net profit would have been about $1.1 billion, still significantly above last year's level.
The company also reported a gain from the sale of a business in the prior year, but no such transactions occurred in the current quarter. Operating profit rose 464% to $1.4 billion, indicating the sustainability of core operations, not just one-off factors.
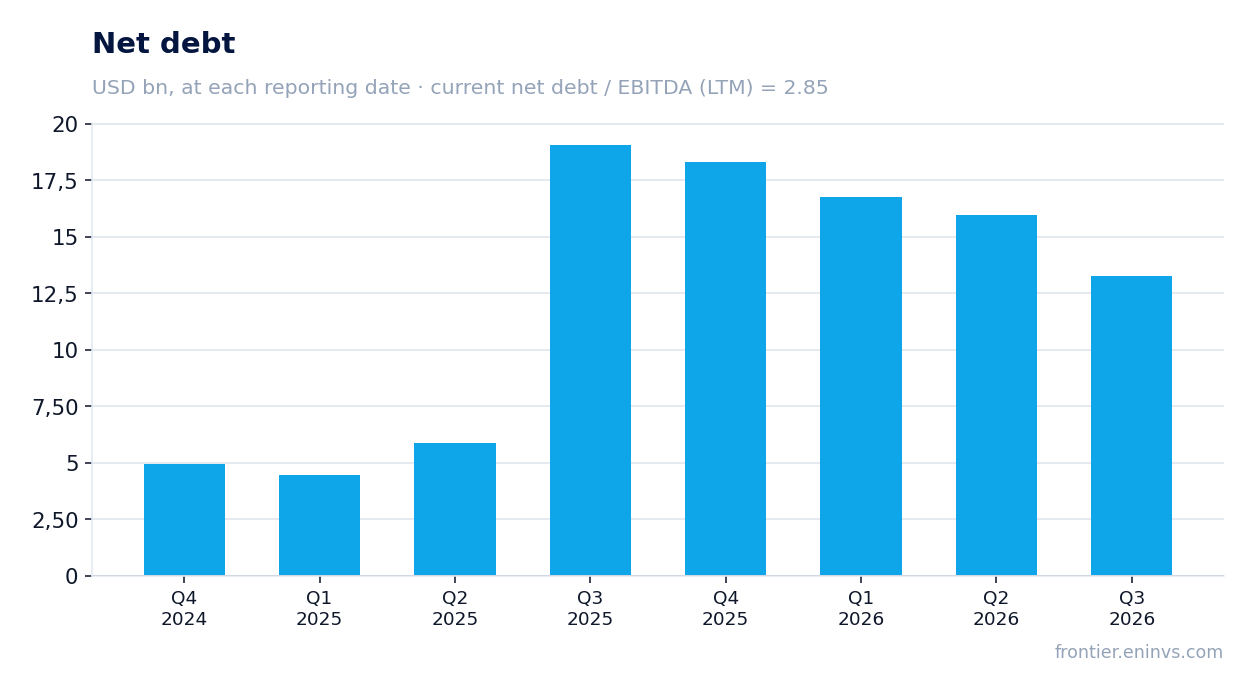
Leverage is 2.85x EBITDA, and net debt fell by $5.1 billion over the year
At the end of the third quarter of fiscal 2026, net debt stood at $18.3 billion, and the ratio of net debt to EBITDA over the trailing twelve months was 2.85. Over the past twelve months, net debt decreased by $5.1 billion, reflecting strong cash flow and the stake sale.
Operating cash flow for the quarter was $1.6 billion, up $0.3 billion from a year earlier. Capital expenditures rose to $745 million, but free cash flow still increased to $1.0 billion. The company raised its fiscal 2026 free cash flow outlook to at least $3.75 billion.
Dividend increased, but yield of 0.95% is below the market average
The Board of Directors declared a quarterly dividend of $0.1425 per share, up 9.6% from a year earlier ($0.13). Over the trailing twelve months, the company paid dividends totaling about $0.57 per share, giving a yield of 0.95% at the current price.
The company plans to return at least 75% of free cash flow to shareholders in the fourth quarter. At current free cash flow, this implies significant buybacks, which would support the share price. However, the dividend yield remains low, making the stock more of a growth story than an income source.
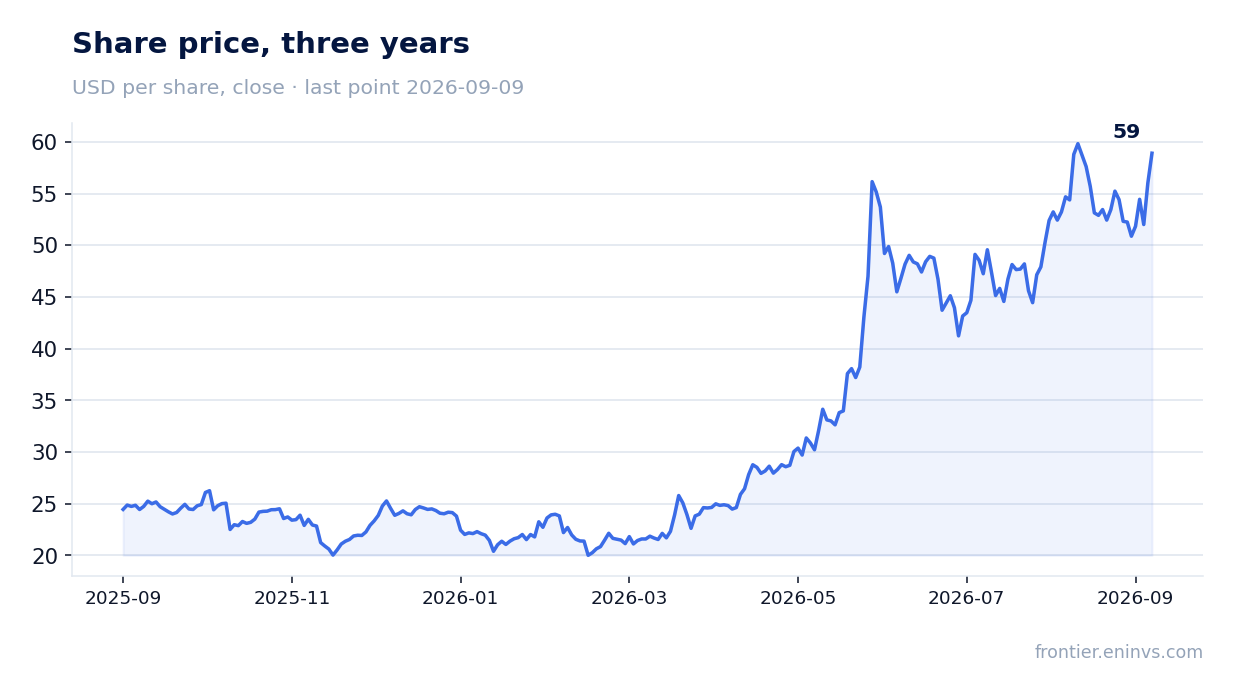
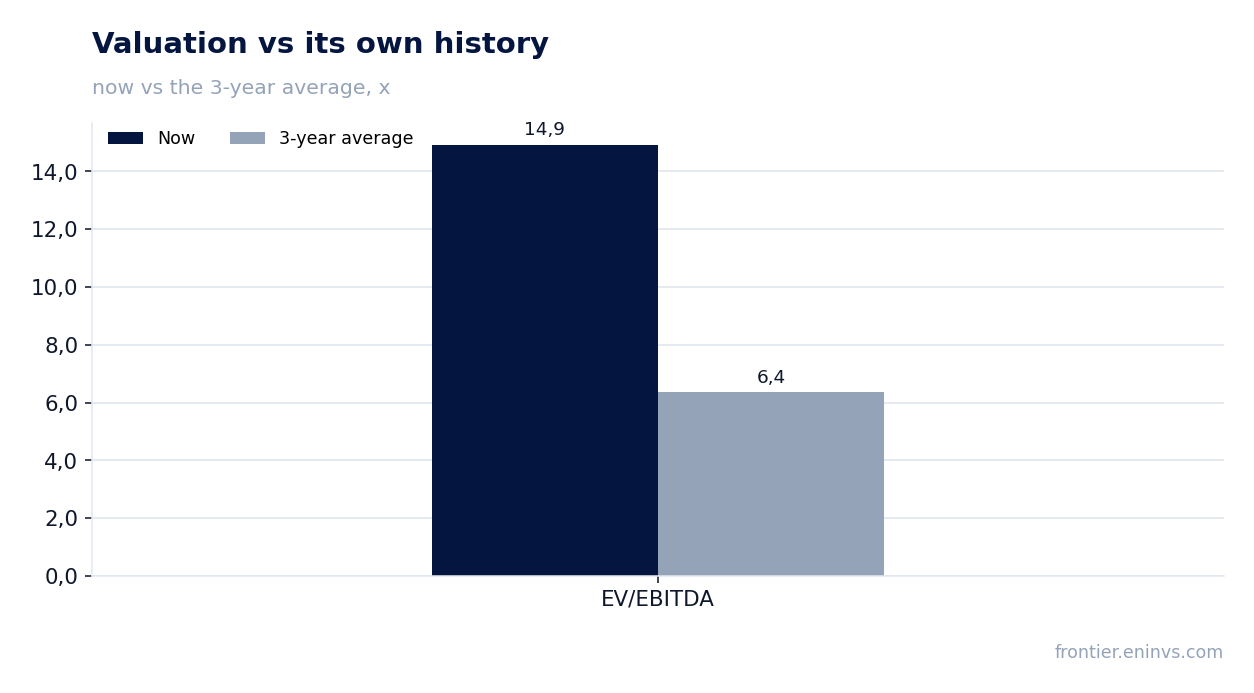
Valuation: EV/EBITDA 14.9 vs 6.4 three-year average, but portal model gives +70%
The current EV/EBITDA multiple is 14.9, more than double its own three-year average of 6.4. P/E over the trailing twelve months is 27.8. The stock trades at a premium to its own history, reflecting accelerating growth and margin expansion.
According to the portal's model, based on EBITDA growth and a target multiple, the upside potential of the shares is +70% to fair value. This is significant potential, but it assumes that current AI demand growth persists and the company can maintain high margins.
Valuation on the latest reported figures
| Metric | Value |
|---|---|
| Market cap | 77.6 bn USD |
| P/E (LTM) | 27.8 |
| EV/EBITDA (LTM) | 14.9 |
| P/B | 3.15 |
| Net debt / EBITDA (LTM) | 2.85 |
| Operating cash flow (LTM) | 2.90 bn |
| ROE | 7.9% |
| Dividend yield (12m) | 0.9% |
| EV/EBITDA, 3-year average | 6.4 |
Bottom line
The report is strong: record revenue, doubled EBITDA margin, and fivefold net profit growth. However, part of the profit is a one-off stake sale, and growth remains narrowly dependent on AI servers. Leverage is declining but remains moderate. The stock trades expensive relative to its own history, but the portal model gives +70% upside, making the verdict 'attractive'.
Open the company's financial profile HPE →
See also: market overview · valuation map · stock screeners