Interactive Brokers: revenue accelerates to +28%, but the real story is in net income and client cash flows

On July 21, Interactive Brokers reported Q2 2026 results: revenue grew 28.1% YoY to $1,896 million, net income rose 33.0% to $1,338 million. The shares look attractive: growth is accelerating, margins are expanding, and valuation remains reasonable given strong operating metrics.
Key takeaways
— Q2 revenue grew 28.1% – the fastest in six quarters
— Net income jumped 33% on higher commissions and net interest income
— EBITDA margin hit 77.7% – a record level on operating leverage
— Customer credits rose 27% and margin loans 67%, fueling interest income
— Net debt turned negative: the company accumulated $7.7 billion in cash
— Operating cash flow for the last 12 months was $15.8 billion, but mostly from client funds
Attractiveness
Key figures, USD bn
| Metric | Q2 2025 | Q2 2026 | Change |
|---|---|---|---|
| Revenue | 1.48 | 1.90 | +28.1% |
| EBITDA | — | 1.47 | — |
| Operating profit | — | 1.46 | — |
| Net profit | 1.01 | 1.34 | +33.0% |
| Operating cash flow | 7.14 | 6.22 | -12.9% |
| Capex | 0.00 | — | — |
| EBITDA margin | — | 77.7% | — |
| Net margin | 68.0% | 70.6% | +2.6 pp |
Q2 revenue grew 28.1% – the fastest in six quarters
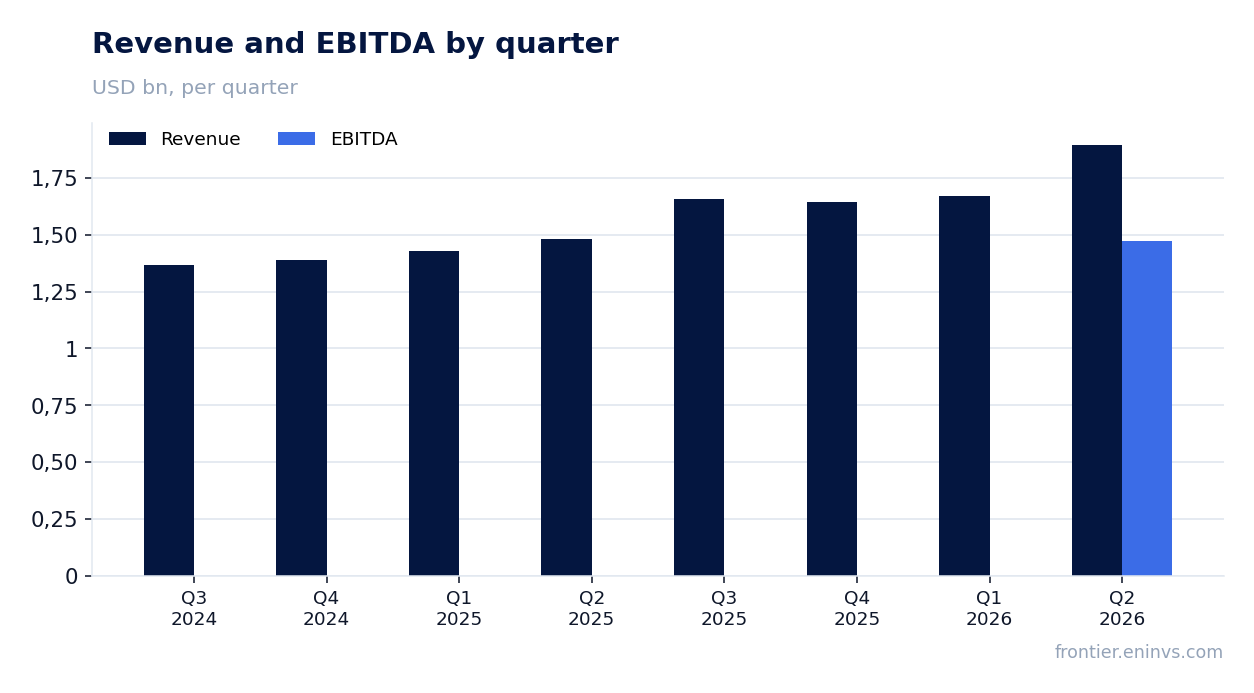
In Q2 2026, Interactive Brokers' revenue reached $1,896 million, up 28.1% YoY. This marks an acceleration from prior quarters: Q1 2026 growth was 17.0%, and the average for 2025 was around 20%. Key drivers were commission income, up 30% to $673 million, and net interest income, up 23% to $1,057 million.
Commissions benefited from higher customer trading volumes: executed orders rose 36% YoY, and DARTs increased 36%. Interest income was supported by a 67% jump in margin loans and a 27% rise in customer credits. Other fees and services grew 40% to $87 million, mainly on payments for order flow and market data fees.
Net income jumped 33% on higher commissions and net interest income
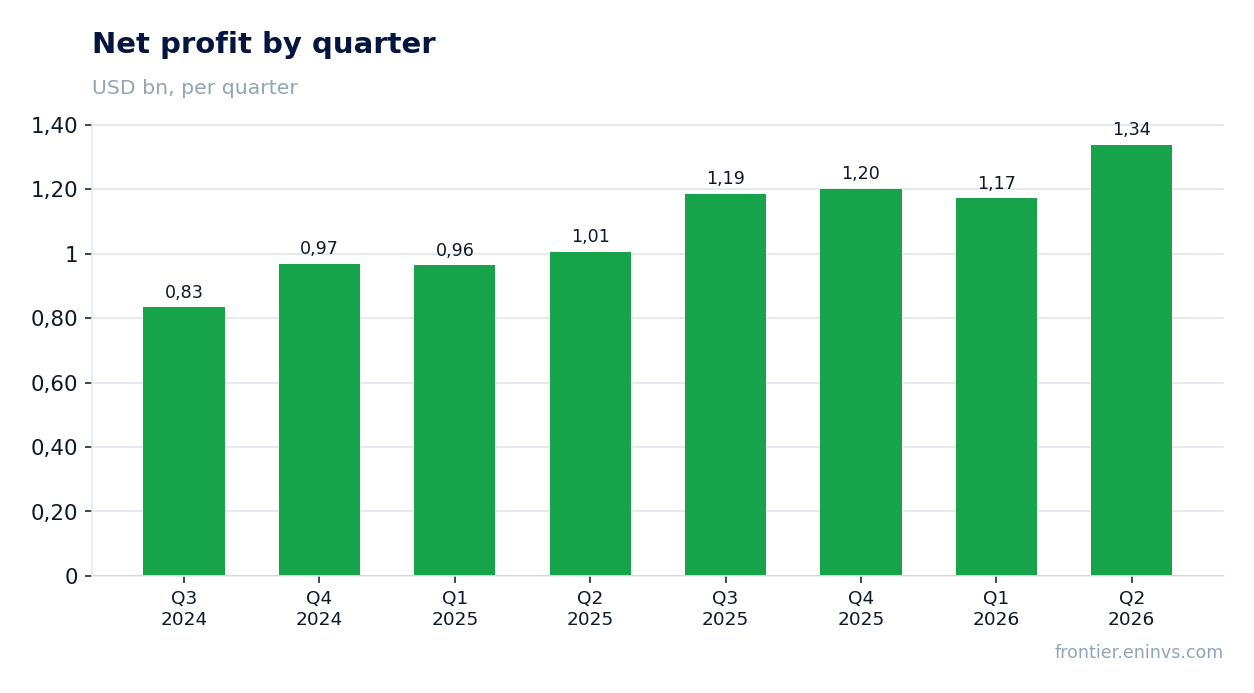
Net income in Q2 2026 rose 33.0% YoY to $1,338 million. This outpaced revenue growth, reflecting operating leverage: expenses grew only 17% (to $440 million) while revenue increased 28%. Major cost lines – execution, clearing and distribution fees (+22%), employee compensation (+12%) – grew slower than revenue.
Net margin expanded from 68.0% to 70.6%. The report also shows adjusted EPS of $0.69, matching GAAP, indicating no significant one-off items. Profit growth was also supported by other income, up 88% to $79 million, including $26 million from the currency diversification strategy.
EBITDA margin hit 77.7% – a record level on operating leverage
In Q2 2026, EBITDA reached $1,473 million, corresponding to a 77.7% margin – among the highest in the industry. Operating profit nearly matched EBITDA ($1,456 million), indicating minimal depreciation – the business is primarily technological, without heavy assets.
Such a high margin was possible because major costs – execution, clearing and distribution fees, employee compensation – grow slower than revenue. The expense ratio fell from 25.4% a year ago to 23.2% in Q2 2026. This is classic operating leverage: the platform serves a growing client base without proportional cost increases.
Customer credits rose 27% and margin loans 67%, fueling interest income
At quarter-end, customer credits reached $182.4 billion (+27% YoY), and margin loans – $108.5 billion (+67%). The surge in margin lending directly boosts interest income: average margin loans in Q2 were $96.6 billion, up 59% YoY, yielding 4.10% annually.
Net interest income rose 23% to $1,057 million, though net interest margin narrowed slightly from 2.07% to 1.93% due to higher funding costs on customer credits. Nevertheless, the scale of the business more than compensates for margin compression: customer accounts grew 34% to 5.19 million, and customer equity rose 40% to $930.3 billion, ensuring a steady stream of interest income.
Net debt turned negative: the company accumulated $7.7 billion in cash
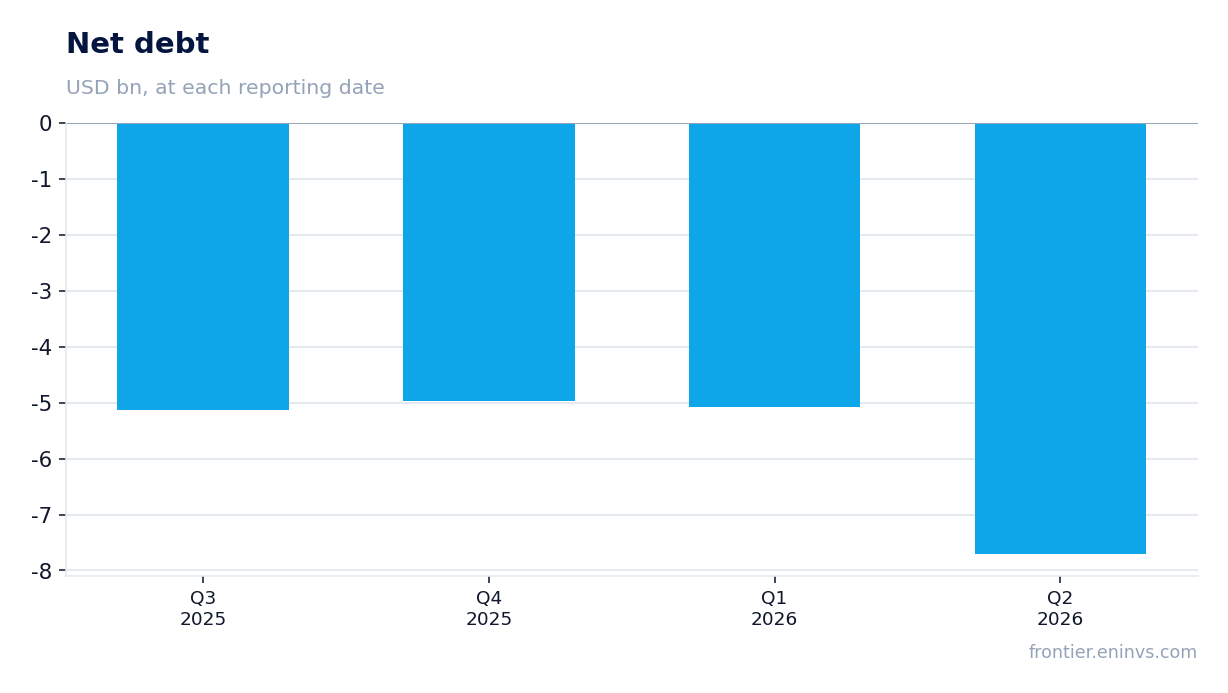
At the end of Q2 2026, cash and cash equivalents stood at $7,711 million, while short-term borrowings were only $13 million. Thus, the net cash position reached approximately $7.7 billion (negative net debt). A year earlier, the company also had a net cash position, but smaller – about $5.1 billion.
The increase in the cash cushion is related to higher client funds, but also reflects the high profitability of the business. The company does not disclose a target capital level, but negative net debt provides significant financial flexibility: the ability to raise dividends, buy back shares, or invest in growth without resorting to debt financing.
Operating cash flow for the last 12 months was $15.8 billion, but mostly from client funds
Over the last four quarters, Interactive Brokers' operating cash flow totaled $15,800 million. However, for a broker this metric is not very informative: it reflects client fund movements, not the business's ability to generate cash. In Q2 2026, operating flow was particularly high – $6,216 million – due to seasonal inflows of client deposits.
Capital expenditures are nearly zero (not disclosed in the quarter, but historically minimal), so free cash flow is close to operating cash flow. The real source of dividends is net income, which over the last 12 months was about $4,896 million (sum of four quarters). The company pays a modest dividend – $0.0875 per share quarterly, yielding less than 1% at the current price.
Valuation on the latest reported figures
| Metric | Value |
|---|---|
| Operating cash flow (LTM) | 15.8 bn |
| ROE | 93.2% |
Bottom line
The Q2 2026 report showed a rare combination of accelerating growth and margin expansion: revenue rose 28.1%, and net income 33.0%. Drivers were commissions and interest income, supported by explosive growth in client activity and margin lending. There are virtually no one-off items distorting the picture: adjusted profit matched GAAP. The company is in excellent financial shape: negative net debt, high profitability, and a growing client base. At the current valuation, the shares look attractive, especially given the potential for further growth in interest income and commissions. The key question for holders is the sustainability of margin lending in case of a market correction.
Open the company's financial profile IBKR →
See also: market overview · valuation map · stock screeners