INTEL CORP: strongest quarterly revenue growth in 15 years, but net loss of $11 billion on share revaluation
23 июля INTEL CORP раскрыла результаты за второй квартал 2026 года: выручка выросла на 25,4% год к году до 16,1 млрд долларов, EBITDA составила 5,0 млрд долларов против отрицательной год назад, однако чистый убыток достиг 11,0 млрд долларов из-за переоценки акций, переданных правительству США. На текущей цене акция выглядит непривлекательно: мультипликатор EV/EBITDA на уровне 45,3 более чем вдвое превышает средний за три года, а по модели портала потенциал снижения составляет 27%.
Key takeaways
— Revenue grew 25.4% — the strongest quarterly growth in 15 years, driven by DCAI and Intel Foundry
— EBITDA returned to growth for the first time in four quarters: margin reached 31.1% versus negative a year ago
— The $11.0 billion net loss was driven by revaluation of shares transferred to the U.S. Department of Commerce, not by operating results
— Operating cash flow reached $7.0 billion in Q2, but free cash flow remained negative after capex and partner contributions
— Leverage remains high: net debt/EBITDA for the last twelve months stands at 2.65
— The company guides Q3 revenue of $15.8–16.8 billion, implying a slowdown in growth
— Shares fell 6.6% since the release, and the portal's model implies 27% downside
Attractiveness
Key figures, USD bn
| Metric | Q2 2025 | Q2 2026 | Change |
|---|---|---|---|
| Revenue | 12.9 | 16.1 | +25.4% |
| EBITDA | -0.16 | 5.02 | to profit |
| Operating profit | -3.18 | 1.80 | to profit |
| Net profit | -2.92 | -11.0 | — |
| Operating cash flow | 2.05 | 7.01 | +241.8% |
| Capex | 3.55 | 2.56 | -28.0% |
| EBITDA margin | -1.3% | 31.1% | +32.4 pp |
| Net margin | -22.7% | -68.4% | -45.7 pp |
Revenue grew 25.4% — the strongest quarterly growth in 15 years, driven by DCAI and Intel Foundry
In Q2 2026, INTEL CORP revenue reached $16,128 million, up 25.4% year-over-year. This is the fastest quarterly growth in fifteen years, as CEO Lip-Bu Tan stated.
The main driver was the Data Center and AI (DCAI) segment, with revenue up 59% to $6.3 billion. Intel Foundry grew revenue by 31% to $5.8 billion, helped by the start of high-volume manufacturing of Panther Lake processors using ASML's High NA EUV lithography. The Client Computing and Physical AI Group (CCPG) segment added 13%, reaching $8.9 billion.
Growth accelerated versus prior quarters: in Q1 2026 revenue rose 7.2% YoY, while in Q2 2025 it was only +0.2%. The company attributes the acceleration to strong demand for AI solutions and improved execution, including higher factory yields and improved cycle times.
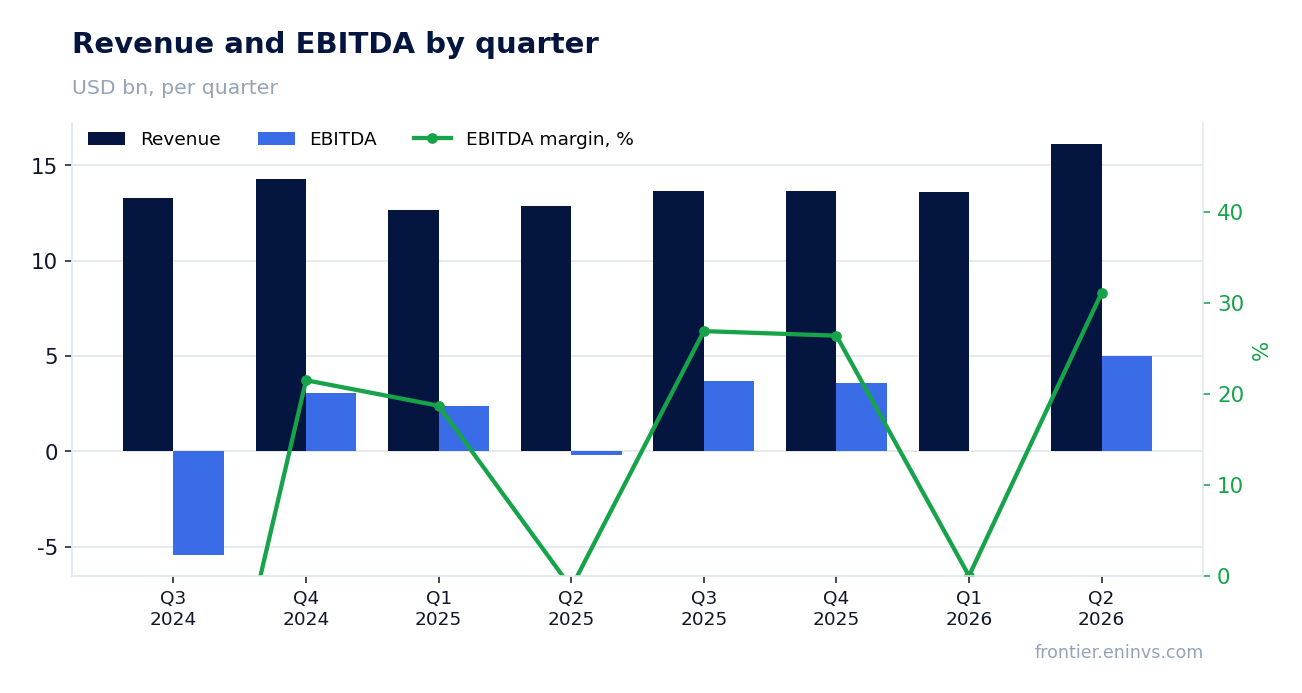
EBITDA returned to growth for the first time in four quarters: margin reached 31.1% versus negative a year ago
EBITDA in Q2 2026 reached $5,020 million versus -$163 million a year earlier. EBITDA margin came in at 31.1% — a year ago it was negative (-1.3%). This is the first positive quarter for EBITDA after four consecutive quarters of near-zero or negative readings.
Profitability improved thanks to operating leverage: revenue grew 25.4% while operating expenses rose more slowly. Specifically, R&D expenses fell 6% to $3.4 billion, and restructuring charges dropped from $1.9 billion to $0.2 billion. GAAP gross margin expanded by 12.9 percentage points to 40.4%.
Operating profit in Q2 was $1,796 million versus a loss of $3,176 million a year earlier. However, in Q1 2026 operating profit was negative (-$3,136 million), indicating volatility in operating results.
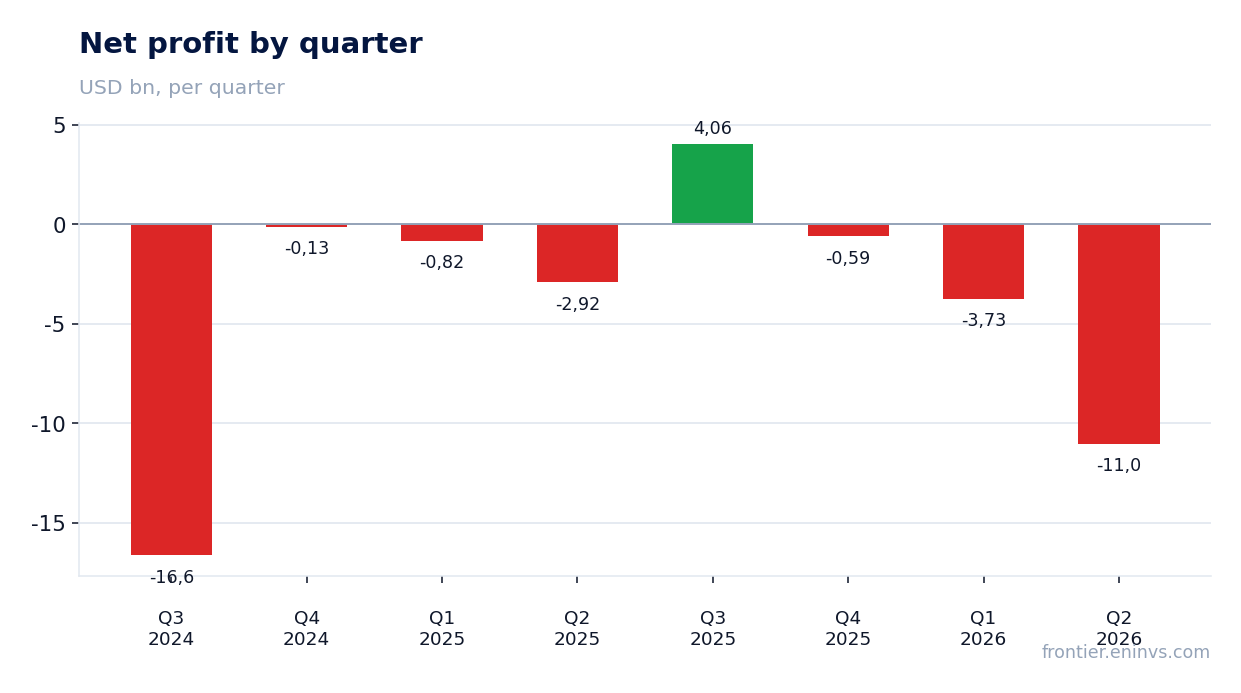
The $11.0 billion net loss was driven by revaluation of shares transferred to the U.S. Department of Commerce, not by operating results
INTEL CORP's net loss in Q2 2026 was $11,033 million versus a loss of $2,918 million a year earlier. The main driver was the 'Interest and other, net' line of -$12,576 million, which includes the revaluation of shares held in escrow under the CHIPS Act agreement with the U.S. Department of Commerce.
The release states that the mark-to-market loss on Escrowed Shares was $12,529 million. This is a non-cash item related to changes in the fair value of the derivative liability. Without it, the company would have been profitable: non-GAAP net income was $2,197 million, or $0.42 per share.
The first-half 2026 loss reached $15,129 million, but again a large part comes from the escrowed shares revaluation. Operating activity remains profitable, but the scale of non-cash write-downs distorts GAAP results.
Operating cash flow reached $7.0 billion in Q2, but free cash flow remained negative after capex and partner contributions
In Q2 2026, operating cash flow reached $7,006 million — the best quarterly figure in the period under review. A year earlier it was $2,050 million. Capital expenditures fell to $2,556 million from $3,550 million a year earlier.
However, free cash flow, calculated as operating cash flow minus capex, minus finance lease payments and adjusted for partner contributions, remained negative: -$8,419 million. This is due to large outflows under partner agreements (net partner contributions were -$12,216 million), reflecting investments in joint ventures and manufacturing capacity financing.
Over the last twelve months, operating cash flow was $9,700 million, and capex for the same period was about $15.2 billion (sum of quarterly values). Thus, even without partner outflows, the company spends more on capex than it generates from operations.
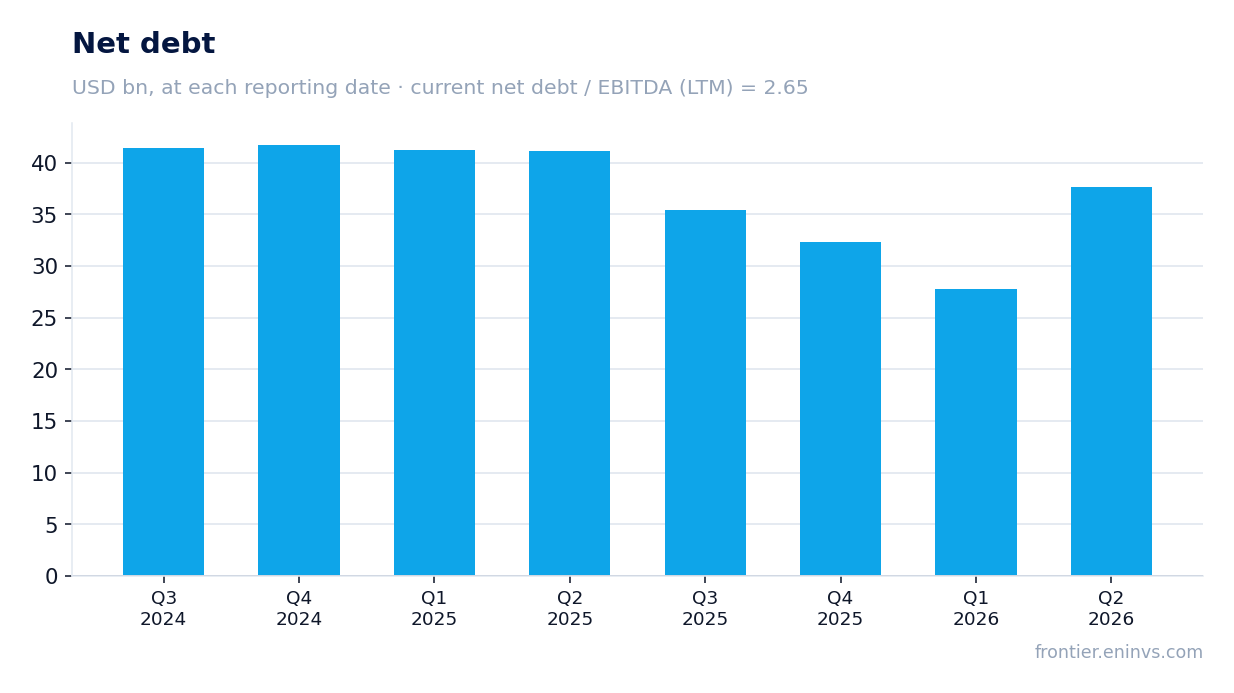
Leverage remains high: net debt/EBITDA for the last twelve months stands at 2.65
INTEL CORP's net debt at the end of Q2 2026 was $37,663 million, up from $27,784 million at the end of Q1. Over the last twelve months, net debt decreased by $3.5 billion but remains substantial.
Net debt/EBITDA for the last twelve months is 2.65. EBITDA for that period was $12,184 million, only slightly above the year-ago level, so debt reduction has not yet led to a noticeable improvement in the multiple.
The company continues to invest heavily in manufacturing capacity, including the announced €5 billion investment to expand Xeon production, which will keep capex high and likely require additional debt financing.
The company guides Q3 revenue of $15.8–16.8 billion, implying a slowdown in growth
INTEL CORP expects Q3 2026 revenue in the range of $15.8–16.8 billion. At the midpoint of $16.3 billion, this would imply growth of roughly 19% YoY, compared to actual Q3 2025 revenue of $13,653 million. That is a noticeable slowdown from 25.4% in Q2.
The company also guides GAAP EPS of $0.31 and non-GAAP EPS of $0.38. Gross margin guidance is 41.0% GAAP and 42.0% non-GAAP, above Q2 levels (40.4% GAAP).
The revenue slowdown may be due to a high base in DCAI and Intel Foundry, as well as ongoing macroeconomic uncertainty. Nevertheless, management reaffirms expectations of sustainable growth driven by AI demand.
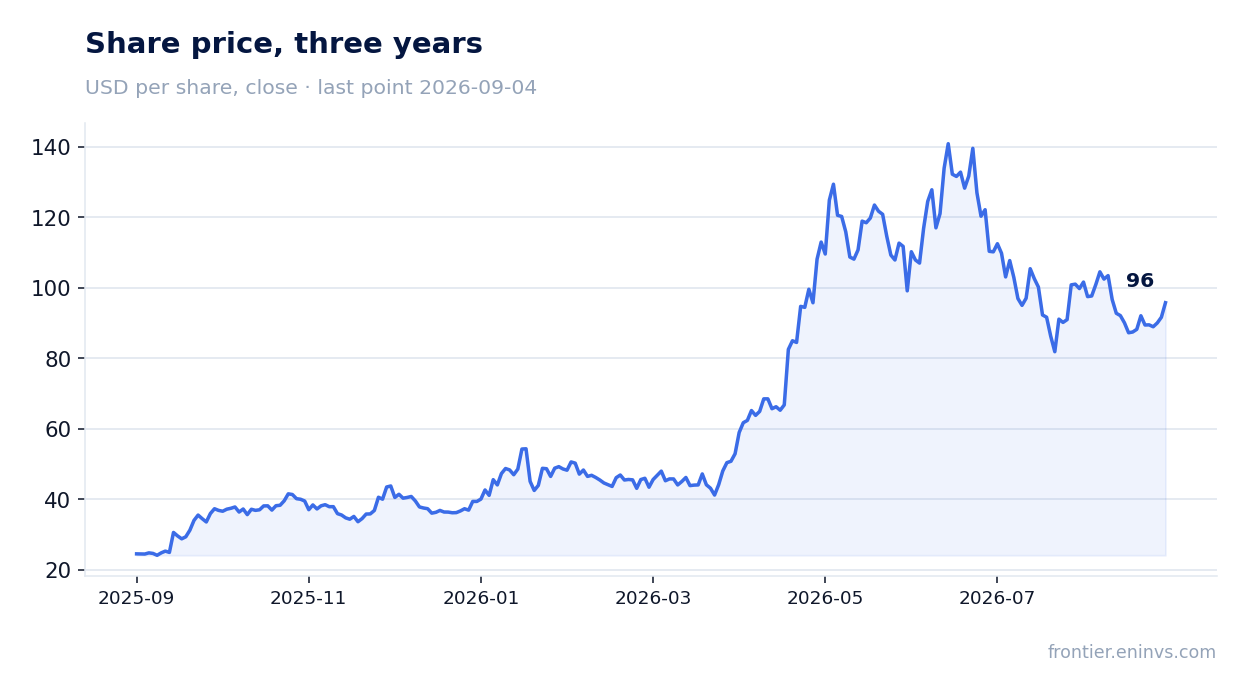
Shares fell 6.6% since the release, and the portal's model implies 27% downside
The share price before the release was $102.62. On the release day, shares fell 2.3%, and by September 4, 2026, they were down another 6.6%. Thus, the market reacted negatively to the report despite strong operating results.
According to the portal's fundamental value model, the upside is -27% — meaning the model values the stock below its current market price. This suggests the market is already pricing in significant optimism about future growth.
INTEL CORP shares are held in the 'US Tech' and 'AI leaders' strategies on the portal, reflecting their presence in portfolios focused on technology and AI. However, this is not an argument for attractiveness — membership follows each strategy's own screen.
Valuation on the latest reported figures
| Metric | Value |
|---|---|
| Market cap | 519 bn USD |
| EV/EBITDA (LTM) | 45.3 |
| P/B | 4.54 |
| Net debt / EBITDA (LTM) | 2.65 |
| Operating cash flow (LTM) | 9.70 bn |
| ROE | -50.4% |
Bottom line
The Q2 2026 report showed the strongest revenue growth in 15 years and a return of EBITDA to positive territory, confirming the effectiveness of the AI and foundry strategy. However, net profit was deeply negative due to a non-cash revaluation of shares transferred to the U.S. government, and free cash flow remained negative even with record operating cash flow. Leverage remains high, and the Q3 guidance implies a slowdown in growth. At the current price, with EV/EBITDA at 45.3 and the portal's model implying 27% downside, the share looks unattractive: the market has already priced in significant optimism, and a reassessment would require sustained improvement in cash flows and debt reduction.
Open the company's financial profile INTC →
See also: market overview · valuation map · stock screeners