INTUITIVE SURGICAL INC: revenue up 19%, but shares down 9% after earnings
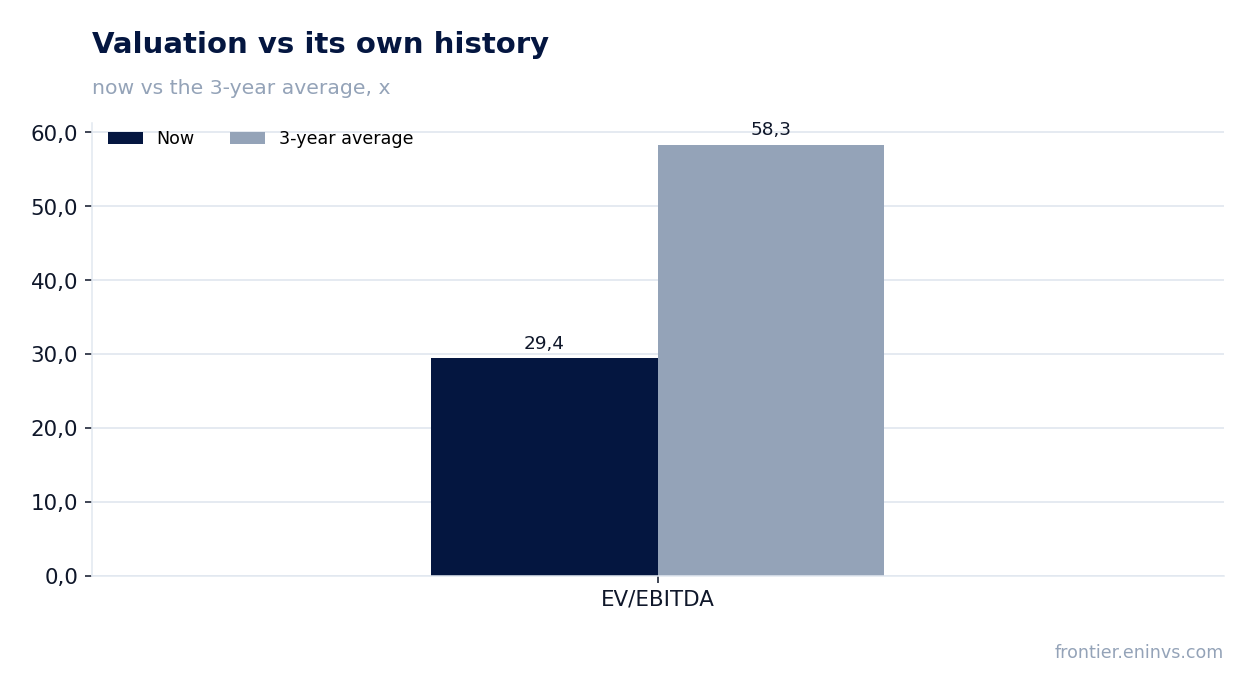
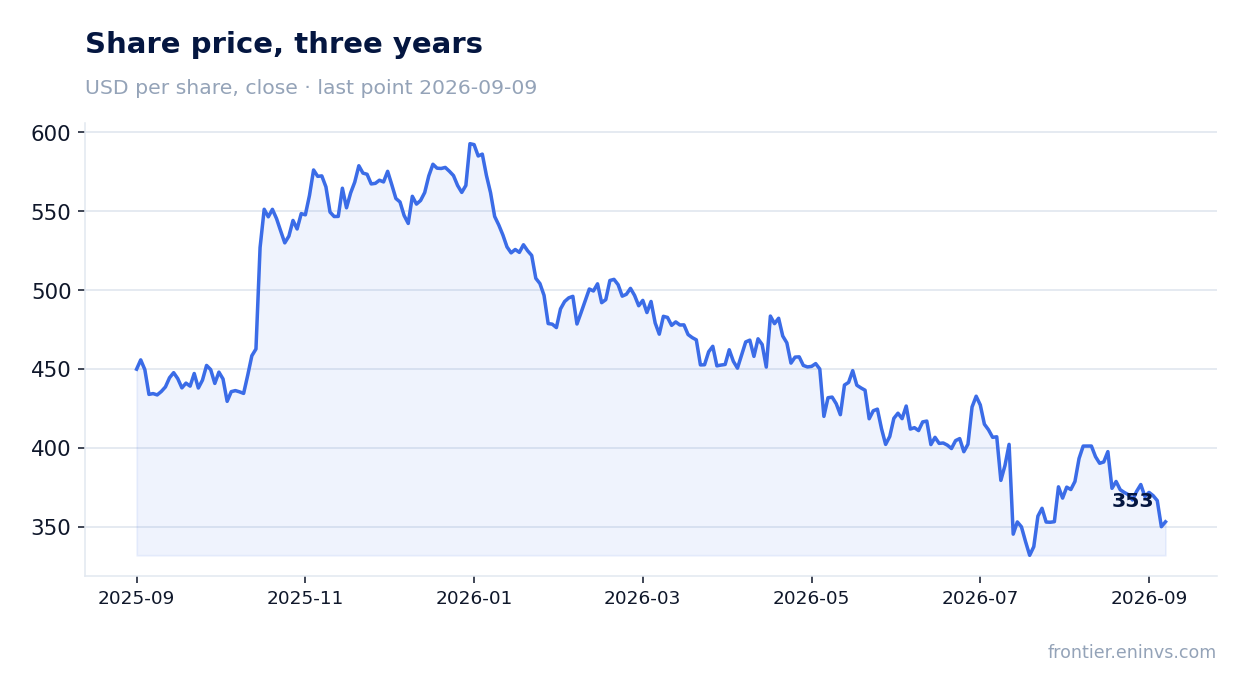
16 июля 2026 года INTUITIVE SURGICAL INC раскрыла результаты за второй квартал 2026 года. Выручка выросла на 18,5% год к году до 2 892,3 млн долларов, EBITDA – на 33,4% до 995,9 млн, чистая прибыль – на 24,3% до 818,1 млн. Акции после выхода отчёта подорожали на 3,4%, но к 9 сентября потеряли 9,2% – рынок разочарован прогнозом по процедурам и сохраняющимися тарифными рисками. На текущей цене бумага выглядит скорее привлекательно: мультипликатор EV/EBITDA в 29,4 раза ниже собственного трёхлетнего среднего в 58,3 раза, а модель портала даёт апсайд в 19%.
Key takeaways
— Q2 revenue up 18.5% on procedure growth and a larger installed base
— EBITDA margin reached 34.4% versus 30.6% a year earlier – operating leverage and tariff refunds
— Net profit up 24.3%, but included a one-off tariff refund of $28 million
— The company placed 468 da Vinci systems, 246 of them da Vinci 5, and 55 Ion systems
— Net debt stays negative at -$5,045.3 million
— 2026 guidance: da Vinci procedure growth of 13.5–15.5%, but tariffs could hit margins
— Valuation: EV/EBITDA of 29.4x is half its own three-year average; the portal model implies 19% upside
Attractiveness
Key figures, USD bn
| Metric | Q2 2025 | Q2 2026 | Change |
|---|---|---|---|
| Revenue | 2.44 | 2.89 | +18.5% |
| EBITDA | 0.75 | 1.00 | +33.4% |
| Operating profit | 0.74 | 0.97 | +30.7% |
| Net profit | 0.66 | 0.82 | +24.3% |
| Operating cash flow | 0.72 | 1.06 | +48.3% |
| Capex | 0.16 | 0.11 | -27.5% |
| EBITDA margin | 30.6% | 34.4% | +3.8 pp |
| Net margin | 27.0% | 28.3% | +1.3 pp |
Q2 revenue up 18.5% on procedure growth and a larger installed base
In Q2 2026, INTUITIVE SURGICAL INC revenue reached $2,892.3 million, up 18.5% year over year. Growth was driven by da Vinci and Ion procedures: worldwide procedures grew approximately 16%, including 15% for da Vinci and 36% for Ion. The installed base of da Vinci systems reached 11,710 units (+12% YoY), and Ion – 1,096 units (+21%).
Instruments and accessories revenue rose 18% to $1,734.9 million, systems revenue to $685.0 million (+19%), and services revenue to $472.4 million (+21%). The company placed 468 da Vinci systems versus 395 a year earlier, 246 of them the latest da Vinci 5. Systems revenue also benefited from a larger lease installed base and higher average selling prices.
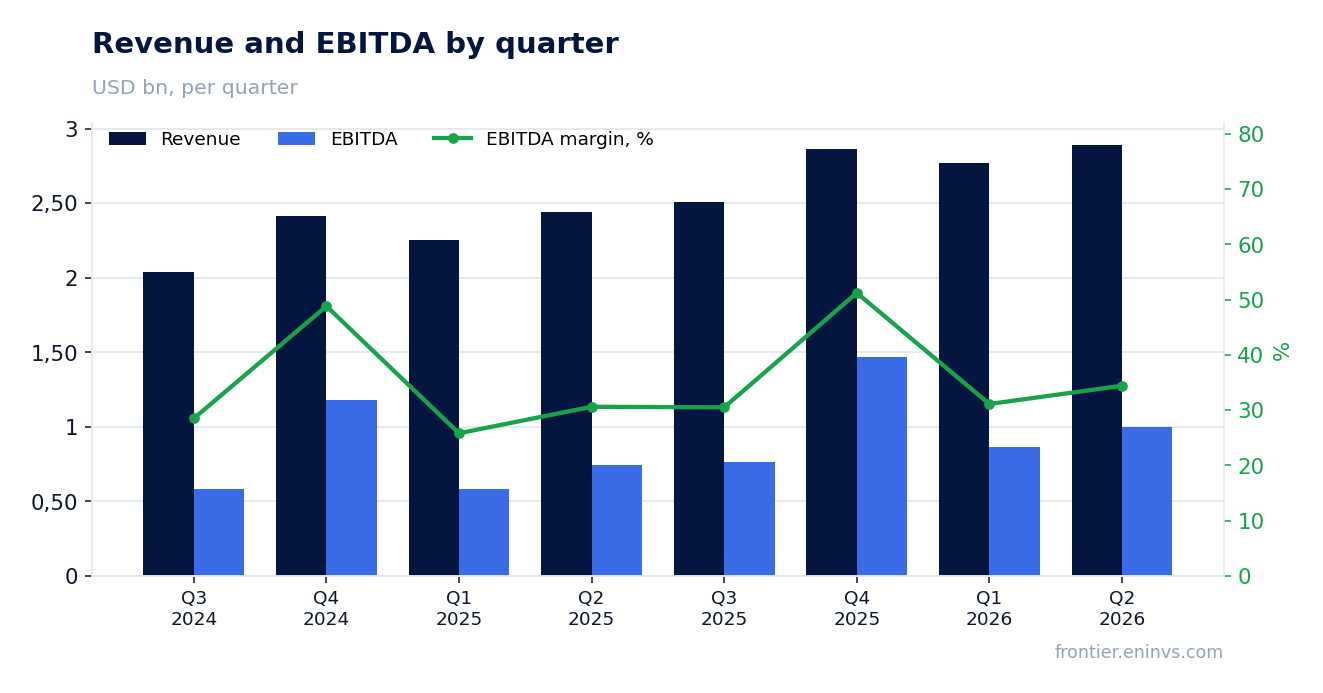
EBITDA margin reached 34.4% versus 30.6% a year earlier – operating leverage and tariff refunds
EBITDA in Q2 2026 rose 33.4% to $995.9 million, with the EBITDA margin expanding from 30.6% to 34.4%. The main drivers were operating leverage – revenue grew faster than operating expenses – and a one-off refund of tariffs paid in prior periods under IEEPA of $28 million (net of tax).
Operating profit increased to $971.9 million from $743.4 million a year earlier. Selling, general and administrative expenses were $617.9 million, and R&D – $370.6 million. Excluding one-off items, non-GAAP operating profit reached $1,218.0 million versus $946.6 million in Q2 2025.
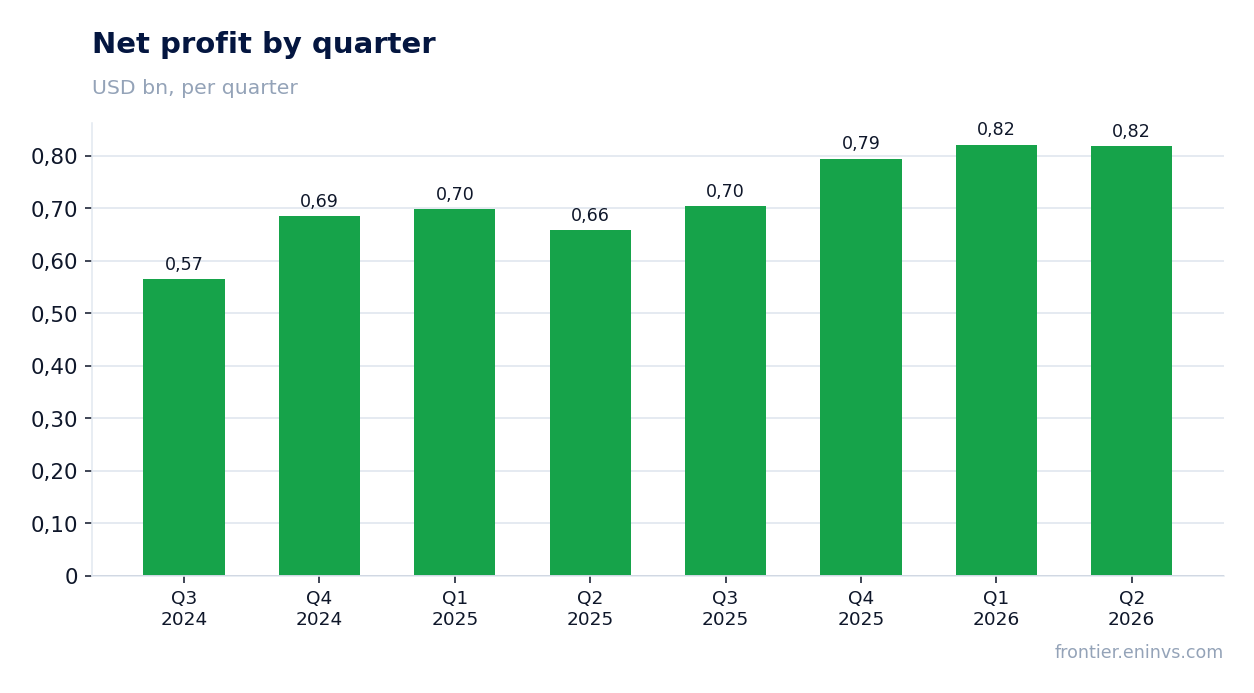
Net profit up 24.3%, but included a one-off tariff refund of $28 million
Net profit in Q2 2026 was $818.1 million, up 24.3% year over year. Growth was driven by higher revenue and operating profit, as well as a positive net interest and other income balance of $82.7 million.
Profit included a one-off IEEPA tariff refund of $28 million (net of tax), or $0.08 per diluted share. Excluding this and other non-operating items, non-GAAP net profit was $1,002.1 million versus $797.9 million a year earlier. Income tax expense rose to $231.4 million from $167.9 million, partly due to the absence of large excess tax benefits from share-based compensation.
The company placed 468 da Vinci systems, 246 of them da Vinci 5, and 55 Ion systems
In Q2 2026, INTUITIVE SURGICAL INC placed 468 da Vinci systems, up 18% from 395 a year earlier. Of these, 246 were the latest da Vinci 5 systems, versus 180 in Q2 2025. The company also placed 55 Ion systems versus 54 a year earlier.
Higher placements support future revenue: each installed system generates a recurring stream of instrument and service revenue. The installed base of da Vinci grew 12% to 11,710 systems, and Ion – 21% to 1,096 systems. This underpins sustainable procedure growth and, in turn, instrument revenue in the coming years.
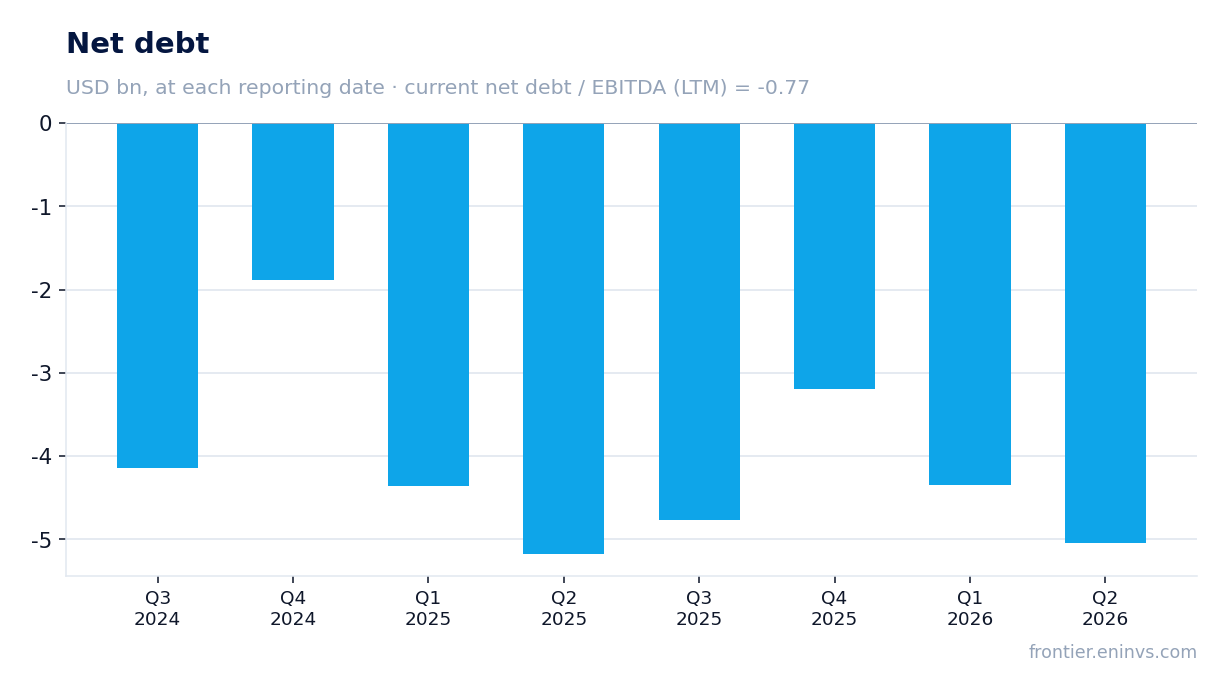
Net debt stays negative at -$5,045.3 million
At the end of Q2 2026, INTUITIVE SURGICAL INC net debt was -$5,045.3 million, meaning cash and investments far exceed debt. The company ended the quarter with $8,625.5 million in cash and investments, up $650 million during the quarter, driven by operating cash flow.
Operating cash flow for the quarter was $1,061.0 million, and capital expenditures were $112.6 million. The company also spent $380 million to repurchase 0.9 million shares. Net debt to EBITDA for the trailing twelve months is -0.77, indicating strong financial stability.
2026 guidance: da Vinci procedure growth of 13.5–15.5%, but tariffs could hit margins
The company reaffirmed its 2026 guidance: worldwide da Vinci procedure growth is expected at 13.5–15.5%, with the company expecting to be closer to the midpoint. Non-GAAP gross margin is forecast at 68.0–69.0% of revenue, including an estimated tariff impact of 1.0% of revenue.
Non-GAAP operating expense growth is expected at 11–13%. The company warns that if additional tariffs beyond current expectations are implemented, the impact on 2026 financial results, including gross margin, could be material. Tariffs remain a key risk to margins in the second half.
Valuation: EV/EBITDA of 29.4x is half its own three-year average; the portal model implies 19% upside
At the current price, INTUITIVE SURGICAL INC trades at an EV/EBITDA multiple of 29.4x for the trailing twelve months. This is well below its own three-year average EV/EBITDA of 58.3x. The P/E for the trailing twelve months is 39.96x.
On the portal's model, which assesses EBITDA growth and a target multiple, the share's upside to fair value is 19%. After the earnings release, shares rose 3.4%, but by September 9 they had lost 9.2%, reflecting market caution about procedure guidance and tariff risks. Nevertheless, the current valuation looks attractive relative to the company's own history.
Valuation on the latest reported figures
| Metric | Value |
|---|---|
| Market cap | 125 bn USD |
| P/E (LTM) | 40.0 |
| EV/EBITDA (LTM) | 29.4 |
| P/B | 7.04 |
| Net debt / EBITDA (LTM) | -0.77 |
| Operating cash flow (LTM) | 3.00 bn |
| ROE | 18.4% |
| EV/EBITDA, 3-year average | 58.3 |
Bottom line
The Q2 2026 report is strong: revenue and profit are growing at double-digit rates, margins are expanding, the installed base is increasing, and net debt remains negative. The one-off tariff refund of $28 million flattered profit, but even without it the dynamics are impressive. The key question for holders is whether procedure growth stays within guidance and whether new tariffs hit margins. At the current valuation – EV/EBITDA of 29.4x versus a three-year average of 58.3x – the share looks rather attractive, and the portal model confirms 19% upside.
Open the company's financial profile ISRG →
See also: market overview · valuation map · stock screeners