Kimco Realty: record leasing, but net income falls on one-off transactions
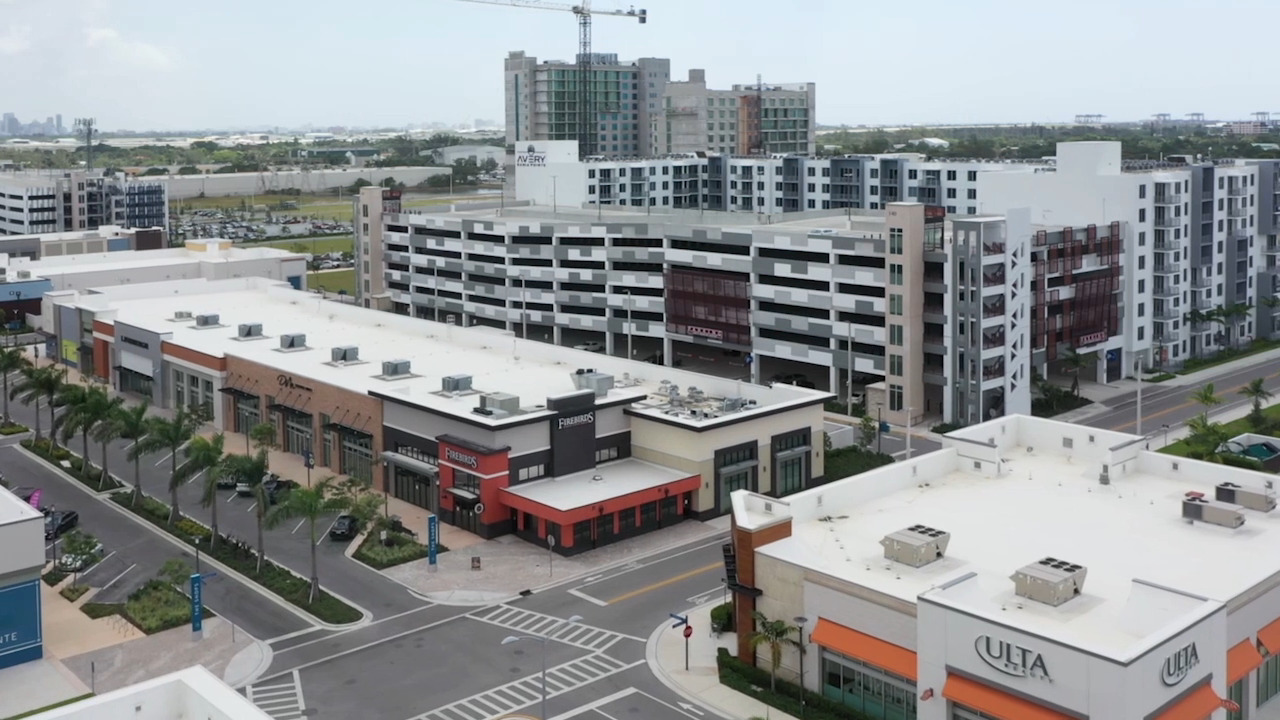
On August 4, 2026, Kimco Realty reported results for the second quarter of 2026. Revenue rose 4.9% to $550.8 million, but net income fell 6.0% to $153.3 million due to lower gains on asset sales. The shares look attractive: record occupancy and rising rent spreads offset the temporary earnings decline.
Key takeaways
— Portfolio occupancy hit a record 96.4%, and rents on new leases rose 40.4%
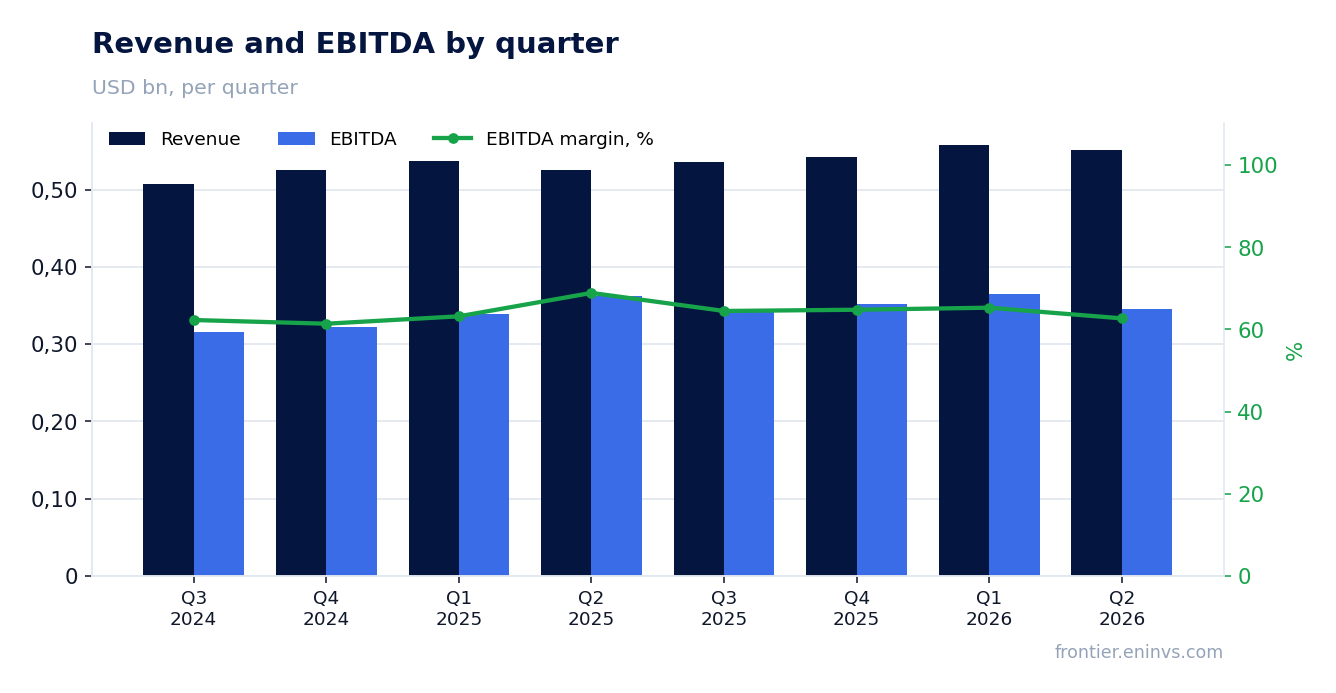
— EBITDA fell 4.7% on one-off sales losses, but operating profit rose 4.9%
— Operating cash flow rose to $345.3 million for the quarter, covering dividends and investments
— The company raised its dividend by 12% and lifted its 2026 FFO outlook
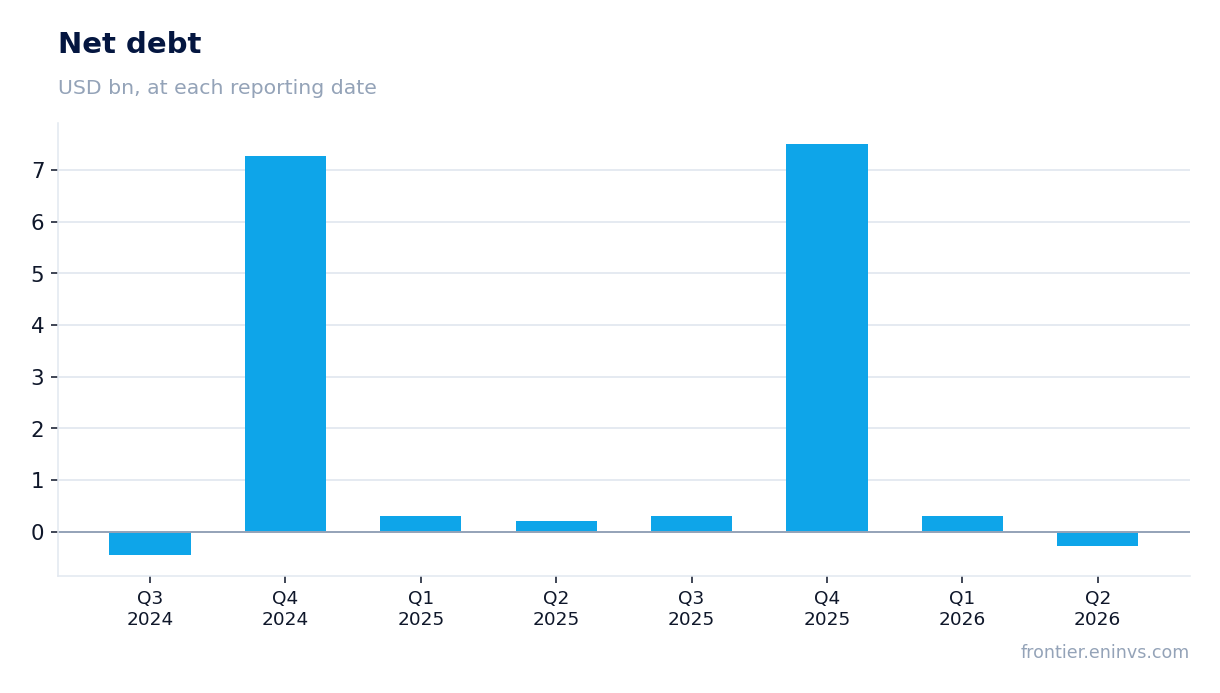
— Net debt turned negative, but the balance-sheet debt figure is distorted by one-off items
Attractiveness
Key figures, USD bn
| Metric | Q2 2025 | Q2 2026 | Change |
|---|---|---|---|
| Revenue | 0.53 | 0.55 | +4.9% |
| EBITDA | 0.36 | 0.35 | -4.7% |
| Operating profit | 0.21 | 0.20 | -4.7% |
| Net profit | 0.16 | 0.15 | -6.0% |
| Operating cash flow | 0.31 | 0.35 | +13.1% |
| Capex | 0.00 | — | — |
| EBITDA margin | 68.9% | 62.7% | -6.2 pp |
| Net margin | 31.0% | 27.8% | -3.2 pp |
Portfolio occupancy hit a record 96.4%, and rents on new leases rose 40.4%
In the second quarter of 2026, Kimco signed 461 leases totaling 2.5 million square feet. Portfolio occupancy rose 100 basis points year-over-year to 96.4% – an all-time high. Small-shop occupancy reached a record 92.9%, up 70 basis points from a year ago.
Cash rent spreads on comparable new leases rose 40.4%, renewals 6.1%, and options 8.0%. Blended spreads were 13.1%. This confirms strong demand for open-air grocery-anchored centers despite a broader retail slowdown.
EBITDA fell 4.7% on one-off sales losses, but operating profit rose 4.9%
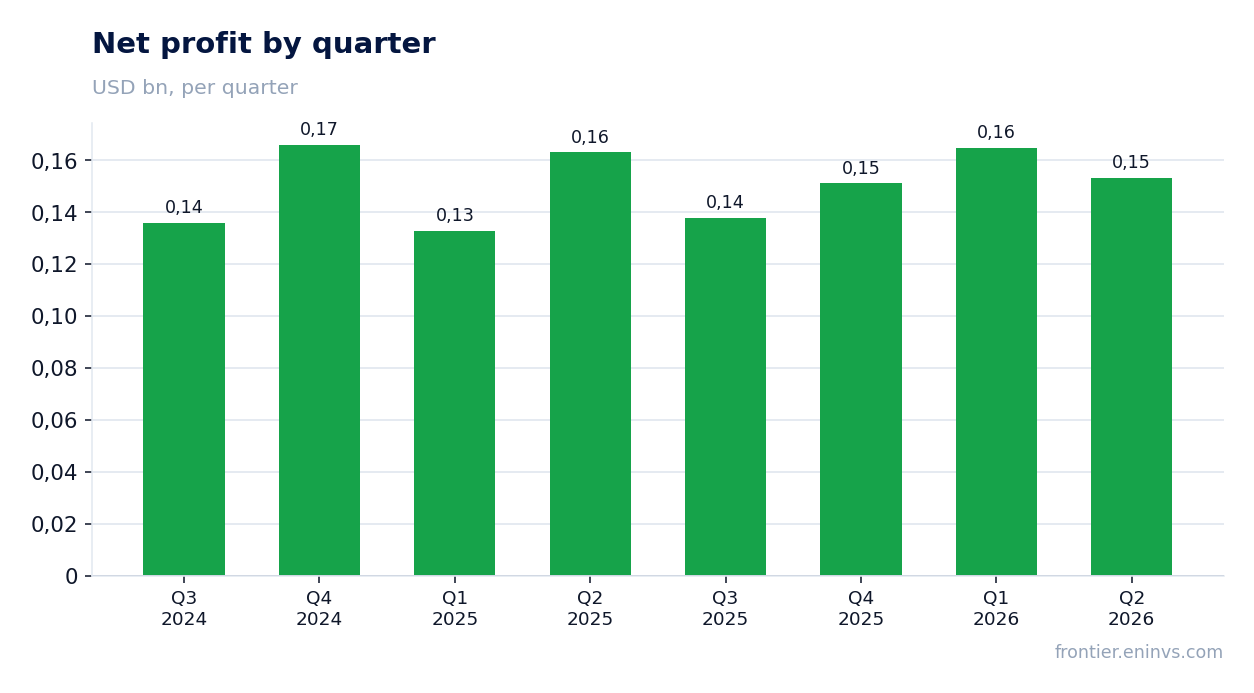
In Q2 2026, EBITDA was $345.1 million, down 4.7% from a year earlier. The cause is lower gains on property sales: the release notes that revenue growth and higher equity income from joint ventures were offset by a $37.6 million decline in gains on sales.
Operating profit, by contrast, rose 4.9% to $196.1 million, and net income fell only 6.0% to $153.3 million – mainly due to the same one-off transactions. Excluding sales, operations show steady growth.
Operating cash flow rose to $345.3 million for the quarter, covering dividends and investments
Operating cash flow in Q2 2026 was $345.3 million – the best quarterly figure in two years. Over the last twelve months, operating cash flow reached $1,100 million, comfortably covering capital expenditures and dividends.
Capex for the quarter was not disclosed, but for the first half the company spent $82 million on redevelopment and $115 million on leasing and maintenance. Cash flow funds these investments without adding debt.
The company raised its dividend by 12% and lifted its 2026 FFO outlook
The board declared a quarterly dividend of $0.28 per share, up 12% from a year earlier. The increase came a quarter ahead of schedule, which management attributes to confidence in the long-term outlook.
The 2026 FFO outlook was raised to $1.83–$1.84 per share from $1.81–$1.84. The net income outlook was also improved to $1.00–$1.03 from $0.83–$0.87. The company expects same-property NOI growth of 3.0–3.5% this year.
Net debt turned negative, but the balance-sheet debt figure is distorted by one-off items
At the end of Q2 2026, net debt was minus $267.6 million, meaning cash exceeds debt. However, the report shows net debt of $7,505.9 million – this figure likely includes operating lease liabilities and other items, making it incomparable with prior periods.
Net debt fell by $0.6 billion in the quarter and $0.5 billion over the year. The company issued $600 million in exchangeable notes and repurchased shares for $104.7 million, while maintaining liquidity of $2.7 billion.
Valuation on the latest reported figures
| Metric | Value |
|---|---|
| Operating cash flow (LTM) | 1.10 bn |
| ROE | 5.9% |
Bottom line
The report's strengths are record occupancy, double-digit rent spreads on new leases, and a dividend increase. The weakness is lower EBITDA and net income due to one-off sales, which does not reflect operating dynamics. Cash flow remains strong and covers investments. The key question for holders is whether the company can sustain rent growth amid a retail slowdown. So far the answer is positive, and the shares look attractive.
Open the company's financial profile KIM →
See also: market overview · valuation map · stock screeners