KULICKE & SOFFA INDUSTRIES INC: profit jumped 17-fold, but almost none of it has turned into cash yet
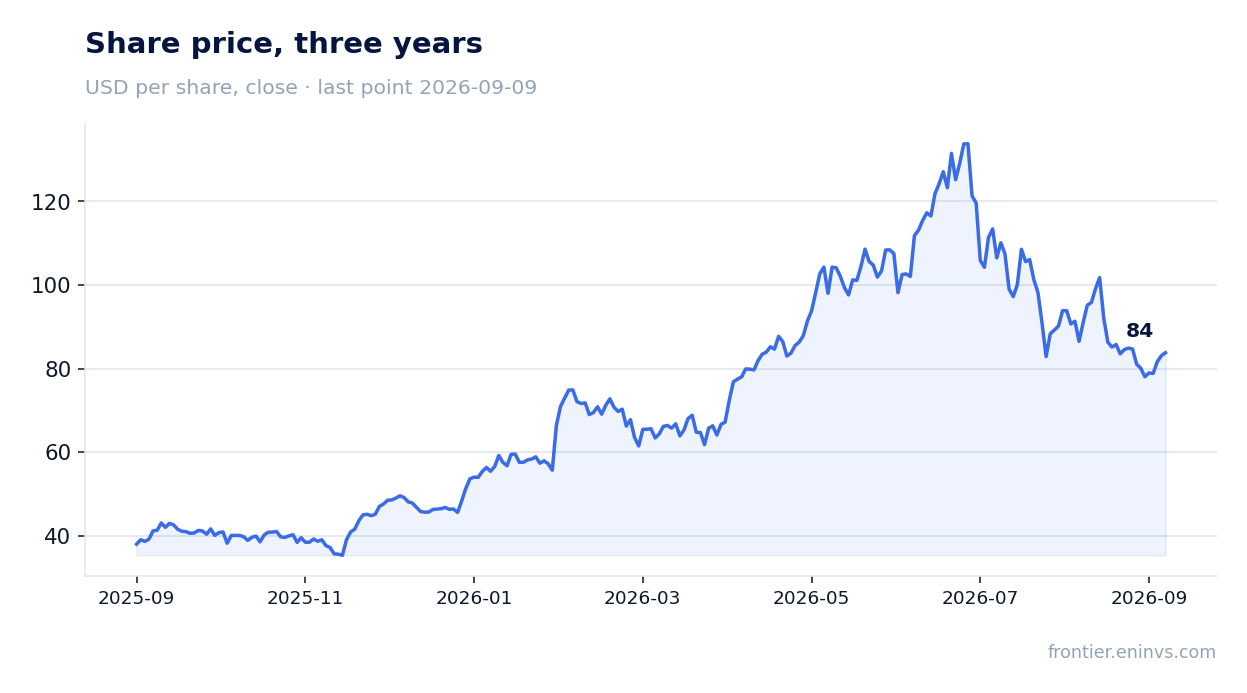
On August 5, KULICKE & SOFFA INDUSTRIES INC reported results for the third quarter of fiscal 2026. Revenue rose 122.6% year on year to $330.4 million, net income reached $57.4 million against a $3.3 million loss a year earlier, and EBITDA margin hit 21.9% versus minus 1.5%. Yet free cash flow remains modest relative to profit, and the share has fallen 10.7% since the release. In our view the stock looks attractive: the portal's model implies 38% upside to fair value, and the forward multiple will be well below its historical level.
Key takeaways
— Revenue rose 122.6% year on year to $330.4 million, the best quarterly result in available history
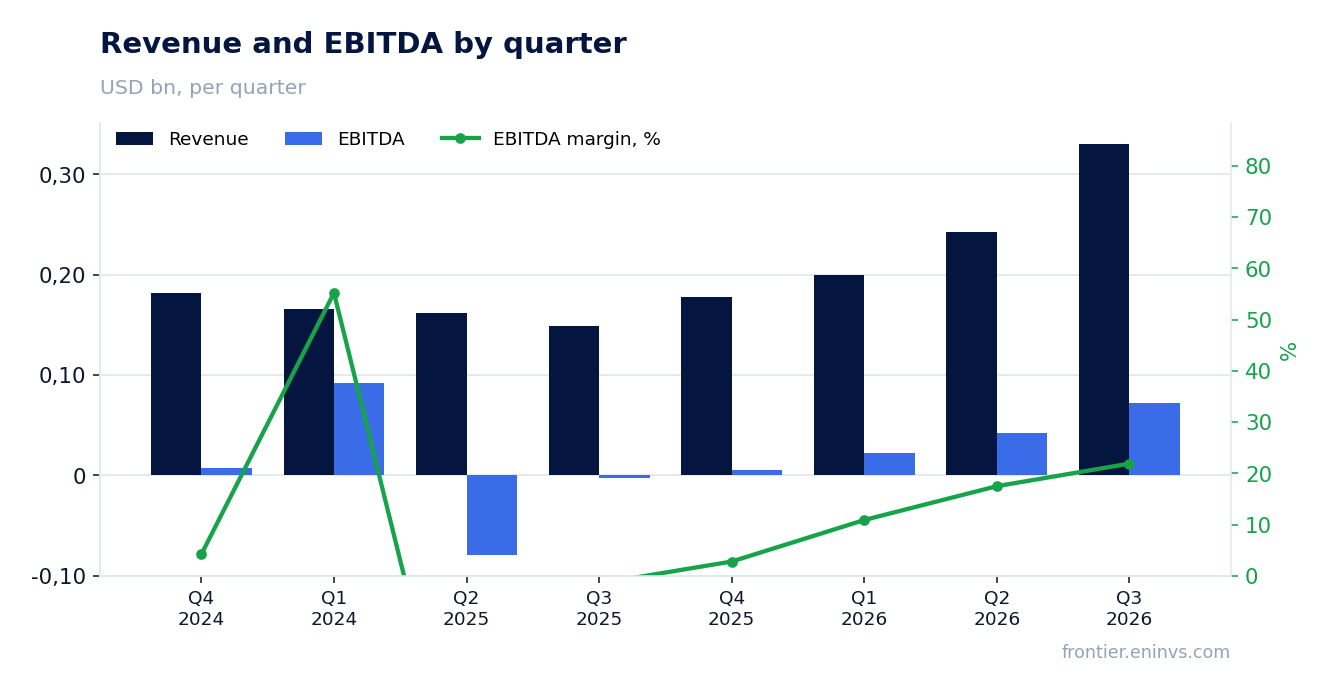
— EBITDA margin of 21.9% versus minus 1.5% a year earlier – the improvement comes from scale, not one-offs
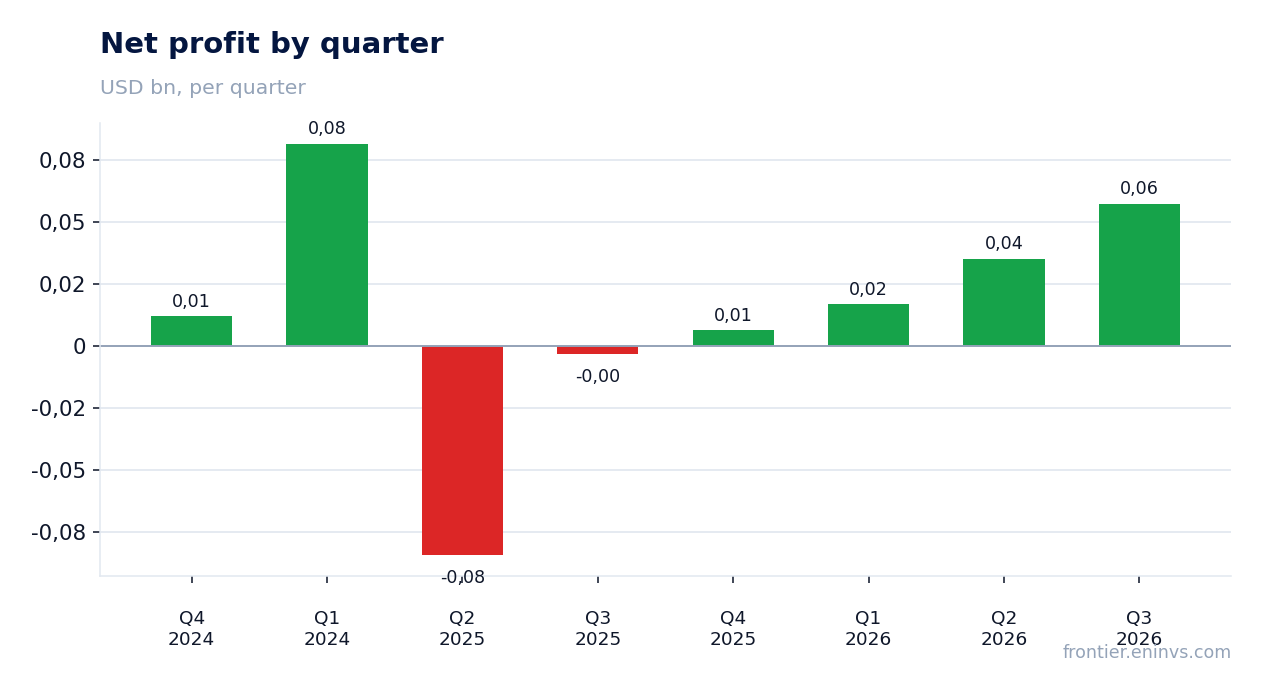
— Net income of $57.4 million includes $7.0 million of non-cash share-based compensation
— Operating cash flow of $45.2 million and free cash flow of $41.0 million – cash conversion remains low
— Leverage is negative: net cash position of $177.2 million, not debt
— Dividend of $0.205 per share for the quarter – trailing yield of 0.98%, below the key rate
— The portal's model implies 38% upside to fair value, but the LTM EV/EBITDA multiple of 258x reflects the one-off nature of profit
Attractiveness
Key figures, USD bn
| Metric | Q3 2025 | Q3 2026 | Change |
|---|---|---|---|
| Revenue | 0.15 | 0.33 | +122.6% |
| EBITDA | -0.00 | 0.07 | to profit |
| Operating profit | -0.01 | 0.07 | to profit |
| Net profit | -0.00 | 0.06 | to profit |
| Operating cash flow | 0.01 | 0.05 | +512.7% |
| Capex | 0.00 | 0.00 | +105.7% |
| EBITDA margin | -1.5% | 21.9% | +23.4 pp |
| Net margin | -2.2% | 17.4% | +19.6 pp |
Revenue rose 122.6% year on year to $330.4 million, the best quarterly result in available history
In the third quarter of fiscal 2026, revenue reached $330.4 million, up 122.6% year on year. This is not only an absolute record for available history but also a sharp acceleration: growth was 49.8% in the previous quarter, while a year earlier revenue was falling 18.3%. Sequential growth from $242.6 million in the second quarter is 36.2%.
The company does not provide a segment breakdown in this press release but notes that demand is improving across all end markets. The main driver is semiconductor assembly equipment used in automotive, compute, industrial, memory and communications. The expansion of the Advanced Solutions production facility is scheduled for completion in the second half of fiscal 2027, indicating a bet on further growth.
EBITDA margin of 21.9% versus minus 1.5% a year earlier – the improvement comes from scale, not one-offs
EBITDA margin in the reported quarter was 21.9%, whereas a year earlier it was negative at minus 1.5%. This turnaround is explained by revenue growing faster than fixed costs. Operating expenses rose to $89.7 million from $75.3 million a year earlier, an increase of only 19%, while revenue more than doubled. This produced an operating leverage effect.
Gross margin reached 47.8%, a high level for an equipment manufacturer. The company does not disclose cost line details, but the report structure shows that sales volume, not cost cutting, was the main contributor to profit growth. One-off items such as restructuring amounted to only $0.2 million and had no significant impact on the margin.
Net income of $57.4 million includes $7.0 million of non-cash share-based compensation
GAAP net income was $57.4 million, or $1.07 per diluted share. A year earlier there was a loss of $3.3 million. Non-GAAP net income was higher at $64.2 million, or $1.20 per share. The difference of $6.8 million is mainly due to non-cash share-based compensation of $7.0 million.
Thus, about 12% of GAAP net income is not cash income. This matters for assessing earnings quality: excluding this expense makes profit look higher, but it reflects real personnel costs. The tax rate in the reported quarter was 21.1% of pre-tax income, in line with the usual level.
Operating cash flow of $45.2 million and free cash flow of $41.0 million – cash conversion remains low
Operating cash flow in the third quarter was $45.2 million, free cash flow was $41.0 million. This is significantly less than net income of $57.4 million. The gap is explained by working capital growth: accounts receivable increased to $329.5 million from $183.5 million at the end of the previous fiscal year, and inventories rose to $227.1 million from $160.2 million. This is typical for a rapid growth phase – the company is financing sales expansion.
Capital expenditure remains moderate at $4.3 million for the quarter, about 1.3% of revenue. Major investments in the Advanced Solutions expansion are likely still ahead. Free cash flow of $41.0 million covers dividends but does not yet create a significant buffer for buybacks or large investments.
Leverage is negative: net cash position of $177.2 million, not debt
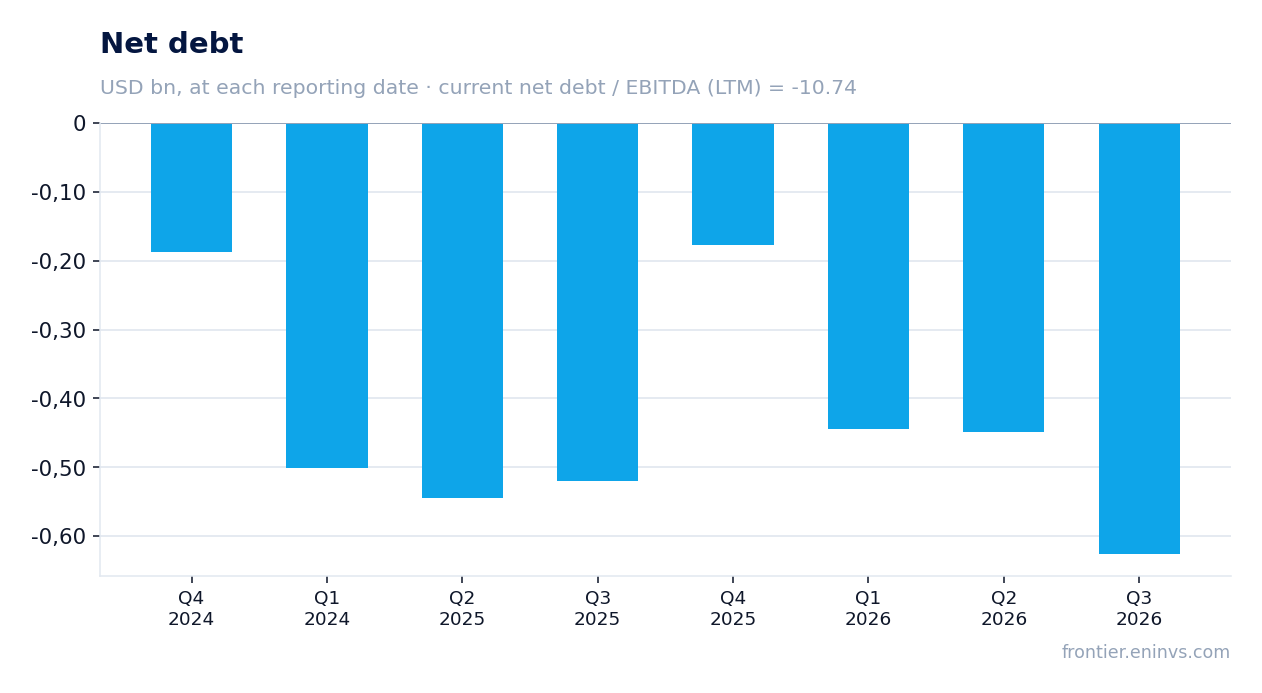
At the end of the reporting period, the company's net debt is negative at minus $177.2 million, meaning it has more cash and short-term investments than debt obligations. This is confirmed by the balance sheet: cash and equivalents of $368.6 million, short-term investments of $148.0 million, with virtually no debt. The net debt to LTM EBITDA ratio is minus 10.74 – a negative value reflecting the net cash position.
Such financial stability gives the company the ability to invest in production expansion and maintain dividends even amid demand volatility. Interest expense is minimal at $34 thousand for the quarter, while interest income was $4.5 million. This provides an additional contribution to profit, though not the main one.
Dividend of $0.205 per share for the quarter – trailing yield of 0.98%, below the key rate
For the third quarter of fiscal 2026, the company paid a dividend of $0.205 per share, unchanged from a year earlier. For the nine months, $0.615 per share was paid. At the current price of $93.85, the annual yield is about 0.98% – below the key rate, making the dividend more of a supplement to the growth story than a primary investment motive.
Our estimate for the current year: if the quarterly dividend of $0.205 is maintained, the annual payout will be $0.82 per share. This corresponds to a payout ratio of about 20% of expected earnings if the company sustains current profitability. However, the dividend is not a priority: the company primarily funds growth, and share buybacks in the reported quarter were minimal – 5.0 thousand shares for $0.5 million.
The portal's model implies 38% upside to fair value, but the LTM EV/EBITDA multiple of 258x reflects the one-off nature of profit
According to the portal's model, the fair value of the share is 38% above the current price. This estimate is based on EBITDA growth and a target multiple. However, the current LTM EV/EBITDA multiple is 258x – an abnormally high value because trailing twelve-month earnings include loss-making quarters. If we take the latest quarter's earnings and annualise them, the forward multiple would be significantly lower.
The company's market capitalisation is $4.44 billion, with a net cash position of $177.2 million. LTM EBITDA was $16.5 million, but in the third quarter alone EBITDA was $72.3 million. This means the market is likely valuing the company based on future earnings, not past ones. Comparison with its own history is difficult due to the absence of a three-year average multiple in the FACTS.
Valuation on the latest reported figures
| Metric | Value |
|---|---|
| Market cap | 4.44 bn USD |
| EV/EBITDA (LTM) | 258.3 |
| P/B | 5.40 |
| Net debt / EBITDA (LTM) | -10.74 |
| Operating cash flow (LTM) | 0.11 bn |
| ROE | 8.7% |
| Dividend yield (12m) | 1.0% |
Bottom line
The third quarter of fiscal 2026 report showed record revenue and a return to profitability. Revenue growth of 122.6% year on year and an EBITDA margin of 21.9% are strong results reflecting a recovery in demand across all end markets. However, profit is not yet fully converting into cash flow, and the dividend yield of 0.98% is low. In our view, the stock looks attractive: the portal's model implies 38% upside, and forward multiples are likely well below historical levels. The key question for a holder is whether the company can sustain the achieved margin level and improve cash conversion in the next quarter.
Open the company's financial profile KLIC →
See also: market overview · valuation map · stock screeners