LATTICE SEMICONDUCTOR CORP: revenue up 62%, but the gap between adjusted and net income is $55 million
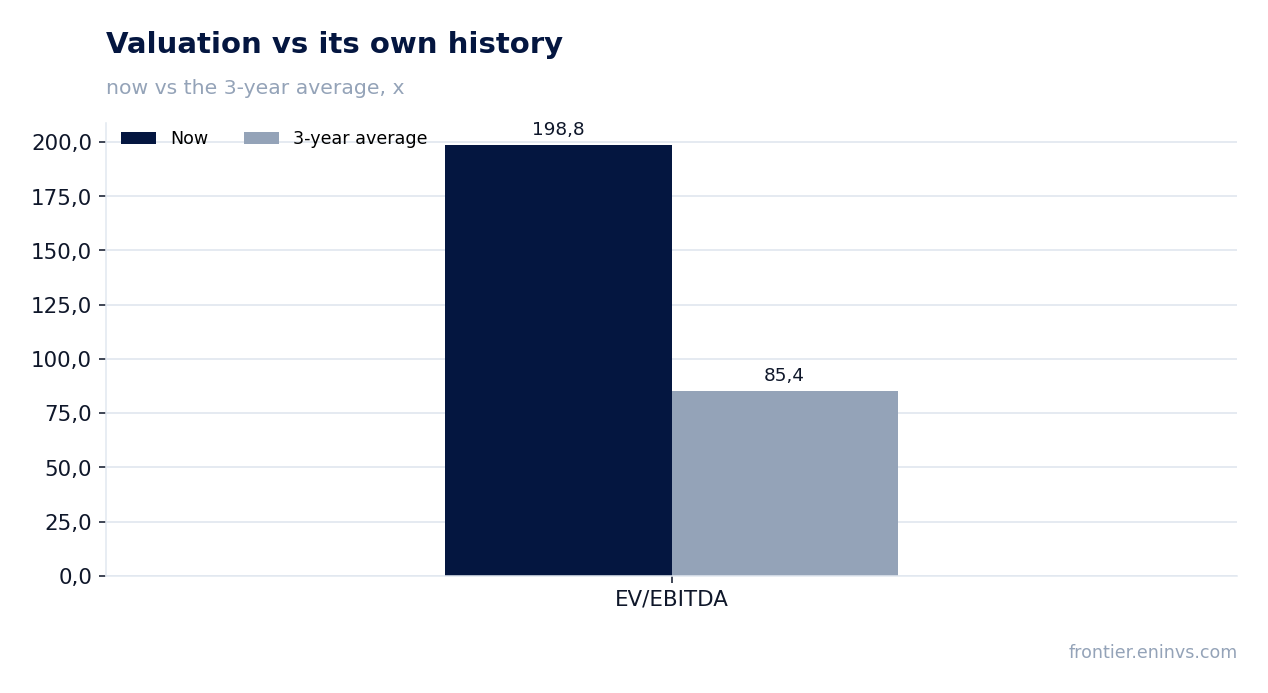
On August 4, LATTICE SEMICONDUCTOR CORP reported results for the second quarter of 2026. Revenue reached a record $201.1 million, up 62.2% year-over-year, adjusted EBITDA rose to $86.4 million with a 43.0% margin, and GAAP net income was $19.4 million. The $67 million gap between adjusted EBITDA and net income is explained primarily by non-cash stock-based compensation of $44.9 million. The stock trades at EV/EBITDA LTM of 198.8 – more than double its own three-year average of 85.4, making the valuation attractive only if current growth rates persist.
Key takeaways
— Revenue grew 62.2% year-over-year to $201.1 million, with 63% coming from Compute and Communications
— Adjusted EBITDA rose to $86.4 million with a 43.0% margin, but GAAP net income was only $19.4 million
— The $67 million gap between adjusted EBITDA and net income is mainly non-cash stock-based compensation of $44.9 million
— Operating cash flow reached $88.3 million and free cash flow $81.3 million, covering both capital expenditures and share repurchases
— Net debt is negative at $167.5 million – more cash than debt – with net debt/EBITDA LTM at minus 1.16
— EV/EBITDA LTM of 198.8 is more than double its own three-year average of 85.4, pricing in continued rapid growth
— The closing of the $1.65 billion AMI acquisition adds more than $200 million in annual revenue but also increases debt load
Attractiveness
Key figures, USD bn
| Metric | Q2 2025 | Q2 2026 | Change |
|---|---|---|---|
| Revenue | 0.12 | 0.20 | +62.2% |
| EBITDA | 0.01 | 0.09 | +1533.6% |
| Operating profit | 0.00 | 0.02 | +375.0% |
| Net profit | 0.00 | 0.02 | +564.6% |
| Operating cash flow | 0.04 | 0.09 | +129.2% |
| Capex | 0.01 | 0.01 | -3.2% |
| EBITDA margin | 4.3% | 43.0% | +38.7 pp |
| Net margin | 2.3% | 9.6% | +7.3 pp |
Revenue grew 62.2% year-over-year to $201.1 million, with 63% coming from Compute and Communications
In the second quarter of 2026, LATTICE SEMICONDUCTOR CORP revenue reached $201.1 million, up 62.2% year-over-year. This is a record quarterly figure for the company. The main contribution came from Compute and Communications, which generated $126.0 million, or 63% of total revenue. A year earlier, this segment accounted for only 55% of revenue, so its share increased by 8 percentage points.
The Industrial and Embedded segment also grew, to $75.1 million from $55.3 million a year earlier. However, its share of revenue declined from 45% to 37%, as Compute and Communications grew much faster. The company attributes revenue growth to strong demand for new products related to artificial intelligence and data centers. Revenue from new products grew more than 60% year-over-year and is expected to exceed 25% of total revenue in 2026.
Geographically, 79% of revenue came from Asia, 12% from the Americas, and 9% from Europe. A year earlier, the distribution was different: Asia accounted for 67%, the Americas 22%, and Europe 11%. The shift toward Asia reflects growing demand from Asian data center equipment manufacturers. Distribution accounted for 95% of revenue versus 84% a year earlier, indicating a shift toward the distribution channel.
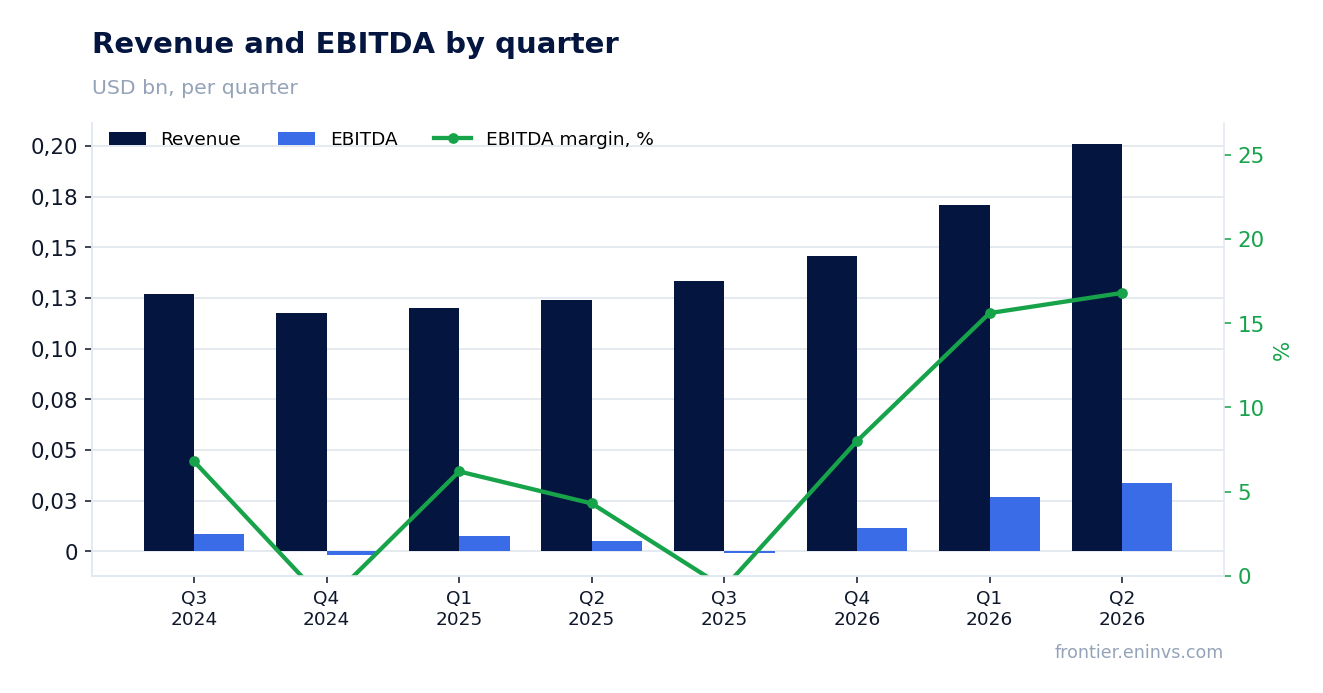
Adjusted EBITDA rose to $86.4 million with a 43.0% margin, but GAAP net income was only $19.4 million
Adjusted EBITDA in the second quarter of 2026 was $86.4 million, with a margin of 43.0%. A year earlier, this figure was $42.2 million with a 34.1% margin. Thus, the margin improved by 8.9 percentage points. However, GAAP net income was much more modest at $19.4 million, or 9.6% of revenue. A year earlier, net income was $2.9 million with a 2.3% margin.
The gap between adjusted EBITDA and net income reaches $67 million. The main reason is non-cash stock-based compensation, which amounted to $44.9 million. Another $5.4 million came from compensation the company intends to settle in shares, and $4.4 million from acquisition-related expenses for AMI. Additionally, $4.9 million was a write-off of unamortized debt costs.
GAAP gross margin rose to 70.3% from 68.4% a year earlier. On an adjusted basis, it was 71.7% versus 69.3%. The margin improvement was driven by revenue growth and a favorable product mix. GAAP operating expenses increased by 48.6% to $119.0 million, due to higher research and development costs as well as acquisition-related expenses. Adjusted operating expenses grew by only 29.5% to $67.1 million.
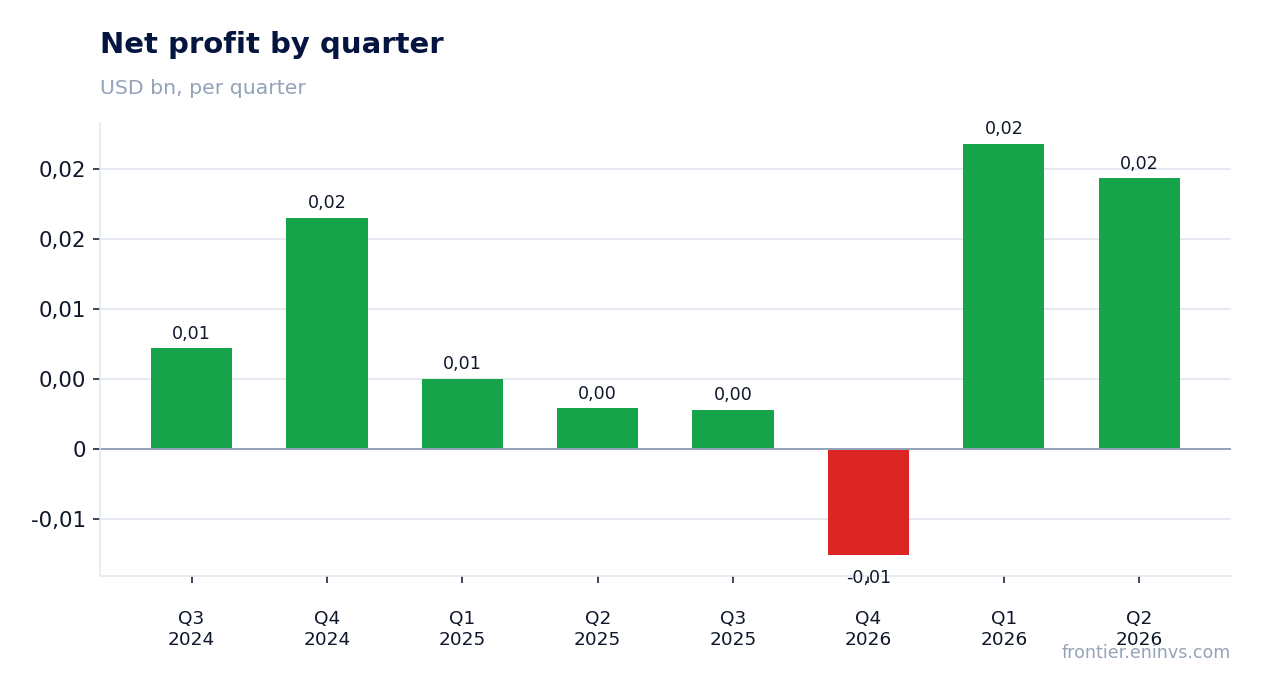
The $67 million gap between adjusted EBITDA and net income is mainly non-cash stock-based compensation of $44.9 million
The key question from the report is why, with adjusted EBITDA of $86.4 million, GAAP net income is only $19.4 million. Of the $67 million difference, $44.9 million consists of stock-based compensation expenses. These expenses are non-cash but dilute existing shareholders. Another $5.4 million is compensation the company plans to settle in shares, which will also lead to dilution.
In addition, $4.4 million was acquisition-related expenses for AMI, and $4.9 million was a write-off of unamortized debt costs. These items are one-off in nature. If all these adjustments are excluded, adjusted net income would be $74.4 million, or $0.53 per diluted share. This is the figure the company presents as non-GAAP.
It is important for the investor to understand that adjusted profit of $74.4 million is almost four times GAAP profit. Such a discrepancy is typical for companies actively using stock-based compensation. However, the sustainability of the business is determined by its ability to generate cash flow, not adjusted profit. In this case, operating cash flow was $88.3 million, confirming the company's ability to generate real money.
Operating cash flow reached $88.3 million and free cash flow $81.3 million, covering both capital expenditures and share repurchases
In the second quarter of 2026, operating cash flow was $88.3 million, up 129% year-over-year. Free cash flow reached $81.3 million with a 40.4% margin. Capital expenditures were small at just $7.0 million, allowing almost the entire operating flow to convert into free cash. For comparison, a year earlier free cash flow was $31.3 million.
The company allocated $15.0 million to share repurchases in the first half of 2026. This is less than the $70.9 million spent on repurchases a year earlier. The company also paid $11.7 million in debt issuance costs related to financing the AMI acquisition. Despite these expenses, the cash balance increased to $173.3 million from $133.9 million at the beginning of the year.
Free cash flow of $81.3 million covers capital expenditures, share repurchases, and debt payments. This indicates a high ability of the business to generate cash. However, it is worth considering that in the third quarter the company expects to close the AMI deal, which could increase debt load and interest expenses. Nevertheless, current cash flow provides a margin of safety for integrating the acquisition.
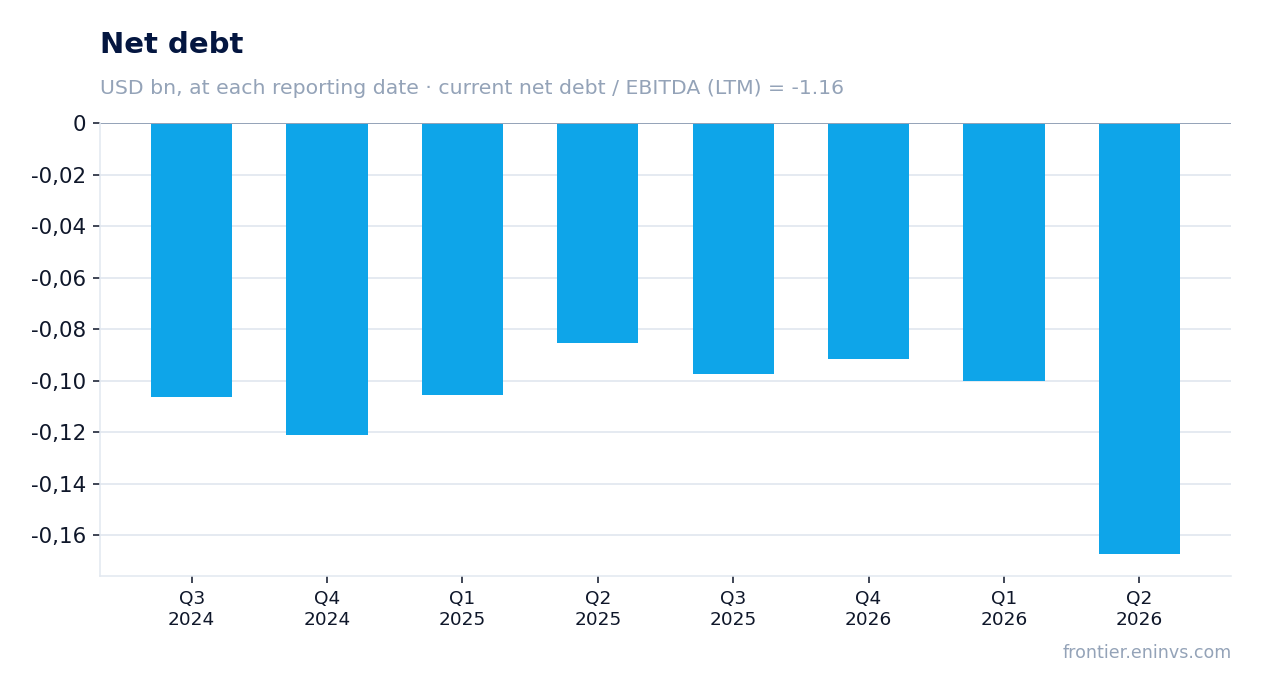
Net debt is negative at $167.5 million – more cash than debt – with net debt/EBITDA LTM at minus 1.16
As of the end of the second quarter of 2026, the company's net debt was minus $167.5 million. A negative value means cash and equivalents exceed debt obligations. The ratio of net debt to EBITDA over the last 12 months is minus 1.16. This is a very comfortable level, giving the company significant financial flexibility.
Over the last 12 months, revenue was $651.1 million, EBITDA was $79.2 million, and operating cash flow was $175.1 million. These figures reflect the scale of the business over the year. Net debt decreased by 0.1 billion rubles over 12 months when converted to rubles, but in dollar terms it remains negative. The company has no significant debt burden, which favorably distinguishes it from many competitors.
However, the closing of the AMI acquisition for $1.65 billion, of which about $1 billion was paid in cash, could change the balance sheet structure. The company has already incurred $11.7 million in debt issuance costs. In the third quarter of 2026, an increase in debt load is expected, which could lead to a positive net debt value. Nevertheless, the current debt level is not a concern.
EV/EBITDA LTM of 198.8 is more than double its own three-year average of 85.4, pricing in continued rapid growth
The market capitalization of LATTICE SEMICONDUCTOR CORP at the time of the report is $15.8 billion. The EV/EBITDA ratio for the last 12 months is 198.8. Its own three-year average for this multiple is 85.4. Thus, the current valuation is more than double the historical level. This means the market is pricing in the continuation of exceptionally high profit growth rates.
For comparison, over the previous three years, the average multiple was 85.4, which already implied a premium to the market. Now the premium has doubled. Investors expect revenue growth of 62% year-over-year to continue in the coming quarters. The company forecasts FPGA revenue growth of 65% year-over-year in the third quarter of 2026, confirming these expectations. However, any slowdown in growth could lead to a significant correction in the multiple.
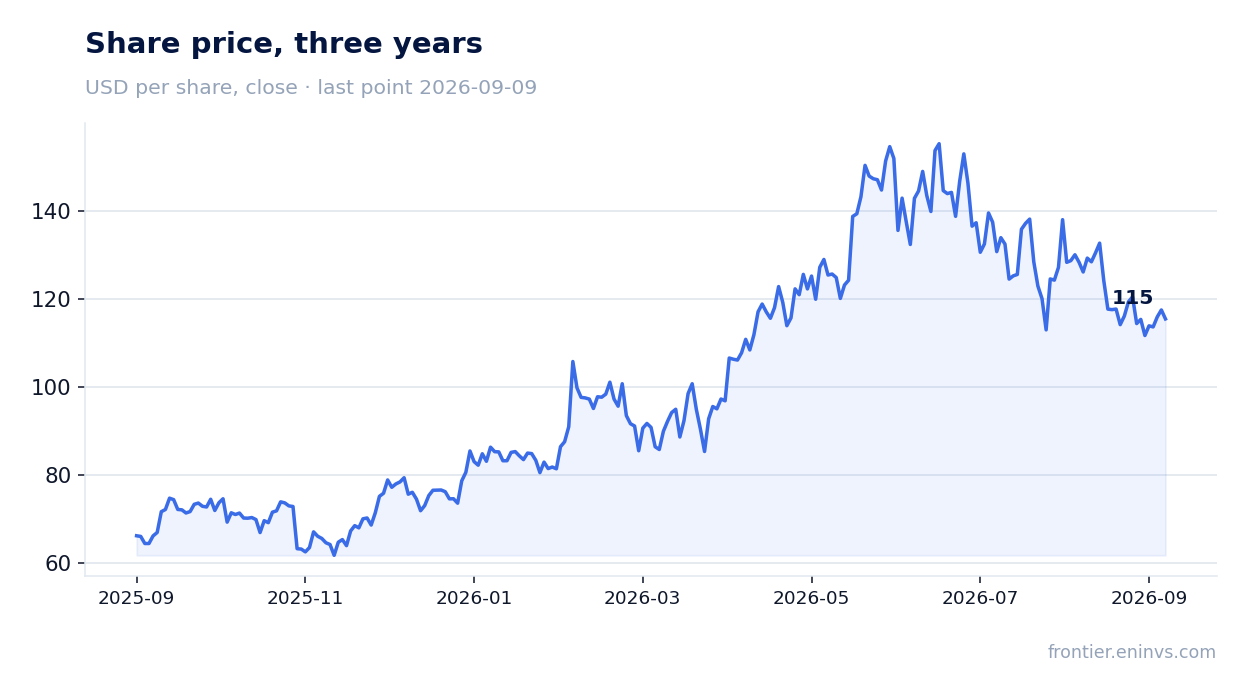
According to the portal's model, the fair value of the share implies an upside of only 2% from the current price. This means the current valuation already largely reflects future growth. For further capitalization growth, the company needs not only to maintain current rates but also to exceed market expectations. At the same time, EV/EBITDA of 198.8 leaves no room for error.
The closing of the $1.65 billion AMI acquisition adds more than $200 million in annual revenue but also increases debt load
On July 27, 2026, LATTICE SEMICONDUCTOR CORP completed the acquisition of AMI for $1.65 billion. The deal includes approximately $1 billion in cash and $650 million in Lattice stock. The acquisition is expected to be accretive to gross margin, EBITDA, free cash flow, and earnings per share on an adjusted basis. AMI is expected to generate more than $200 million in revenue in calendar 2026 with a gross margin above 75% by year-end and an EBITDA margin of about 40%.
The deal expands Lattice's presence in the market for management and control solutions in data centers and physical AI. AMI will operate as a separate business unit led by its longtime CEO Sanjoy Maity, who will report directly to Lattice CEO Ford Tamer. The company emphasizes AMI's commitment to neutrality, which is important for maintaining relationships with hyperscalers and equipment manufacturers.
In the third quarter of 2026, Lattice expects revenue in the range of $245 to $265 million, including approximately two months of AMI contribution. Excluding AMI, FPGA revenue is forecast at $210 to $230 million, implying 65% year-over-year growth. This should bring the company to an annual revenue run rate of more than $1 billion. However, integrating the acquisition may require additional expenses and increase debt load.
Valuation on the latest reported figures
| Metric | Value |
|---|---|
| Market cap | 15.8 bn USD |
| EV/EBITDA (LTM) | 198.8 |
| P/B | 22.17 |
| Net debt / EBITDA (LTM) | -1.16 |
| Operating cash flow (LTM) | 0.18 bn |
| ROE | 10.1% |
| EV/EBITDA, 3-year average | 85.4 |
Bottom line
LATTICE SEMICONDUCTOR CORP delivered a strong quarter: revenue grew 62.2% to a record $201.1 million, adjusted EBITDA rose to $86.4 million with a 43.0% margin, and free cash flow was $81.3 million. However, GAAP net income was only $19.4 million, and the $67 million gap with EBITDA is mainly explained by non-cash stock-based compensation. The valuation remains extremely high: EV/EBITDA LTM of 198.8 versus its own three-year average of 85.4. According to the portal's model, the upside for the share is only 2%, suggesting the market has already priced in continued rapid growth. To justify the current valuation, the company must not only meet its third-quarter guidance but also demonstrate sustainable growth after integrating AMI.
Open the company's financial profile LSCC →
See also: market overview · valuation map · stock screeners