Mastercard Inc: revenue grows 14%, but the market already prices it at 31 times earnings

30 июля Mastercard Inc раскрыла результаты за второй квартал 2026 года: выручка выросла на 14,1% до 9,3 млрд долларов, чистая прибыль – на 18,6% до 4,4 млрд. Акции отреагировали ростом на 2,5% в день публикации и ещё на 2,8% к 4 сентября. При текущей цене бумага торгуется с мультипликатором P/E 31,2 против средней за три года EV/EBITDA 27,1 – оценка остаётся высокой, поэтому акция выглядит скорее привлекательной, чем безусловно дешёвой.
Key takeaways
— Q2 2026 revenue grew 14.1% to $9.3 billion, but currency-neutral growth is lower at 12%
— EBITDA margin in Q2 reached 63.6% versus 62.2% a year earlier
— Q2 2026 net profit grew 18.6% to $4.4 billion, outpacing revenue
— Leverage: net debt / EBITDA for the last twelve months is 0.43
— Capex in Q2 rose to $291 million, but operating cash flow covers it with a cushion
— Shares rose 2.5% on the release day and another 2.8% by September 4
— On the portal's model, upside to fair value is 12%
Attractiveness
Key figures, USD bn
| Metric | Q2 2025 | Q2 2026 | Change |
|---|---|---|---|
| Revenue | 8.13 | 9.28 | +14.1% |
| EBITDA | 5.06 | 5.90 | +16.6% |
| Operating profit | 4.78 | 5.59 | +17.0% |
| Net profit | 3.70 | 4.39 | +18.6% |
| Operating cash flow | 4.60 | 3.77 | -18.0% |
| Capex | 0.04 | 0.29 | +627.5% |
| EBITDA margin | 62.2% | 63.6% | +1.4 pp |
| Net margin | 45.5% | 47.3% | +1.8 pp |
Q2 2026 revenue grew 14.1% to $9.3 billion, but currency-neutral growth is lower at 12%
In Q2 2026, Mastercard Inc's revenue reached $9.3 billion, up 14.1% year-over-year. The company highlights that on a currency-neutral basis growth would have been 12% – meaning about two percentage points of growth came from a weaker dollar.
The core driver remains the payments business: gross dollar volume grew 8% in local currency, cross-border volumes rose 12%, and switched transactions increased 9%. Value-added services and solutions grew faster – 20% as reported and 18% currency-neutral – confirming the strategy of diversifying beyond classic processing.
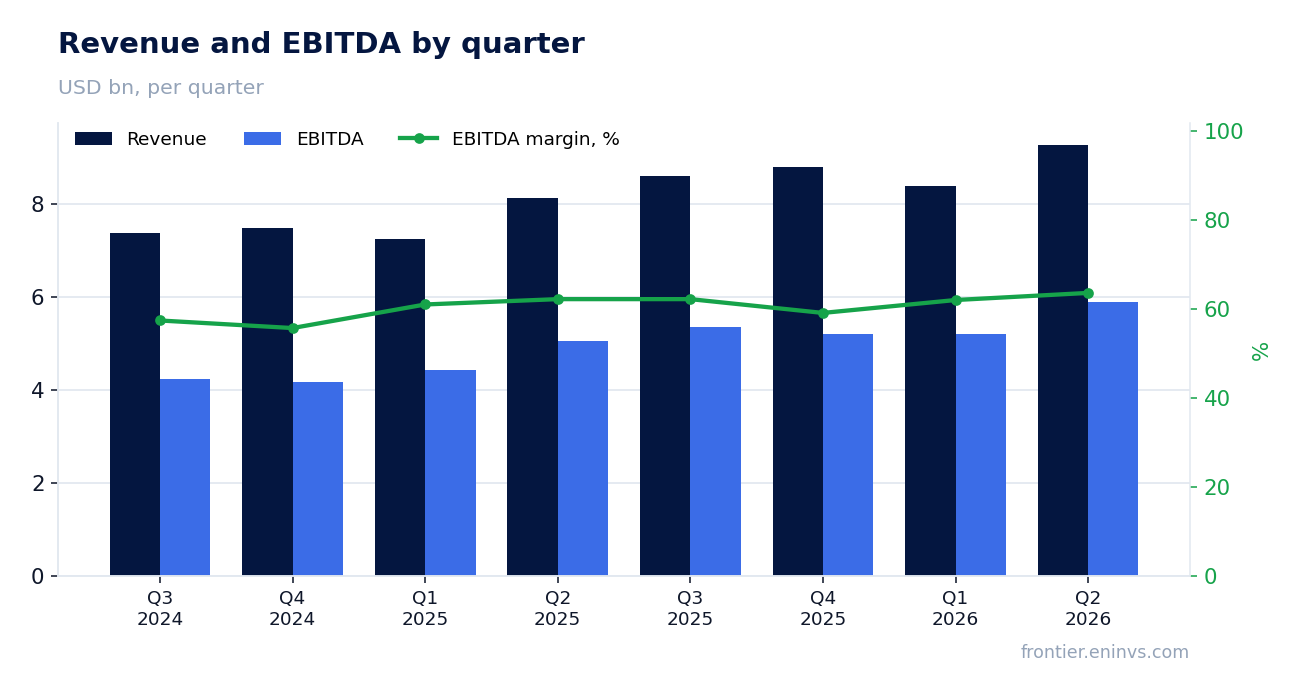
EBITDA margin in Q2 reached 63.6% versus 62.2% a year earlier
EBITDA margin in Q2 2026 reached 63.6% versus 62.2% in the same quarter of 2025. Operating expenses grew only 10% while revenue rose 14.1%, driving margin expansion.
The company notes that operating expense growth was mainly due to higher general and administrative costs. However, operating expenses included one-off items – litigation provisions of $82 million – which somewhat tempered margin improvement.
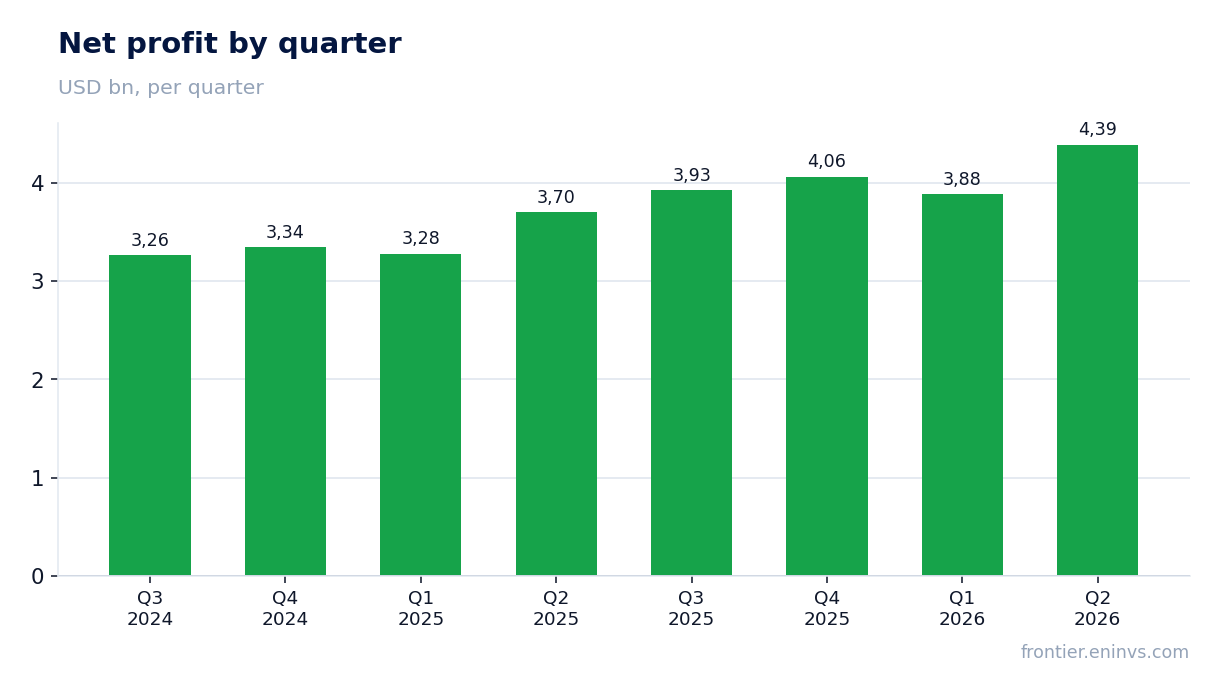
Q2 2026 net profit grew 18.6% to $4.4 billion, outpacing revenue
Net profit for Q2 2026 reached $4.4 billion, up 18.6% year-over-year. Profit growth outpaced revenue thanks to operating leverage and a lower effective tax rate – 20.0% versus 20.8%.
Adjusted net income, excluding one-off items and investment revaluation, grew 18% to $4.5 billion. The gap between reported and adjusted profit is small, indicating high quality of results.
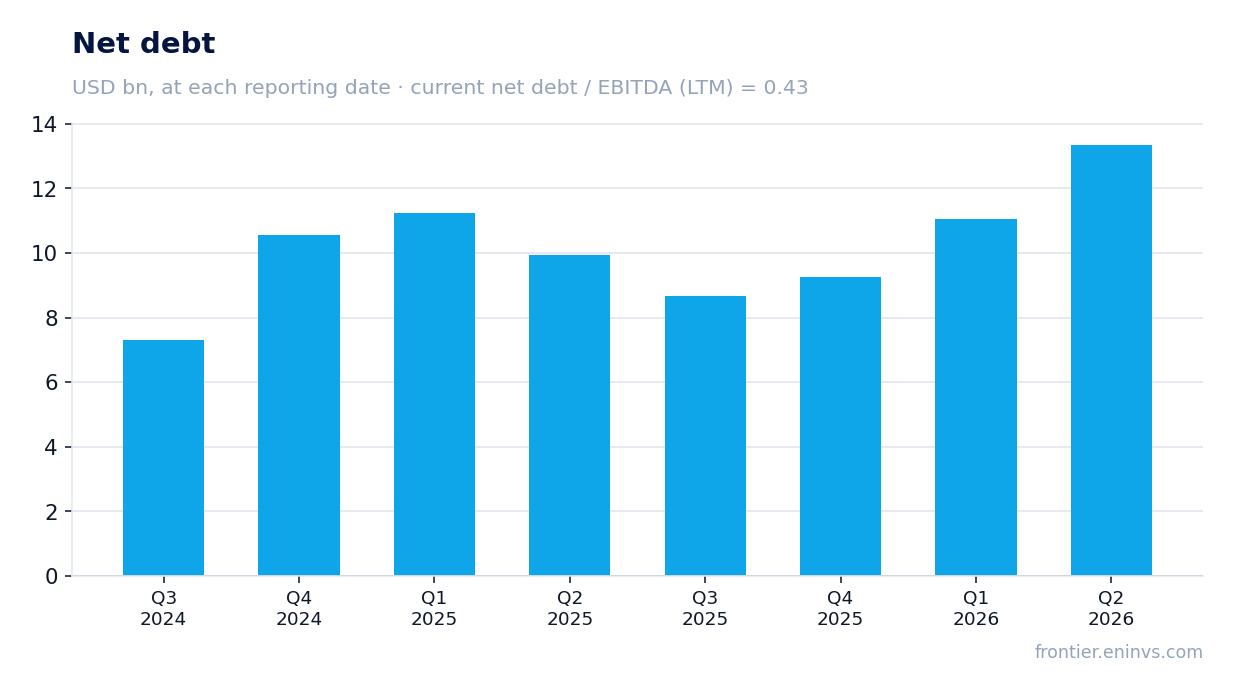
Leverage: net debt / EBITDA for the last twelve months is 0.43
As of the end of Q2 2026, Mastercard Inc's net debt stood at $13.4 billion, up $2.3 billion from the previous reporting date and $3.4 billion over the last twelve months. The increase is related to active share buybacks – in Q2 alone the company spent $4.9 billion on repurchases.
Net debt to EBITDA for the last twelve months is 0.43 – a low level that does not constrain financial flexibility. The company retains the ability to increase shareholder returns and invest in growth.
Capex in Q2 rose to $291 million, but operating cash flow covers it with a cushion
In Q2 2026, Mastercard Inc's capital expenditures reached $291 million versus $40 million a year earlier – the company increased investments in technology and infrastructure. Operating cash flow for the quarter was $3.8 billion, covering capex many times over.
Over the last twelve months, operating cash flow reached $17.6 billion. Even with higher capex, free cash flow remains substantial, providing resources for dividends and buybacks.
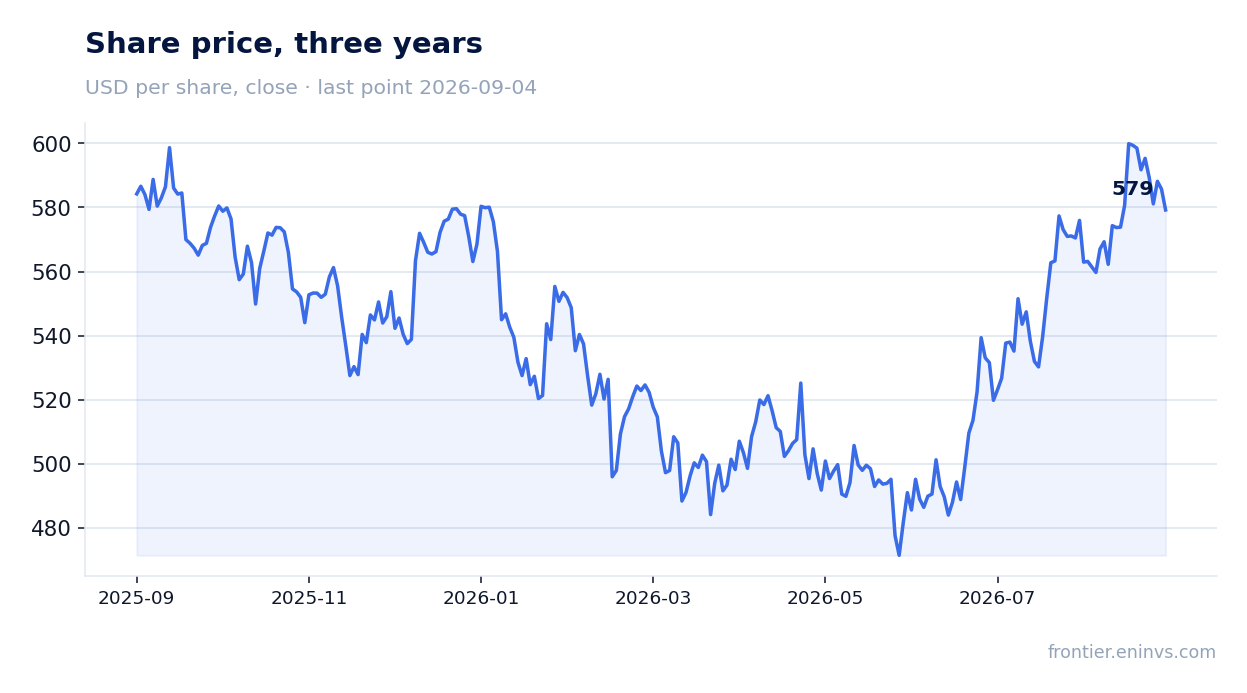
Shares rose 2.5% on the release day and another 2.8% by September 4
The closing price before the release was $563.32. On the release day, shares gained 2.5%, and by September 4 – another 2.8%. The market reacted positively, though the move was moderate – investors had already priced in high growth rates.
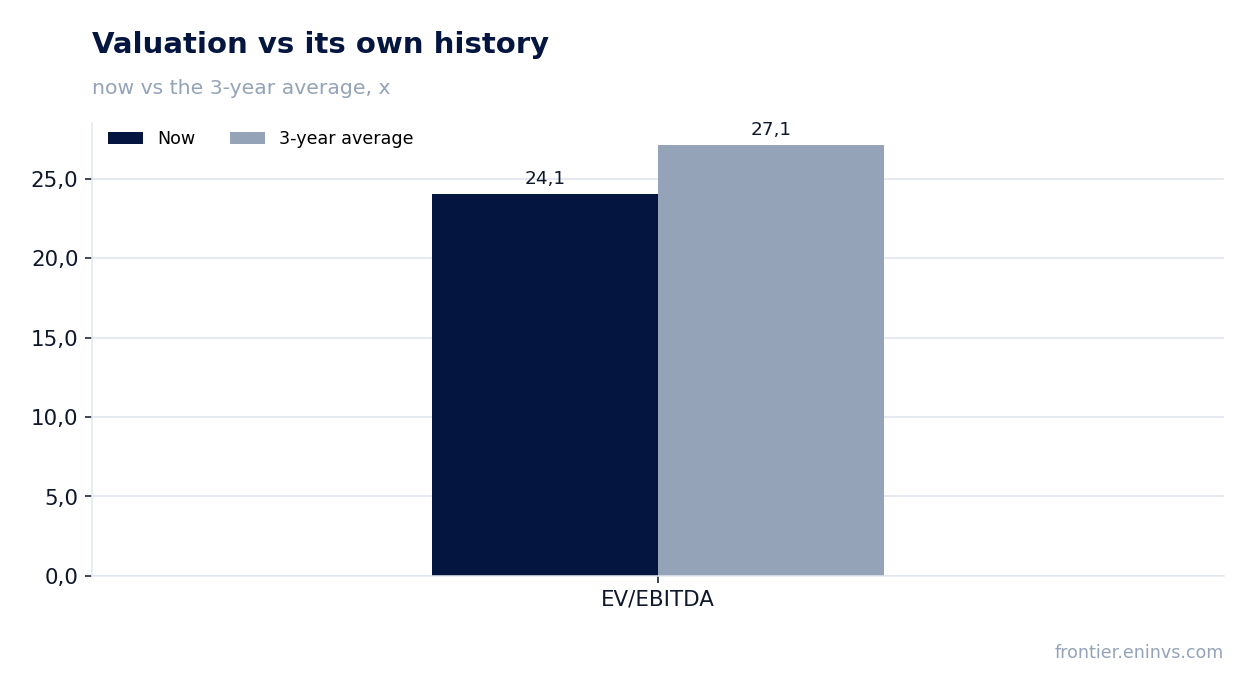
Current market capitalization is $507.8 billion. At this valuation, shares trade at a P/E of 31.2 for the last twelve months, notably above the three-year average EV/EBITDA of 27.1 – the market continues to pay a premium for quality and stability.
On the portal's model, upside to fair value is 12%
Our value-creation model, based on EBITDA growth and a target multiple, estimates the share's upside to fair value at 12% from the current price. This is a moderate upside that does not imply significant re-rating.
The share is held in our model strategies 'US Financials (banks)' and 'US GARP + acceleration' – this reflects meeting fundamental selection criteria but is not a standalone reason to buy.
Valuation on the latest reported figures
| Metric | Value |
|---|---|
| Market cap | 508 bn USD |
| P/E (LTM) | 31.2 |
| EV/EBITDA (LTM) | 24.1 |
| Net debt / EBITDA (LTM) | 0.43 |
| Operating cash flow (LTM) | 17.6 bn |
| ROE | 214.7% |
| Dividend yield (12m) | 0.6% |
| EV/EBITDA, 3-year average | 27.1 |
Bottom line
Mastercard Inc продолжает показывать сильные результаты: выручка растёт двузначными темпами, маржа расширяется, а долговая нагрузка остаётся низкой. Однако рынок уже оценивает эти достижения – акции торгуются с P/E 31,2, что выше среднего исторического уровня. При этом по модели портала потенциал роста до справедливой стоимости составляет 12%, что делает бумагу скорее привлекательной, чем безусловно дешёвой. Ключевой вопрос для держателя – сможет ли компания сохранить двузначные темпы роста в условиях замедления экономики, и не приведёт ли регуляторика к сжатию маржи.
Open the company's financial profile MA →
See also: market overview · valuation map · stock screeners