MCDONALDS CORP: revenue grows, but EBITDA margin slips to 48.6% – and that is with comparable sales slowing

4 августа MCDONALDS CORP раскрыла результаты за второй квартал 2026 года. Выручка выросла на 3,7% год к году, до 7 099 млн долл., чистая прибыль – на 4,8%, до 2 362 млн долл., но EBITDA-маржа упала с 55,2% до 48,6% из-за роста расходов на реструктуризацию и SG&A. При текущей цене акция выглядит скорее непривлекательно: мультипликаторы выше собственной трёхлетней истории, а модель портала даёт минус 8% к справедливой стоимости.
Key takeaways
— Revenue grew 3.7% in Q2, but comparable sales slowed to 1.3%
— EBITDA margin fell to 48.6% from 55.2% a year earlier – restructuring and higher SG&A took a toll
— Net profit rose 4.8%, but operating income was up only 3.3%
— Leverage remains high: net debt of $43.1 billion, or 3.09x trailing EBITDA
— Capex rose to $831 million in the quarter, but free cash flow stayed positive
— Dividends of $1.3 billion and buybacks of $858 million in the quarter
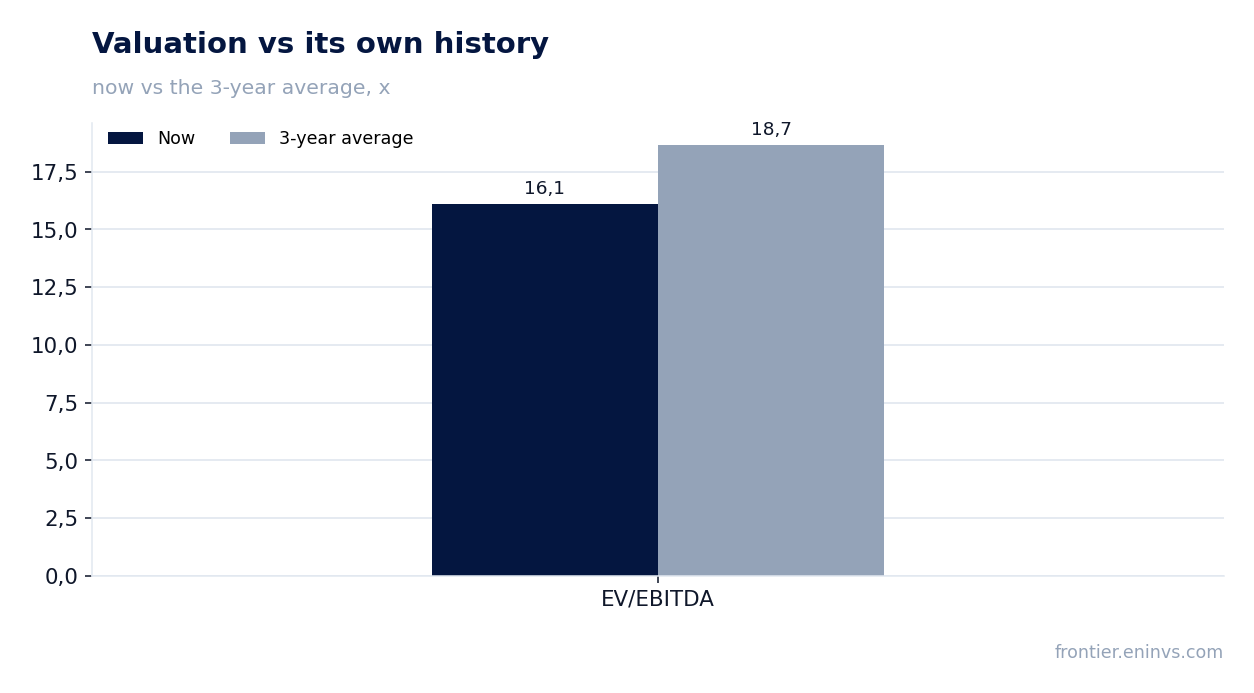
— Shares trade at a premium to their own history: EV/EBITDA of 16.1x vs. 18.7x three-year average
Attractiveness
Key figures, USD bn
| Metric | Q2 2025 | Q2 2026 | Change |
|---|---|---|---|
| Revenue | 6.84 | 7.10 | +3.7% |
| EBITDA | 3.78 | 3.45 | -8.7% |
| Operating profit | 3.23 | 3.34 | +3.3% |
| Net profit | 2.25 | 2.36 | +4.8% |
| Operating cash flow | 2.00 | 2.81 | +40.5% |
| Capex | 0.74 | 0.83 | +11.7% |
| EBITDA margin | 55.2% | 48.6% | -6.6 pp |
| Net margin | 32.9% | 33.3% | +0.4 pp |
Revenue grew 3.7% in Q2, but comparable sales slowed to 1.3%
In Q2 2026, MCDONALDS CORP revenue reached $7,099 million, up 3.7% year-over-year. Growth was driven by franchised revenues (+4% to $4,393 million) and company-owned sales (+3% to $2,525 million). Currency translation added $116 million to revenue.
However, the key metric – comparable sales – slowed to 1.3% company-wide versus 3.8% a year earlier. In the US, growth was just 0.8%, in International Operated Markets 1.5%, and in International Developmental Licensed Markets 1.9%. This suggests organic demand is weakening, and the company is increasingly relying on new restaurant openings and currency translation.
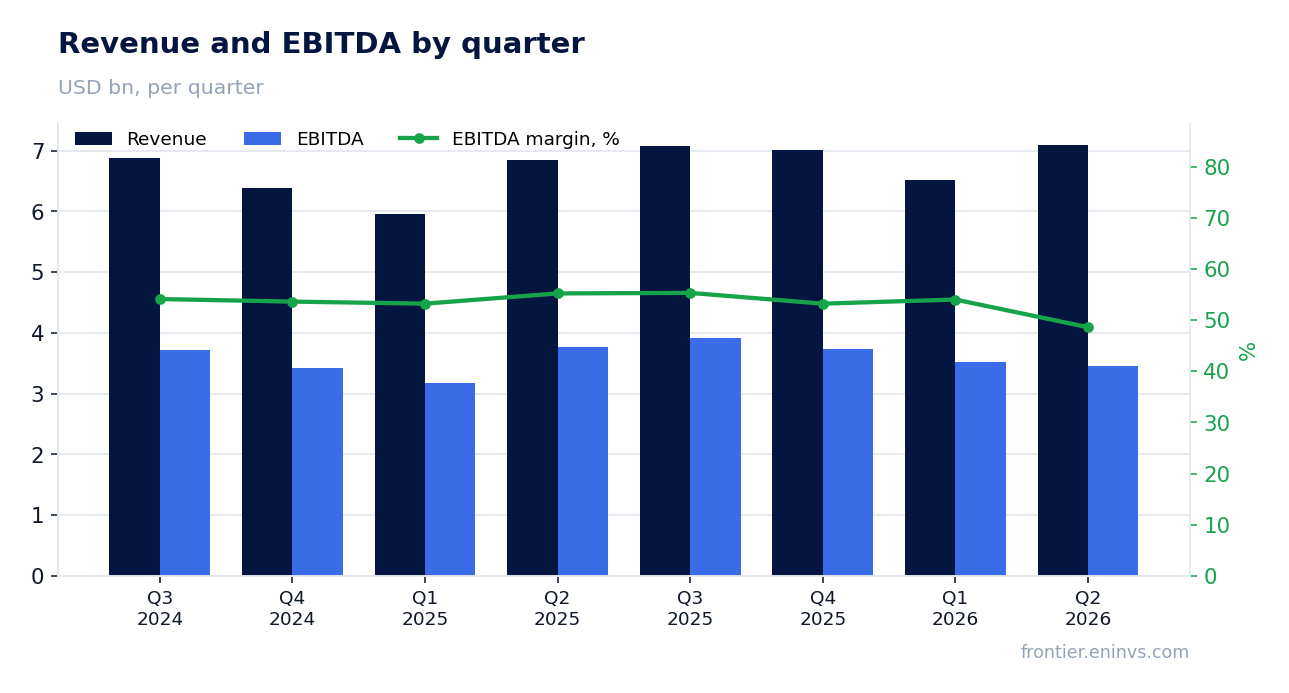
EBITDA margin fell to 48.6% from 55.2% a year earlier – restructuring and higher SG&A took a toll
EBITDA for the quarter was $3,449 million, down 8.7% year-over-year. EBITDA margin fell to 48.6% from 55.2% – a significant decline. The reasons are restructuring charges under the Accelerating the Organization program ($52 million in the quarter) and a sharp 17% increase in SG&A to $817 million, driven by higher employee costs and the worldwide owner/operator convention.
Operating income rose only 3.3% to $3,338 million, notably slower than revenue. Excluding one-off items, operating margin would have been 46.9% versus 46.8% a year earlier – that is, underlying profitability was virtually unchanged, and the EBITDA margin decline is largely due to one-off factors.
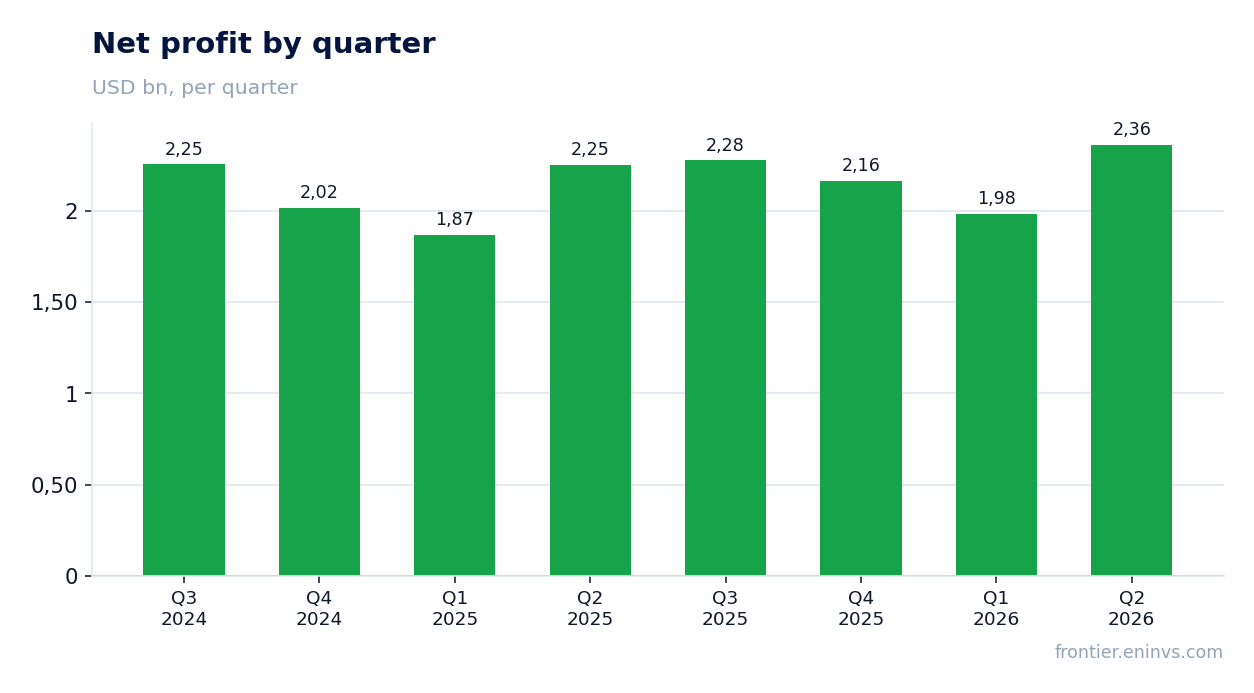
Net profit rose 4.8%, but operating income was up only 3.3%
Net profit for the quarter was $2,362 million (+4.8% year-over-year), with EPS of $3.32 (+6%). Profit growth outpaced operating income due to a lower effective tax rate of 19.5% versus 21.3% – helped by one-off tax benefits related to restructuring.
Excluding one-off items, net profit would have grown 5% – roughly the same pace. Thus, earnings quality is good, but operating dynamics are weak: growth is driven by franchised revenues and other operating income, while company-owned restaurants in the US face inflationary pressures.
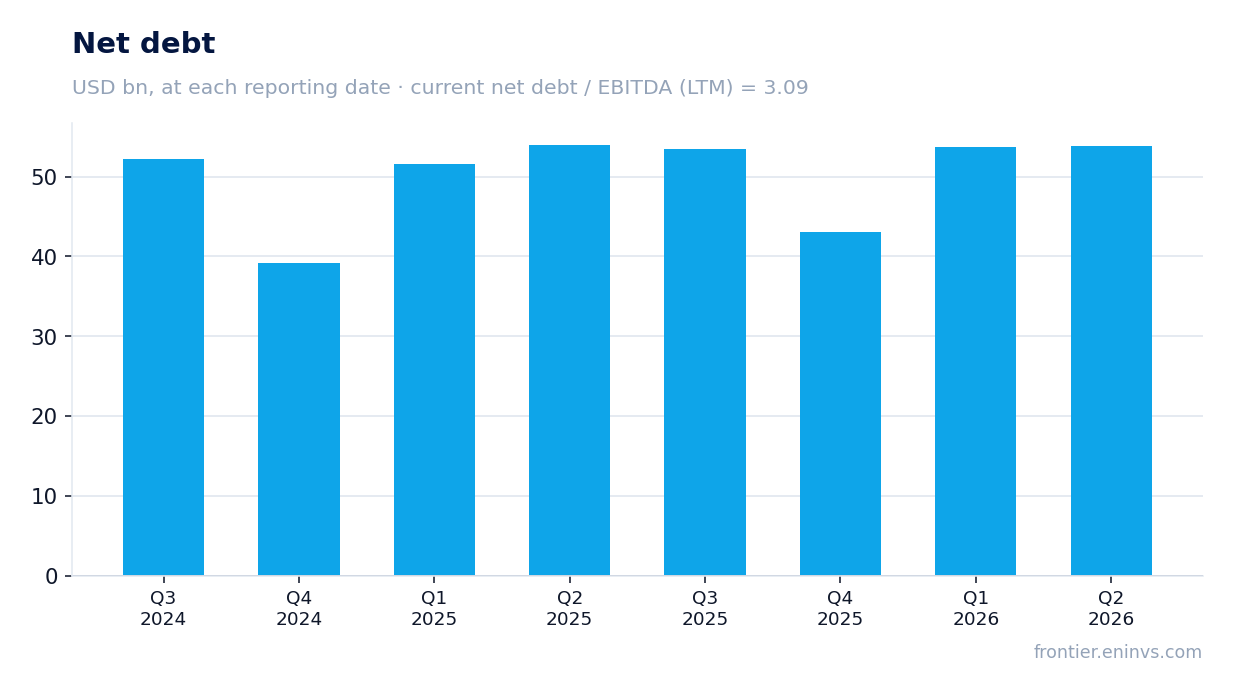
Leverage remains high: net debt of $43.1 billion, or 3.09x trailing EBITDA
At the end of Q2, net debt stood at $43,074 million, equivalent to 3.09x trailing twelve-month EBITDA. Debt rose by $0.1 billion in the quarter and fell by $0.2 billion over the year. The 3.09x level is higher than typical for A-rated issuers and reflects an aggressive capital return policy.
Interest expense rose 5% in the quarter due to higher average rates. The company expects full-year 2026 interest expense to increase by 4–6%. At this level of debt and rates, debt service will pressure free cash flow.
Capex rose to $831 million in the quarter, but free cash flow stayed positive
Operating cash flow for the quarter was $2,807 million, and capex was $831 million. Free cash flow, therefore, was around $2 billion for the quarter. Over the last twelve months, operating cash flow reached $10,600 million, covering both investments and dividends.
The company expects 2026 capital expenditures of $3.7–3.9 billion, with the majority directed to new restaurant openings. It plans to open about 2,600 restaurants in 2026, of which roughly 750 in the US and International Operated Markets. This supports revenue growth but requires significant investment.
Dividends of $1.3 billion and buybacks of $858 million in the quarter
In the quarter, the company paid dividends of $1.86 per share, or $1.3 billion, and repurchased 3.0 million shares for $858 million. In the first half, total shareholder distributions were $2.6 billion in dividends and $1.3 billion in buybacks.
The trailing twelve-month dividend yield is 2.9%, moderate for the sector. With free cash flow of about $2 billion per quarter, the company can afford such payments, but leverage remains high, and further increases in distributions will be limited.
Shares trade at a premium to their own history: EV/EBITDA of 16.1x vs. 18.7x three-year average
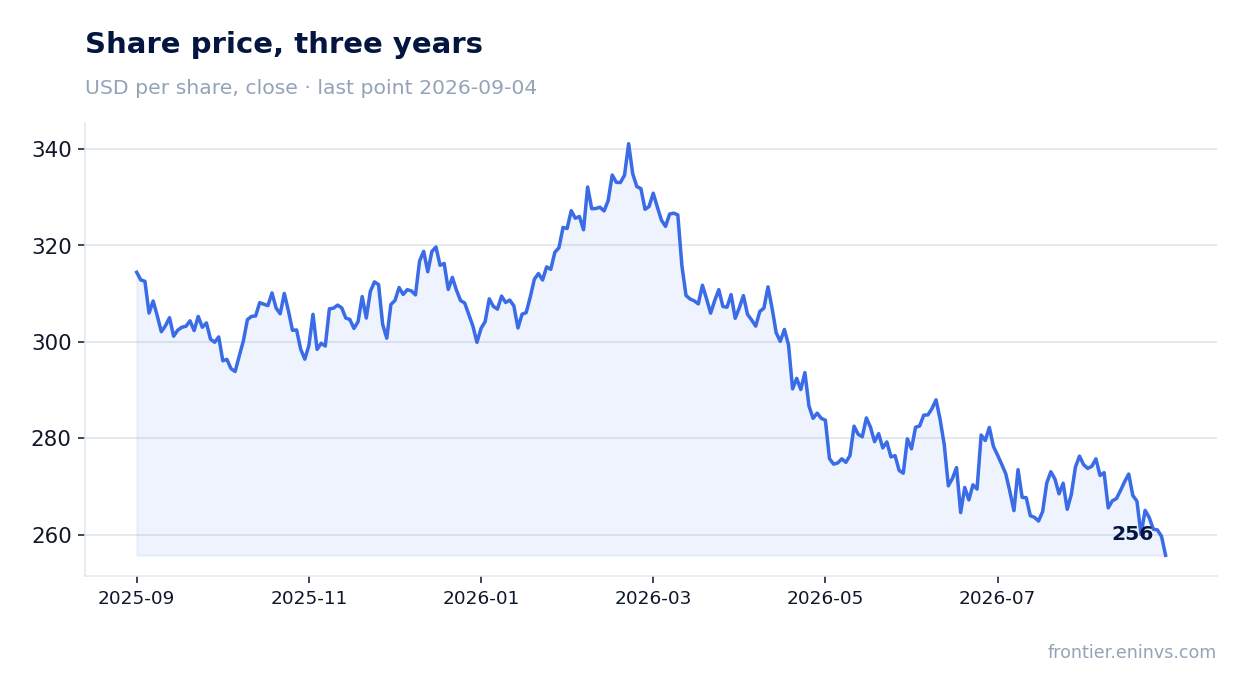
The current EV/EBITDA multiple is 16.1x versus the three-year average of 18.7x – that is, shares are cheaper than their own three-year average. P/E LTM is 20.7x. However, the portal's model puts the upside to fair value at -8%, suggesting the valuation is stretched relative to fundamentals.
Slowing comparable sales and falling EBITDA margin could justify a lower multiple. If the company cannot accelerate organic growth, the current valuation looks rich. The key question is whether MCDONALDS CORP can restore margins and bring comparable sales growth back above 3%.
Valuation on the latest reported figures
| Metric | Value |
|---|---|
| Market cap | 182 bn USD |
| P/E (LTM) | 20.7 |
| EV/EBITDA (LTM) | 16.1 |
| Net debt / EBITDA (LTM) | 3.09 |
| Operating cash flow (LTM) | 10.6 bn |
| ROE | -123.4% |
| Dividend yield (12m) | 2.9% |
| EV/EBITDA, 3-year average | 18.7 |
Bottom line
In Q2 2026, MCDONALDS CORP showed moderate revenue and net profit growth, but the quality of that growth raises questions: comparable sales slowed to 1.3%, and EBITDA margin fell 6.6 percentage points due to one-off charges and higher SG&A. Excluding one-off items, operating margin was virtually unchanged, indicating stability in the underlying business but no improvement. Leverage remains high, and free cash flow barely covers dividends and buybacks. At the current price, the share looks rather unattractive: the portal's model gives -8% to fair value, and organic growth is weakening. A change in assessment would require either comparable sales growth above 3% or a reduction in debt and margin recovery.
Open the company's financial profile MCD →
See also: market overview · valuation map · stock screeners