Meta Platforms, Inc.: revenue up 28%, but costs eat the profit — and this is not a one-off
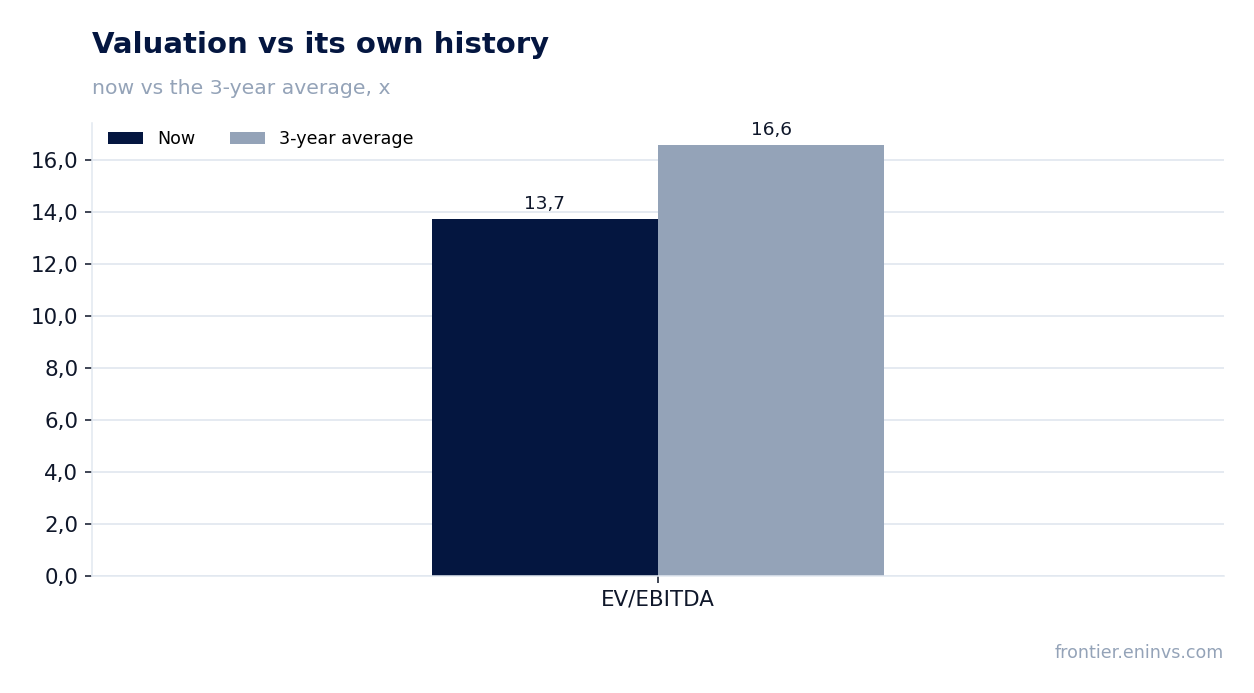
29 июля Meta Platforms, Inc. раскрыла результаты за второй квартал 2026 года. Выручка выросла на 28% год к году до 60,8 млрд долл., однако операционная прибыль снизилась на 8% из-за скачка расходов на 55%, включая 2,4 млрд долл. юридических отчислений и 1,18 млрд долл. на сокращение штата. Чистая прибыль упала на 13,6% до 15,8 млрд долл., а свободный денежный поток составил лишь 784 млн долл. из-за резкого роста капитальных затрат. При текущей цене акция выглядит скорее привлекательной: рост выручки остаётся высоким, а мультипликатор EV/EBITDA 13,7 ниже собственного трёхлетнего среднего 16,6, хотя давление на маржу и денежный поток требует осторожности.
Key takeaways
— Revenue +28% — record quarter, but growth decelerates from peak 33%
— Operating profit fell 8% due to 55% cost surge
— Net profit -13.6%: legal charges and headcount reduction ate growth
— Free cash flow collapsed to $784 million due to $30 billion capex
— Debt rose, but net debt is negative: financial cushion remains
— EV/EBITDA 13.7 — below its own three-year average of 16.6
— Dividends and buyback: shareholder returns shrink, but payments continue
Attractiveness
Key figures, USD bn
| Metric | Q2 2025 | Q2 2026 | Change |
|---|---|---|---|
| Revenue | 47.5 | 60.8 | +28.0% |
| EBITDA | 24.8 | 25.9 | +4.5% |
| Operating profit | 20.4 | 18.8 | -8.2% |
| Net profit | 18.3 | 15.8 | -13.6% |
| Operating cash flow | 25.6 | 31.9 | +24.7% |
| Capex | 16.5 | 30.1 | +82.1% |
| EBITDA margin | 52.2% | 42.6% | -9.6 pp |
| Net margin | 38.6% | 26.1% | -12.5 pp |
Revenue +28% — record quarter, but growth decelerates from peak 33%
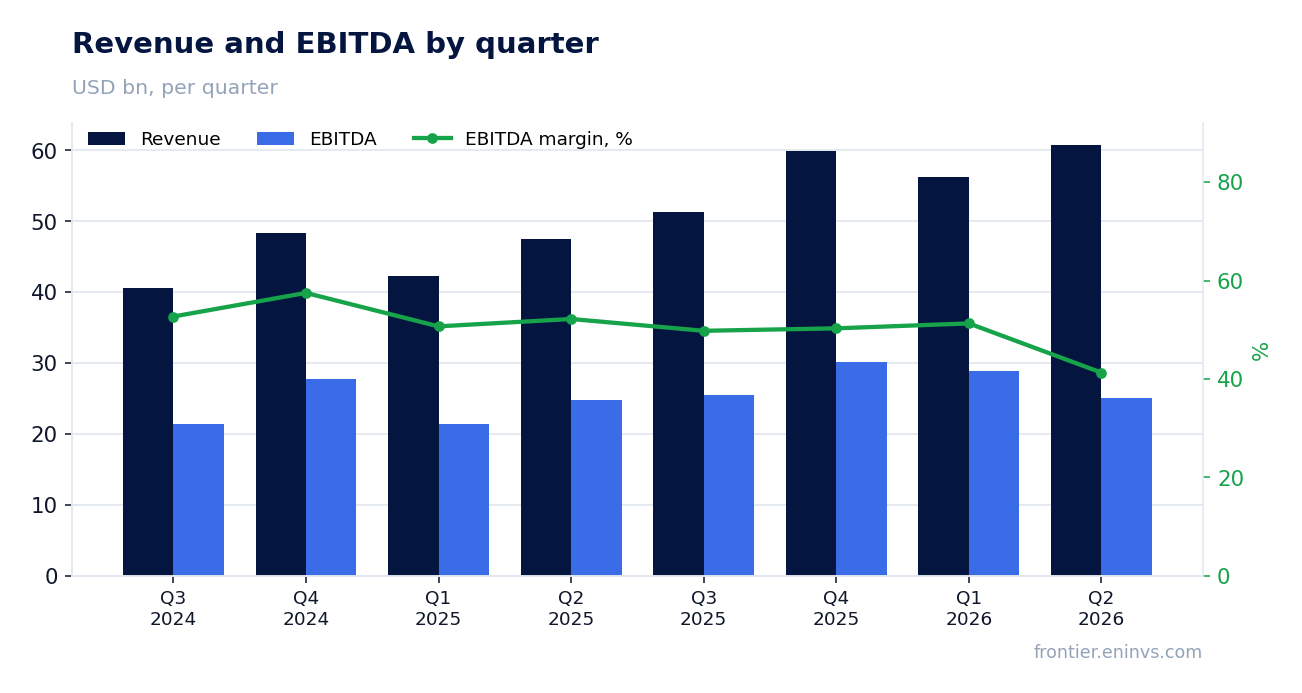
In Q2 2026, Meta Platforms, Inc. revenue reached $60.8 billion, up 28% year-over-year. This is the highest quarterly figure in the company's history, but growth decelerated compared to Q1 2026, when revenue rose 33.1%.
The main driver remains advertising: revenue from ads was $59.4 billion, up 27% year-over-year. Ad impressions grew 14% and average price per ad rose 12%, indicating sustained demand from advertisers. On a constant currency basis, revenue growth would have been 27%, meaning exchange rates had little impact.
Operating profit fell 8% due to 55% cost surge
Operating profit in Q2 was $18.8 billion, down 8% year-over-year. The reason is a sharp increase in costs: expenses rose 55% to $42.0 billion, far outpacing revenue growth.
The main contributor to cost growth was R&D: it rose from $12.9 billion to $21.7 billion, up 67%. This reflects massive investments in artificial intelligence that the company continues to scale. Operating margin contracted from 43% to 31% — pressure on profitability is becoming structural, not one-off.
Net profit -13.6%: legal charges and headcount reduction ate growth
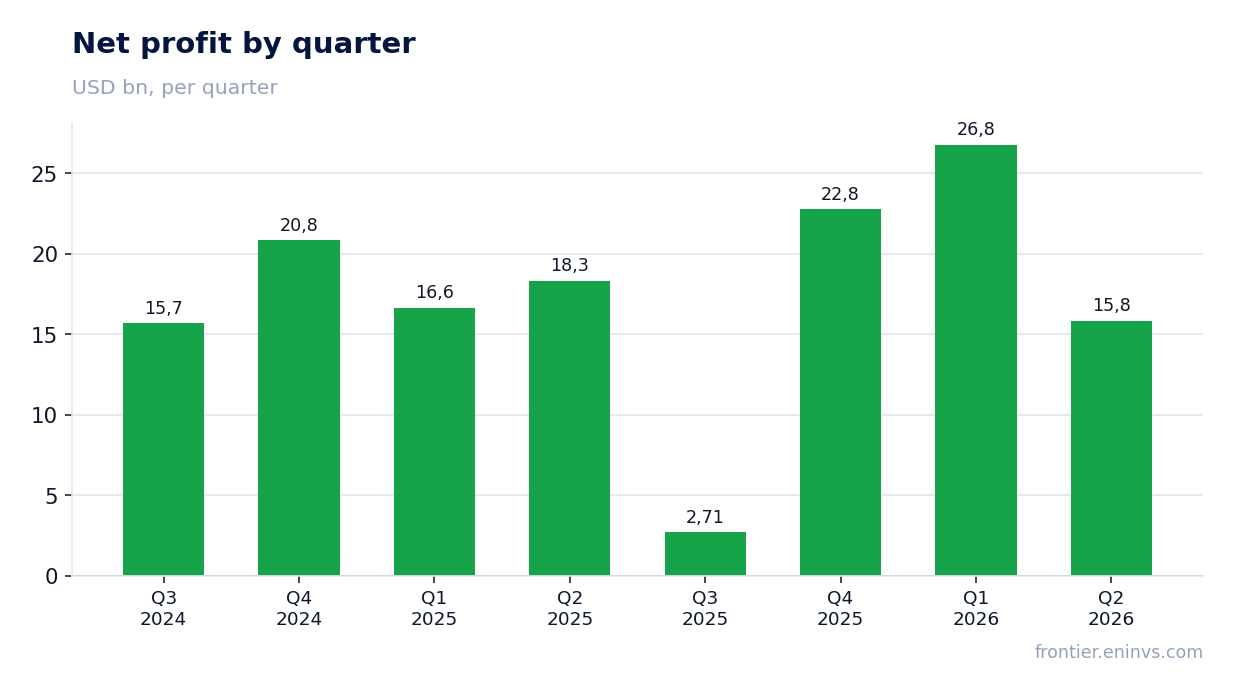
Net profit for the quarter fell 13.6% to $15.8 billion, despite revenue growth. Besides operating expenses, one-off items weighed on the result: $2.4 billion in legal charges and $1.18 billion in severance costs from the May 2026 headcount reduction.
These items were reflected in G&A expenses, which more than doubled from $2.7 billion to $5.6 billion. Without them, operating profit would have been higher, but even so, R&D cost growth remains the main driver of margin compression. Net margin contracted from 38.6% to 26.1%.
Free cash flow collapsed to $784 million due to $30 billion capex
Operating cash flow in Q2 rose 25% to $31.9 billion, but capital expenditures jumped to $30.1 billion — almost double the year-ago level. As a result, free cash flow was only $784 million versus $8.5 billion a year earlier.
The company raised its 2026 capex guidance to $130–145 billion, confirming continued aggressive investment in AI infrastructure. This creates risk for dividend sustainability, although payments continue for now: the company paid $1.35 billion in dividends during the quarter.
Debt rose, but net debt is negative: financial cushion remains
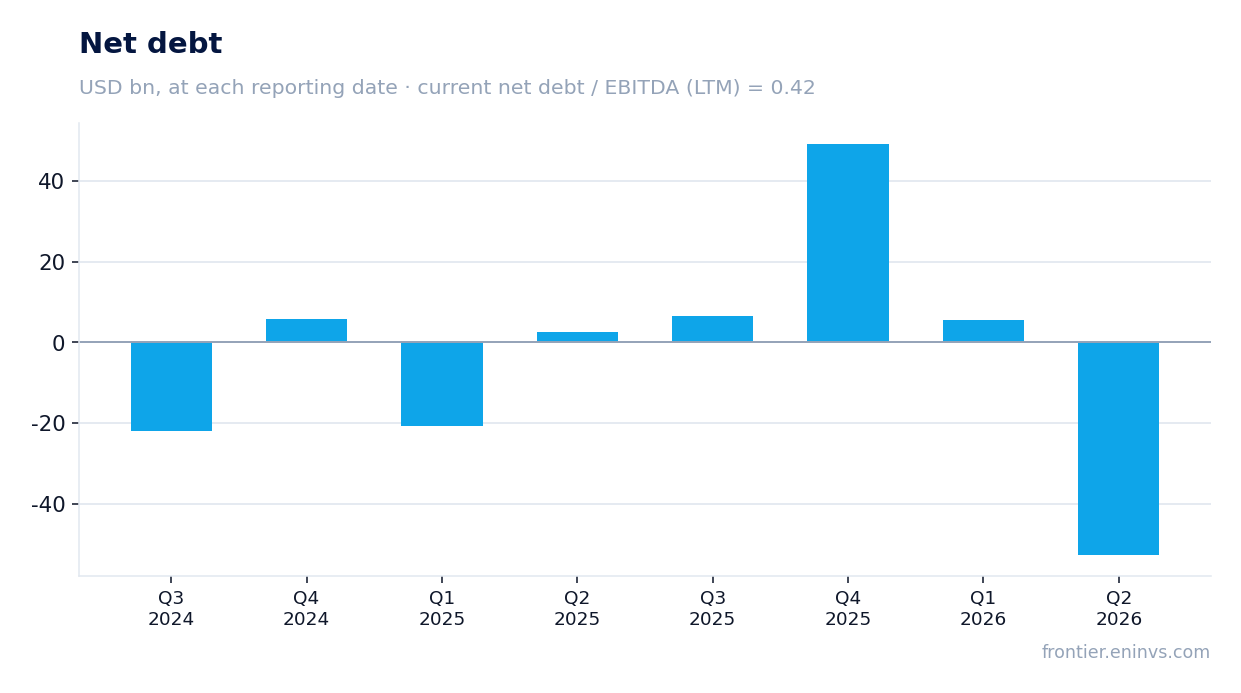
At quarter-end, long-term debt stood at $83.7 billion, up from $58.7 billion at the end of 2025. The company issued new bonds worth $24.9 billion, explaining the increase. However, cash and marketable securities reached $90.3 billion, so net debt is negative: minus $52.7 billion.
Net debt to EBITDA for the trailing twelve months is 0.42 — a moderate level that does not threaten financial stability. The company retains the ability to fund investments from internal resources and, if necessary, raise debt capital.
EV/EBITDA 13.7 — below its own three-year average of 16.6
The current EV/EBITDA multiple is 13.7 versus the three-year average of 16.6. This means the stock trades at a discount to its own history, despite high revenue growth. P/E for the trailing twelve months is 22.9, which also looks moderate for a company growing this fast.
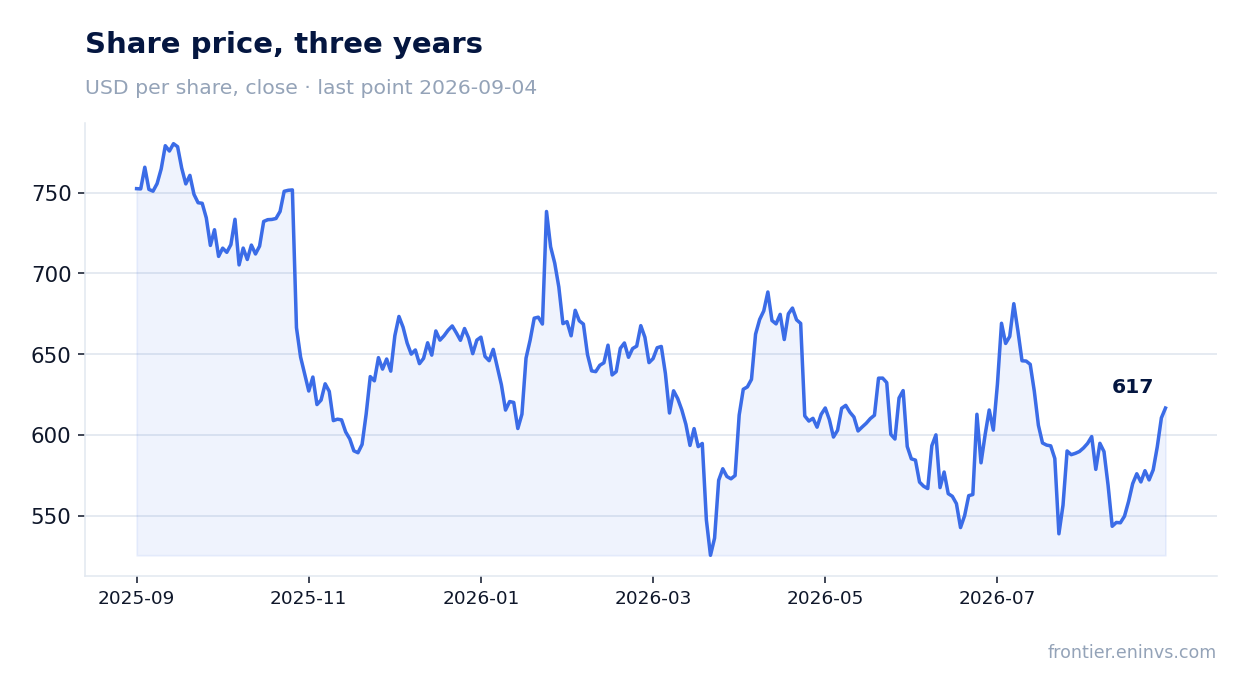
According to the portal's model, the upside is +5% to fair value. This is a modest potential, implying neither significant overvaluation nor clear undervaluation. The company's market capitalization is $1.56 trillion.
Dividends and buyback: shareholder returns shrink, but payments continue
In Q2, the company paid dividends of $1.35 billion, corresponding to a dividend yield of 0.34% over the trailing twelve months. Share buybacks are not reported — unlike last year, when the company repurchased shares worth $10.2 billion in a quarter.
The reduction in buybacks is linked to the need to finance capital expenditures, which now exceed operating cash flow. Nevertheless, the company continues to return capital to shareholders through dividends, albeit modest relative to market capitalization.
Valuation on the latest reported figures
| Metric | Value |
|---|---|
| Market cap | 1 560 bn USD |
| P/E (LTM) | 22.9 |
| EV/EBITDA (LTM) | 13.7 |
| P/B | 7.18 |
| Net debt / EBITDA (LTM) | 0.42 |
| Operating cash flow (LTM) | 116 bn |
| ROE | 25.1% |
| Dividend yield (12m) | 0.3% |
| EV/EBITDA, 3-year average | 16.6 |
Bottom line
Meta Platforms, Inc. continues to grow at double-digit rates, and the advertising business remains strong: revenue +28%, impressions +14%, price per ad +12%. However, the company is deliberately sacrificing margin for AI investments: costs are growing 55%, operating profit is falling, and free cash flow has nearly evaporated. One-off items — legal charges and headcount reduction — amplified the drop in net profit, but are not the main cause. At EV/EBITDA 13.7 versus the average 16.6, the stock does not look overvalued, and the portal's model gives a modest upside of +5%. Verdict — rather attractive: growth persists, but investors should watch when capital expenditures start to pay off, otherwise cash flow pressure will continue.
Open the company's financial profile META →
See also: market overview · valuation map · stock screeners