MGM Resorts: profit jumped sixfold, but half of it came from a one-off property gain
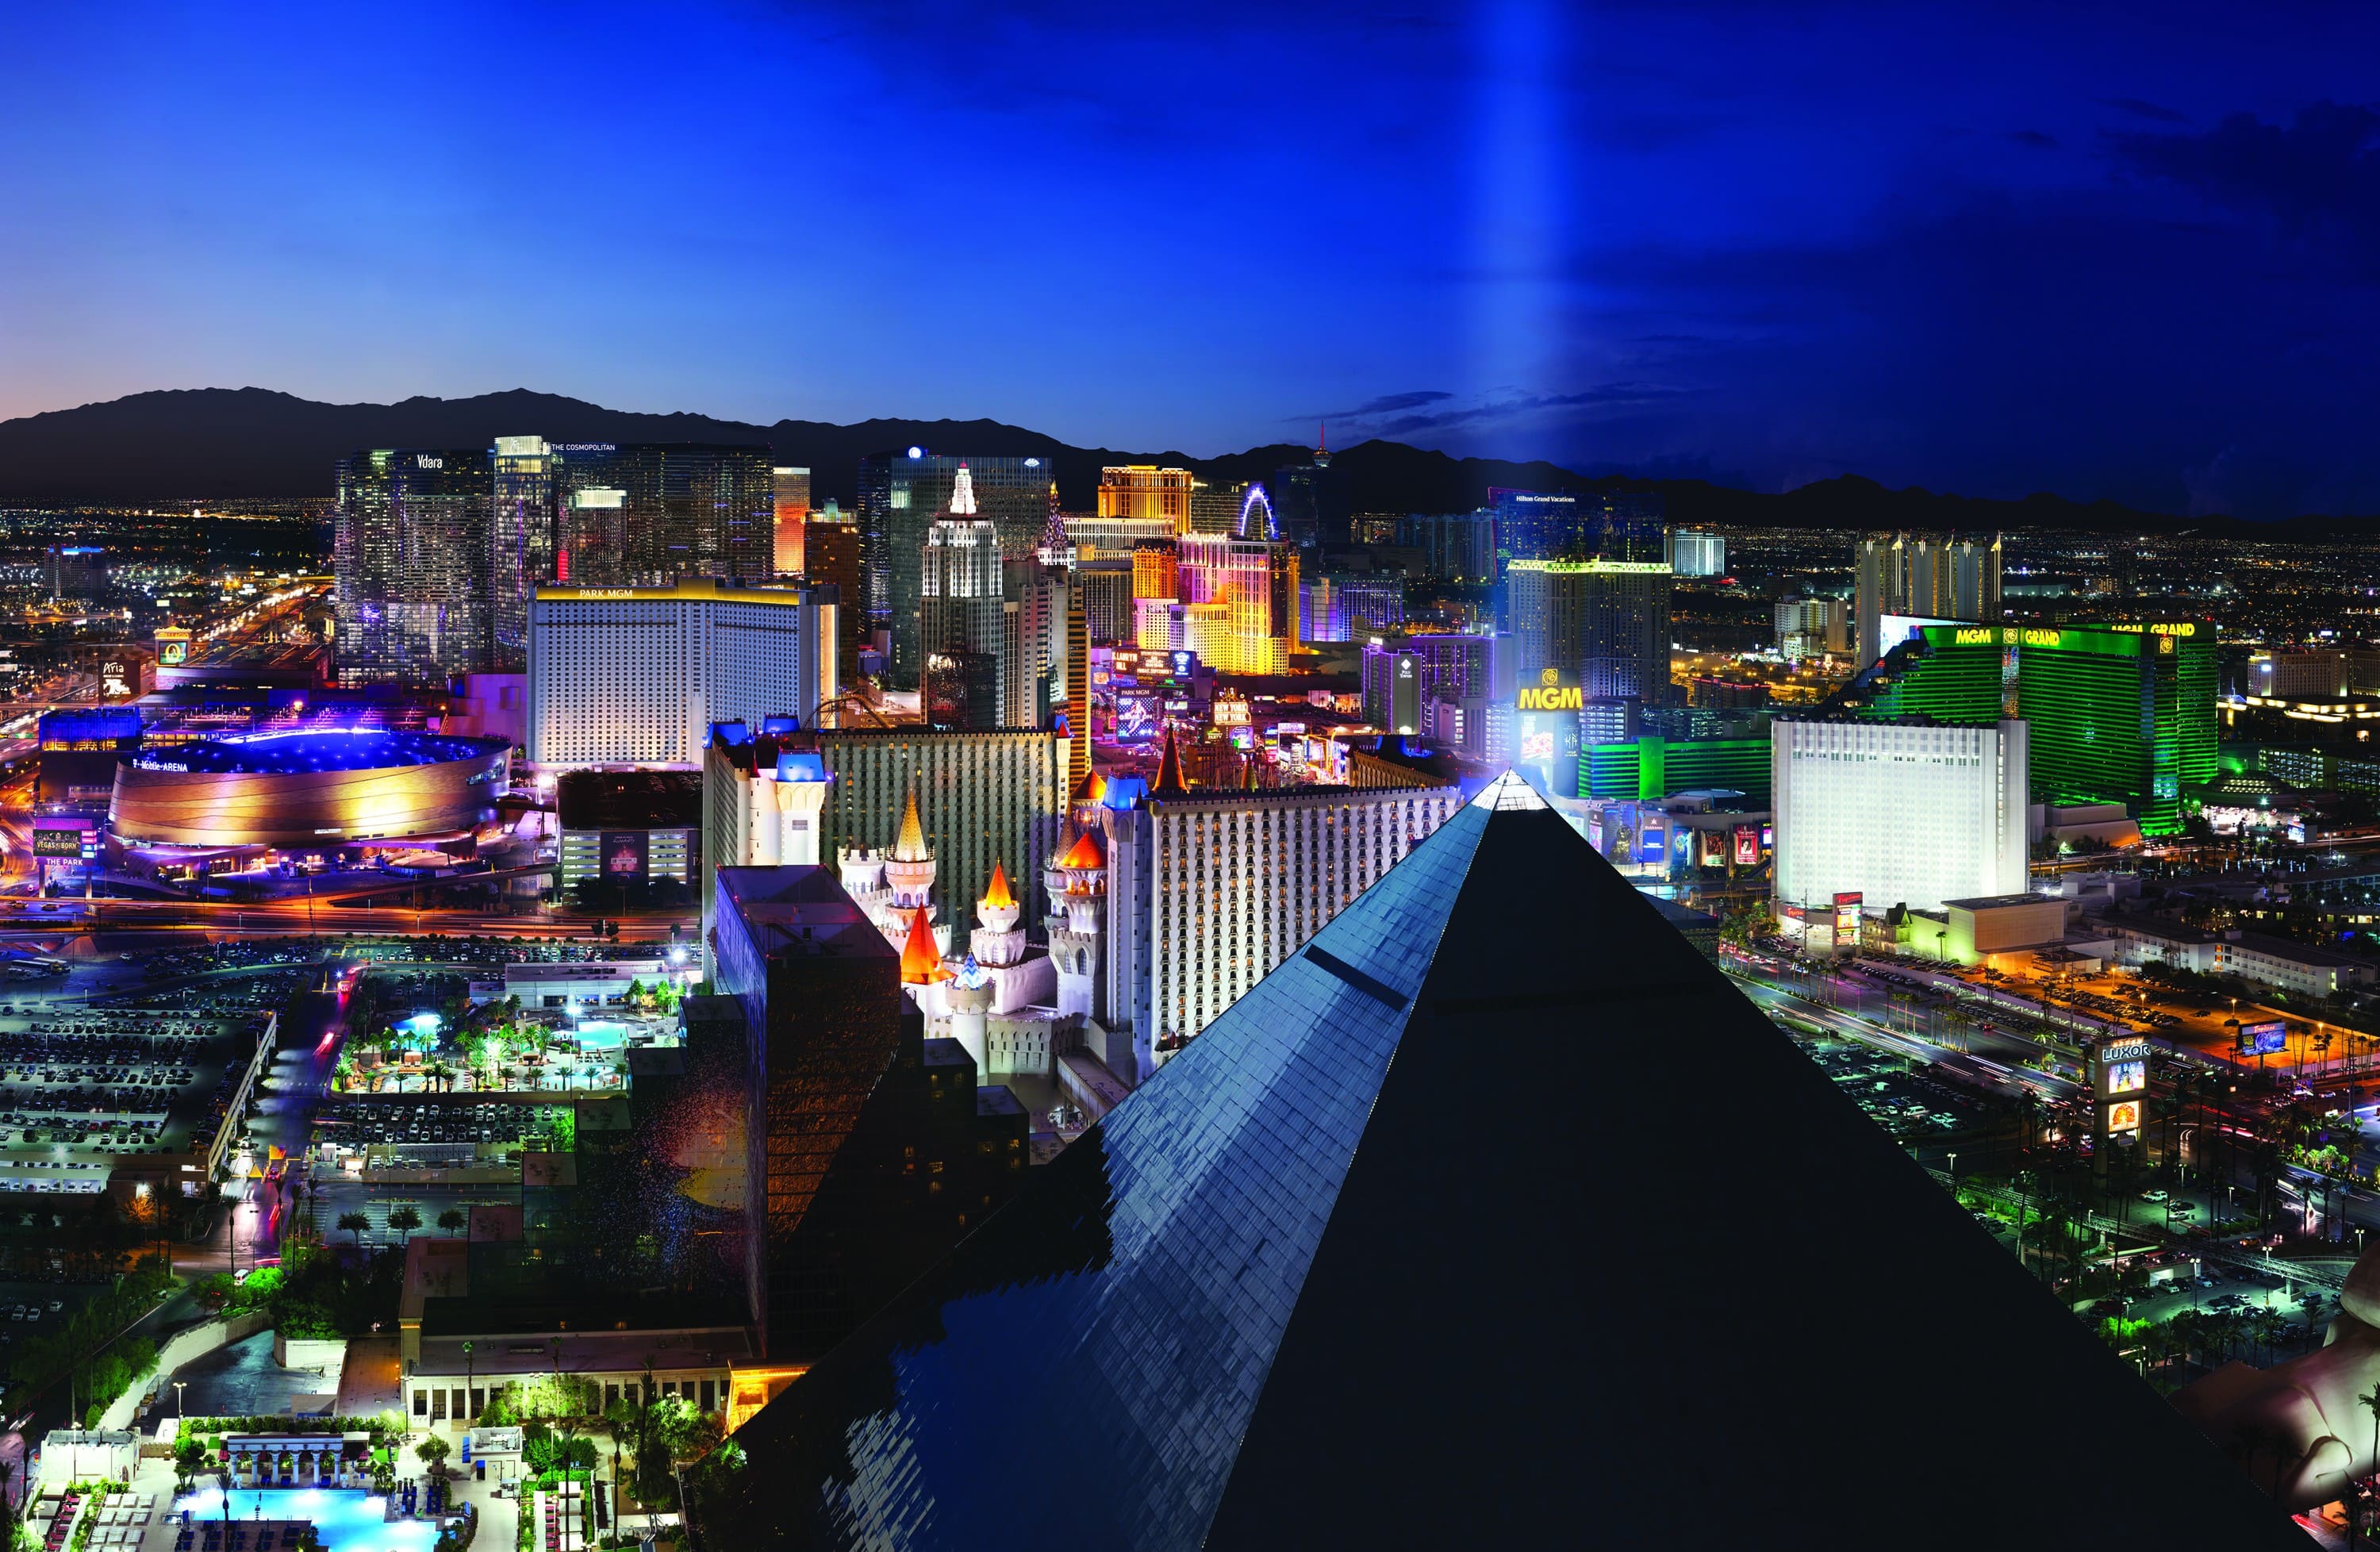
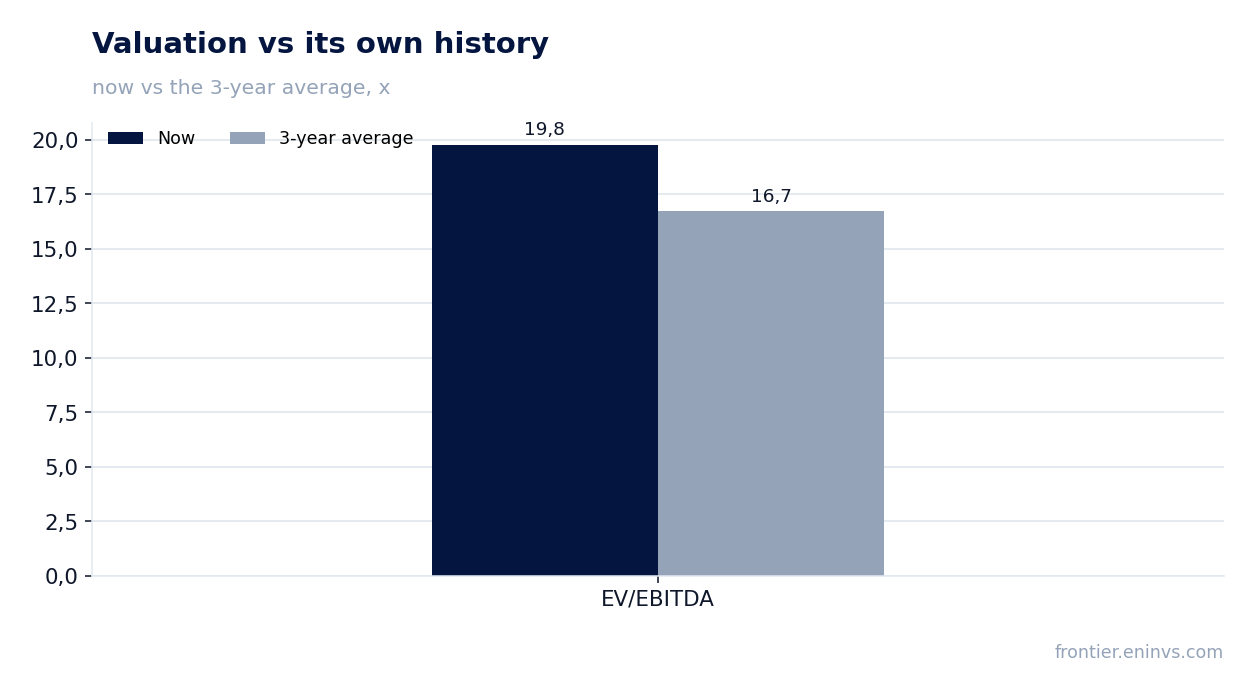
On 29 July MGM Resorts International reported results for the second quarter of 2026. Revenue reached a record for a second quarter at $4.45 billion (+1.0% year on year), adjusted EBITDA came in at $610 million (–5.7%), and net income jumped to $292.4 million from $49.0 million a year earlier. The profit surge was almost entirely driven by a one-off gain on the sale of MGM Northfield Park and lower foreign-currency losses rather than by operating momentum. With EV/EBITDA at 19.8 against its own three-year average of 16.7 and net debt at 14.6 times EBITDA, the stock looks neutral: the Las Vegas Strip is turning around, but that does not yet outweigh the debt load and the EBITDA decline in Macau.
Key takeaways
— Revenue rose 1.0% year on year to $4.45 billion, with all the growth coming from Las Vegas and digital
— EBITDA fell 5.7% to $610 million as Macau lost $45 million and regional operations lost $28 million
— Net income jumped sixfold to $292.4 million, but $287 million of that was a one-off gain on the sale of MGM Northfield Park
— Net debt of $27.6 billion equals 14.6 times trailing twelve-month EBITDA, and debt service consumes $102 million a quarter
— Operating cash flow of $559 million covers capital expenditure of $241 million, but the free cash goes to share buybacks
— EV/EBITDA of 19.8 against its own three-year average of 16.7 means the market is already pricing in a recovery that is not yet in the numbers
Attractiveness
Key figures, USD bn
| Metric | Q2 2025 | Q2 2026 | Change |
|---|---|---|---|
| Revenue | 4.40 | 4.45 | +1.0% |
| EBITDA | 0.65 | 0.61 | -5.7% |
| Operating profit | 0.40 | 0.50 | +24.5% |
| Net profit | 0.05 | 0.29 | +497.4% |
| Operating cash flow | 0.65 | 0.56 | -13.5% |
| Capex | 0.27 | 0.24 | -10.1% |
| EBITDA margin | 14.7% | 13.7% | -1.0 pp |
| Net margin | 1.1% | 6.6% | +5.5 pp |
Revenue rose 1.0% year on year to $4.45 billion, with all the growth coming from Las Vegas and digital
Consolidated revenue in the second quarter of 2026 came to $4.45 billion, up 1.0% from $4.40 billion a year earlier. It was a record second quarter for the company, but the growth is barely visible against the scale of the business. Las Vegas did the heavy lifting: Strip Resorts revenue rose 3% to $2.17 billion, the second consecutive quarter of year-on-year growth. The digital segment MGM Digital added 20% to reach $196 million.
Regional operations saw revenue fall 4% to $924 million, but that reflects the sale of MGM Northfield Park in April 2026. Excluding the disposed asset, same-store revenue rose 3% to $904 million, an all-time best for the region. Macau was flat at $1.10 billion. So organic growth exists in two of the four segments, while the headline number is muddied by the disposal and stagnation in China.
For investors, it matters that Las Vegas growth is not coming from occupancy: it stayed at 93%, while ADR fell 4% to $242. Casino revenue drove the increase, up 17% to $536 million on a high table-games win rate of 29.6% versus 22.9% a year earlier. That is a volatile factor that could easily reverse next quarter.
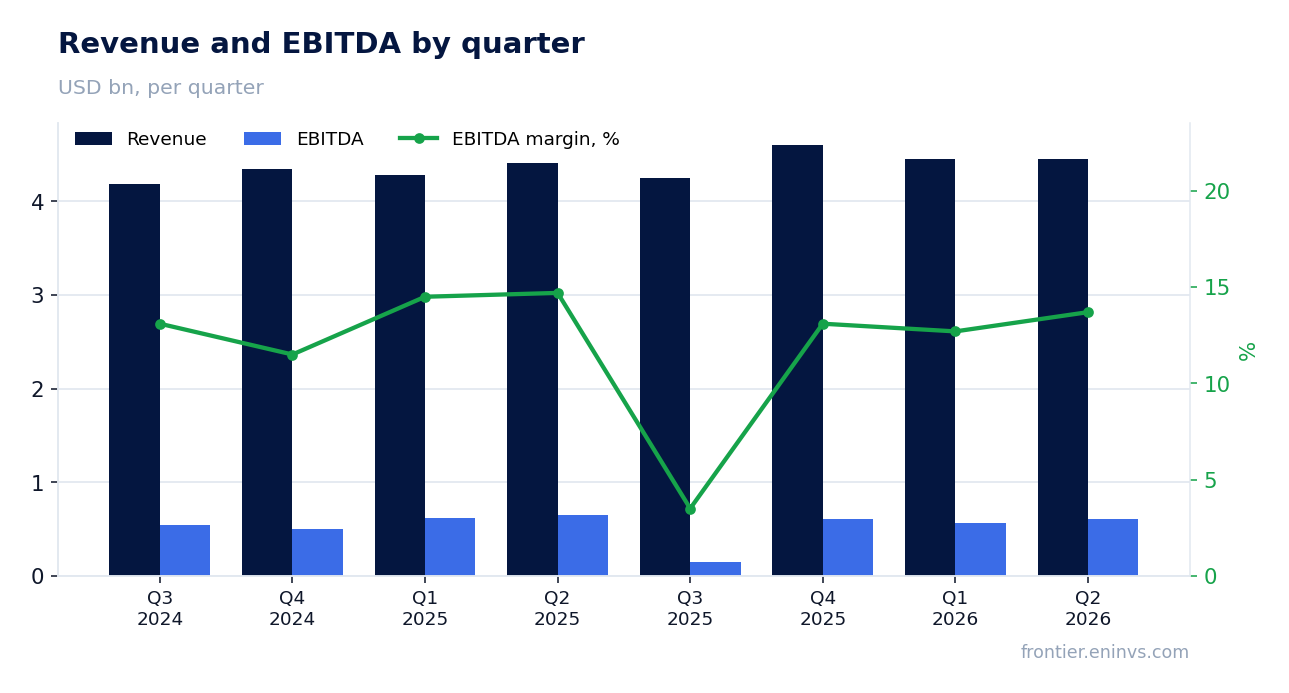
EBITDA fell 5.7% to $610 million as Macau lost $45 million and regional operations lost $28 million
Adjusted EBITDA in the second quarter of 2026 was $610 million, down 5.7% from $648 million a year earlier. The EBITDA margin fell to 13.7% from 14.7%. The main drag came from MGM China: segment EBITDA dropped 15% to $257 million. The company names the reason directly – intercompany branding license fee expense rose by $21 million to $40 million, and that pressure is not related to casino operations.
Regional operations lost 9% of EBITDA to $280 million, but excluding the disposed Northfield Park the figure was flat at $271 million. Las Vegas, by contrast, added 3% to $735 million on the back of casino revenue growth. The digital segment widened its loss to $31 million from $26 million as marketing investment grows faster than revenue.
The takeaway: the EBITDA decline is not a broad crisis but a concentration of problems in Macau and in one-off license fees. Excluding the license fee increase, Macau EBITDA would have been $21 million higher and total EBITDA would have fallen only 3.7%. But as long as that factor persists, the margin stays under pressure.
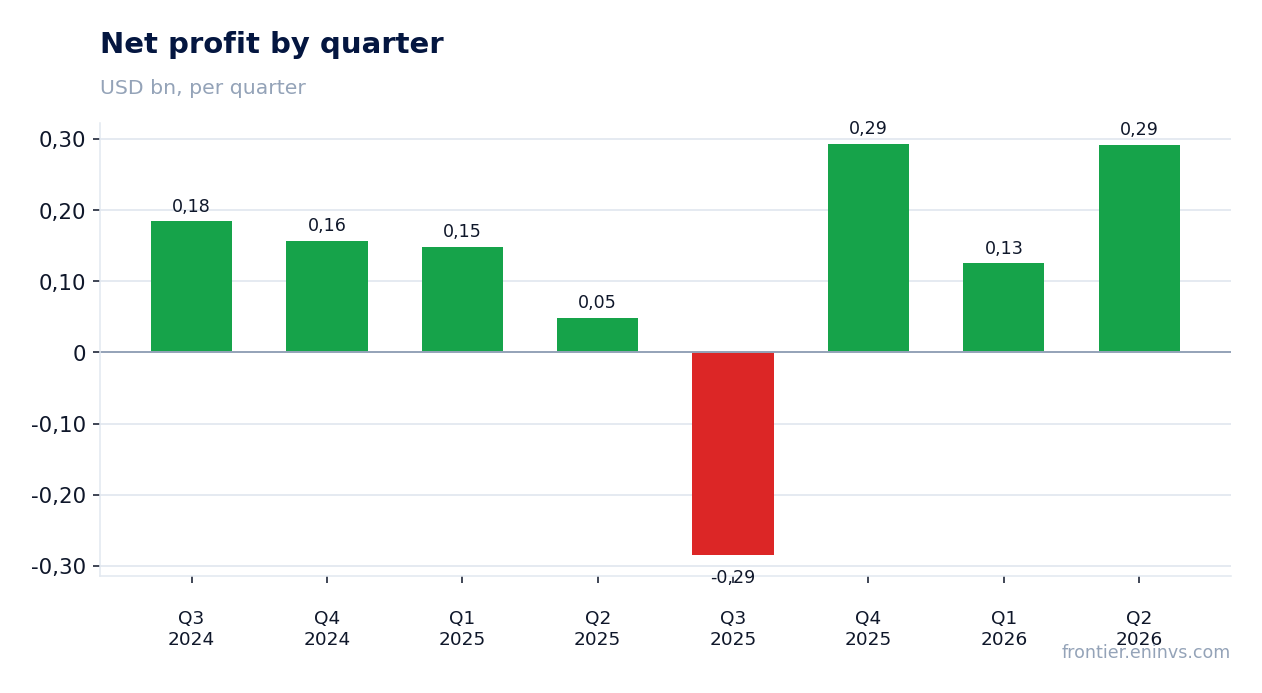
Net income jumped sixfold to $292.4 million, but $287 million of that was a one-off gain on the sale of MGM Northfield Park
Net income attributable to MGM Resorts shareholders in the second quarter of 2026 was $292.4 million versus $49.0 million a year earlier. That is a nearly sixfold increase and immediately draws attention. However, the report discloses that profit includes a positive property transactions, net line of $286.7 million – the gain on the sale of MGM Northfield Park, which closed on 21 April 2026. Without that one-off gain, profit would have been at or below last year's level.
Diluted earnings per share came to $1.11 versus $0.18 a year earlier, but adjusted EPS, which strips out one-off items, fell to $0.59 from $0.79. The gap is explained not only by the asset sale but also by a $111 million goodwill impairment and foreign-currency factors: a year earlier the company booked a $0.72 per share foreign-currency loss, now a $0.12 gain. These swings have nothing to do with operations.
For assessing the resilience of the business, adjusted profit matters more: $0.59 per share is 25% below last year's level. It shows that without one-off deals, profitability is falling along with EBITDA. Investors should focus on this metric, not the headline $292 million.
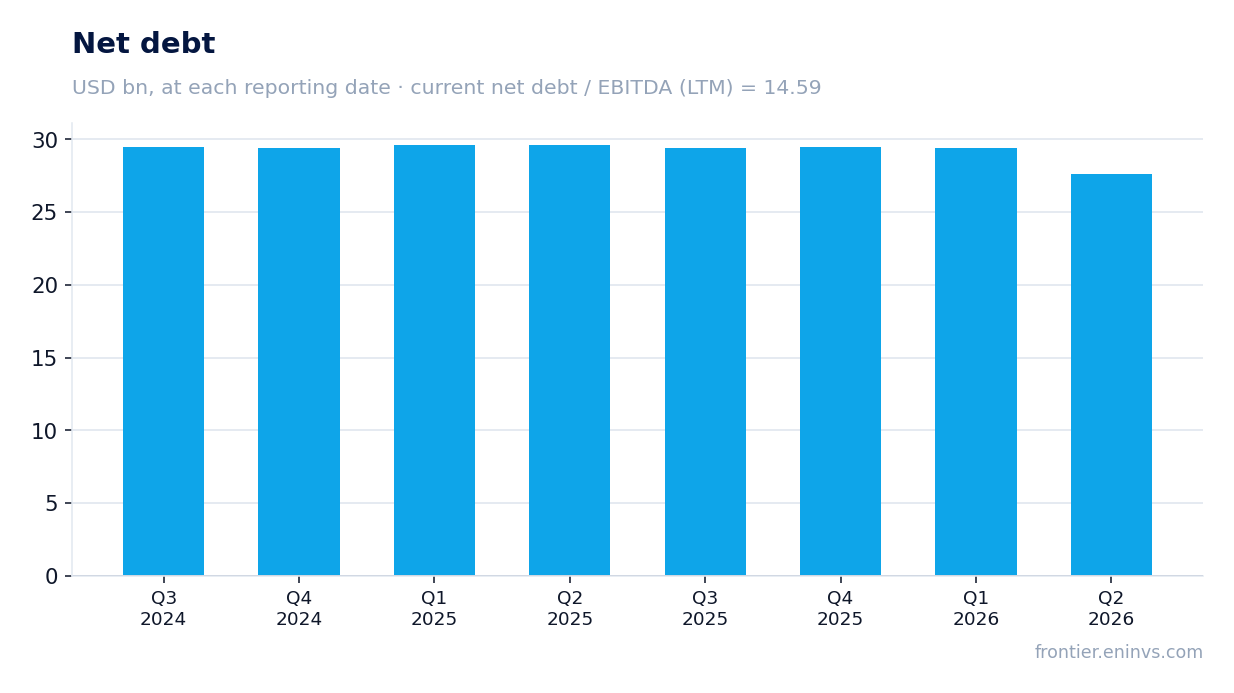
Net debt of $27.6 billion equals 14.6 times trailing twelve-month EBITDA, and debt service consumes $102 million a quarter
Net debt at the end of the second quarter of 2026 was $27.6 billion, down from $29.5 billion at the end of the first quarter. The $1.8 billion reduction over the quarter came from the sale of MGM Northfield Park and positive operating cash flow. However, the ratio of net debt to trailing twelve-month EBITDA remains extremely high at 14.6. That level limits financial flexibility and increases sensitivity to interest rates.
Interest expense for the quarter was $102 million, down 3% from a year earlier. At current EBITDA of $610 million, interest alone consumes almost 17% of quarterly EBITDA. The company does not disclose a repayment schedule, but the $6.07 billion of debt on the balance sheet is only part of the obligations; the rest is $23.8 billion of operating lease liabilities, which are not included in net debt but require annual payments.
Importantly, the company gives no guidance on reducing debt. The report only mentions continued investment in MGM Osaka and digital businesses. With such a load, any slowdown in operating cash flow could force new borrowing or cuts to share buybacks. For now, debt is being serviced, but there is little margin of safety.
Operating cash flow of $559 million covers capital expenditure of $241 million, but the free cash goes to share buybacks
Operating cash flow in the second quarter of 2026 was $558.8 million, down 13% from $645.9 million a year earlier. Capital expenditure fell to $241.4 million from $268.4 million. Free cash flow was therefore about $317 million – enough to cover dividends, but the company pays no dividends. Instead, it repurchased $164 million of shares under a programme with $1.4 billion remaining.
The decline in operating cash flow despite revenue growth is explained by lower EBITDA and higher interest payments. During the quarter the company bought back 4 million shares, reducing the share count to 251.6 million from 258.3 million at the end of 2025. This supports earnings per share but does not solve the debt problem.
For investors, it matters that free cash flow remains positive, but its quality is deteriorating: it is generated by cutting capital expenditure rather than by growing operating profit. If the company resumes large investments in Las Vegas or Japan, free cash flow could turn negative.
EV/EBITDA of 19.8 against its own three-year average of 16.7 means the market is already pricing in a recovery that is not yet in the numbers
The trailing twelve-month EV/EBITDA multiple is 19.8, above its own three-year average of 16.7. This means the market values the company more expensively than its three-year average, despite falling EBITDA. The trailing P/E is 24.7, also not cheap against declining adjusted profit. Market capitalisation is $10.5 billion, less than half of net debt.
Our valuation model, used by the portal, shows upside to fair value of only +2%. This is not a market consensus but the output of our own model, which compares EBITDA growth with a target multiple. Such modest upside suggests the current price already reflects much of the expected recovery.
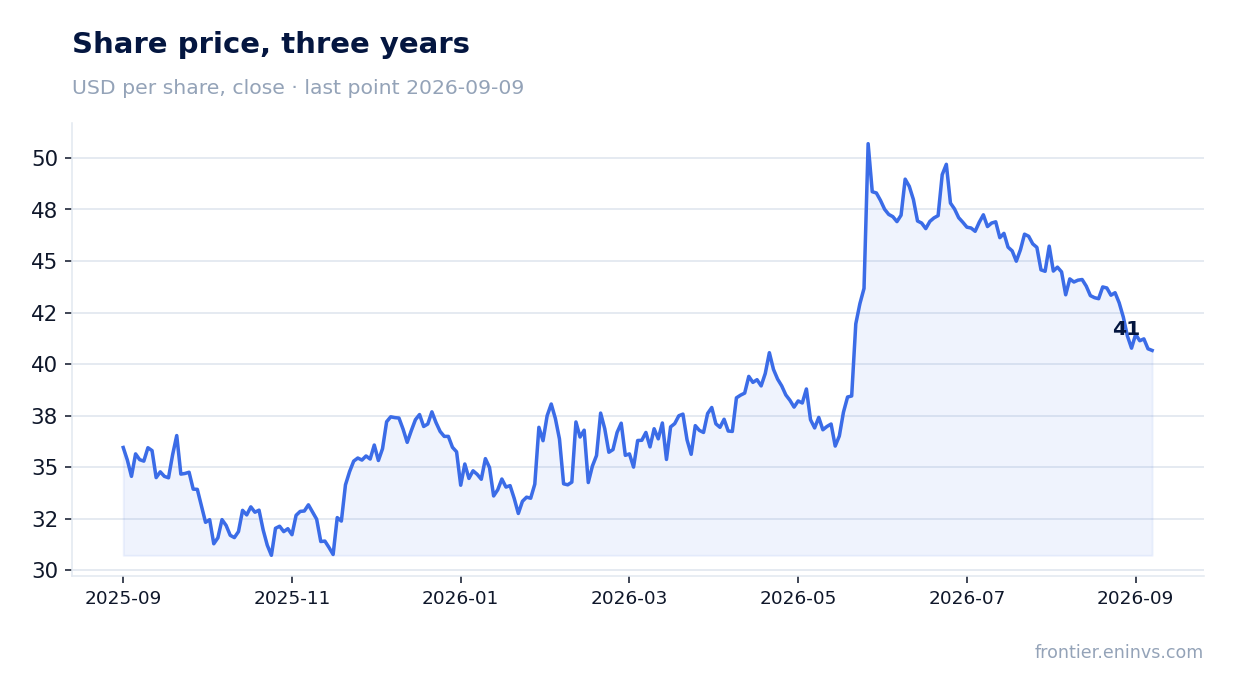
Since the report was published, the share has fallen 12.0%, and on the day of the report it fell 0.8%. The market reacted to weak EBITDA and the absence of dividends. At the same time, the stock trades above its historical average multiple, creating a risk of further de-rating if operating metrics do not improve.
Valuation on the latest reported figures
| Metric | Value |
|---|---|
| Market cap | 10.5 bn USD |
| P/E (LTM) | 24.7 |
| EV/EBITDA (LTM) | 19.8 |
| P/B | 4.32 |
| Net debt / EBITDA (LTM) | 14.59 |
| Operating cash flow (LTM) | 2.50 bn |
| ROE | 47.3% |
| EV/EBITDA, 3-year average | 16.7 |
Bottom line
The report's strengths are record second-quarter revenue, a second consecutive quarter of Las Vegas growth, and record regional operations excluding disposals. However, net income rose sixfold only because of the one-off gain on the sale of MGM Northfield Park, while adjusted EPS fell 25%. EBITDA declined 5.7% on Macau and license expenses, and net debt of $27.6 billion against EBITDA of $610 million leaves little room for manoeuvre. With EV/EBITDA at 19.8 versus a three-year average of 16.7 and only +2% upside on the portal's model, the stock looks neutral: the Las Vegas turnaround is real, but it does not yet outweigh the debt load and weakness in Asia.
Open the company's financial profile MGM →
See also: market overview · valuation map · stock screeners