MONOLITHIC POWER SYSTEMS INC: revenue accelerated to +47.6%, but the market already prices it at 74x EV/EBITDA

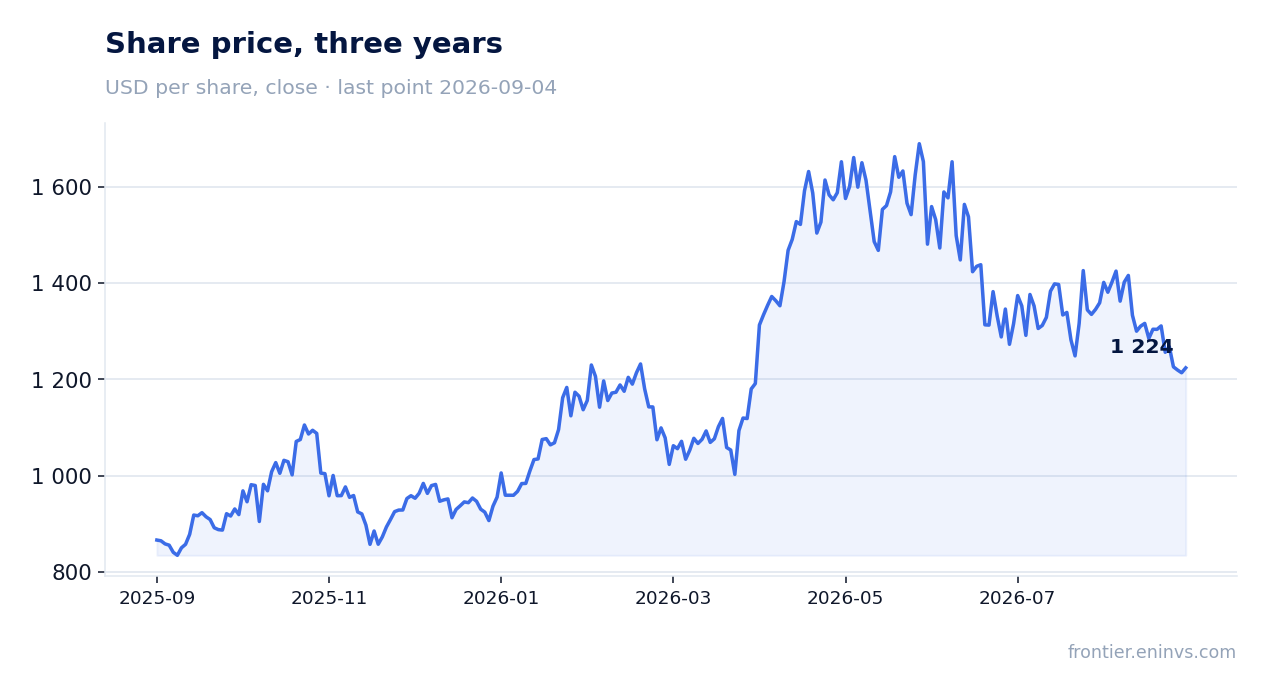
30 июля 2026 года MONOLITHIC POWER SYSTEMS INC раскрыла результаты за второй квартал 2026 года. Выручка выросла на 47,6% год к году до 980,6 млн долл., чистая прибыль – на 92,4% до 257,3 млн долл., EBITDA – на 80,5% до 321,0 млн долл. Акции на релизе прибавили 5,4%, но с тех пор скорректировались на 2,0%. При текущей оценке в 74,2 EV/EBITDA по LTM и 96,2 P/E акция выглядит скорее привлекательной, но только если рост выручки и маржи продолжится в том же темпе.
Key takeaways
— Q2 2026 revenue grew 47.6% YoY to $980.6 million, driven by a doubling of Enterprise Data sales
— EBITDA margin expanded from 26.8% to 32.7% on operating leverage and revenue growth
— Net profit rose 92.4% to $257.3 million, but nearly $54 million was stock-based compensation
— Inventories increased to $675.8 million, but days of inventory fell to 140
— Board authorized an additional $500 million for buybacks, bringing total to $1 billion
— Q3 guidance implies revenue of $1,140–1,160 million, up 16–18% sequentially
— Shares trade at 74.2x EV/EBITDA LTM, in line with the 3-year average, but P/E of 96.2 looks stretched
Attractiveness
Key figures, USD bn
| Metric | Q2 2025 | Q2 2026 | Change |
|---|---|---|---|
| Revenue | 0.66 | 0.98 | +47.6% |
| EBITDA | 0.18 | 0.32 | +80.5% |
| Operating profit | 0.16 | 0.30 | +84.4% |
| Net profit | 0.13 | 0.26 | +92.4% |
| Operating cash flow | 0.24 | 0.23 | -4.1% |
| Capex | 0.05 | 0.08 | +71.2% |
| EBITDA margin | 26.8% | 32.7% | +5.9 pp |
| Net margin | 20.1% | 26.2% | +6.1 pp |
Q2 2026 revenue grew 47.6% YoY to $980.6 million, driven by a doubling of Enterprise Data sales
In Q2 2026, MONOLITHIC POWER SYSTEMS INC revenue reached $980.6 million, up 47.6% YoY. The main driver was the Enterprise Data segment, with sales up 164.3% YoY to $380.6 million, representing 38.8% of total revenue. The company attributes the growth to higher sales of power management solutions for AI and server applications.
Sequential dynamics are also impressive: revenue grew 21.9% QoQ, with all end markets showing growth. Besides Enterprise Data, Communications grew strongly – 78.3% YoY to $131.5 million, driven by power solutions for optical modules and switches. Meanwhile, Consumer declined 4.8% YoY, indicating continued weakness in that segment.
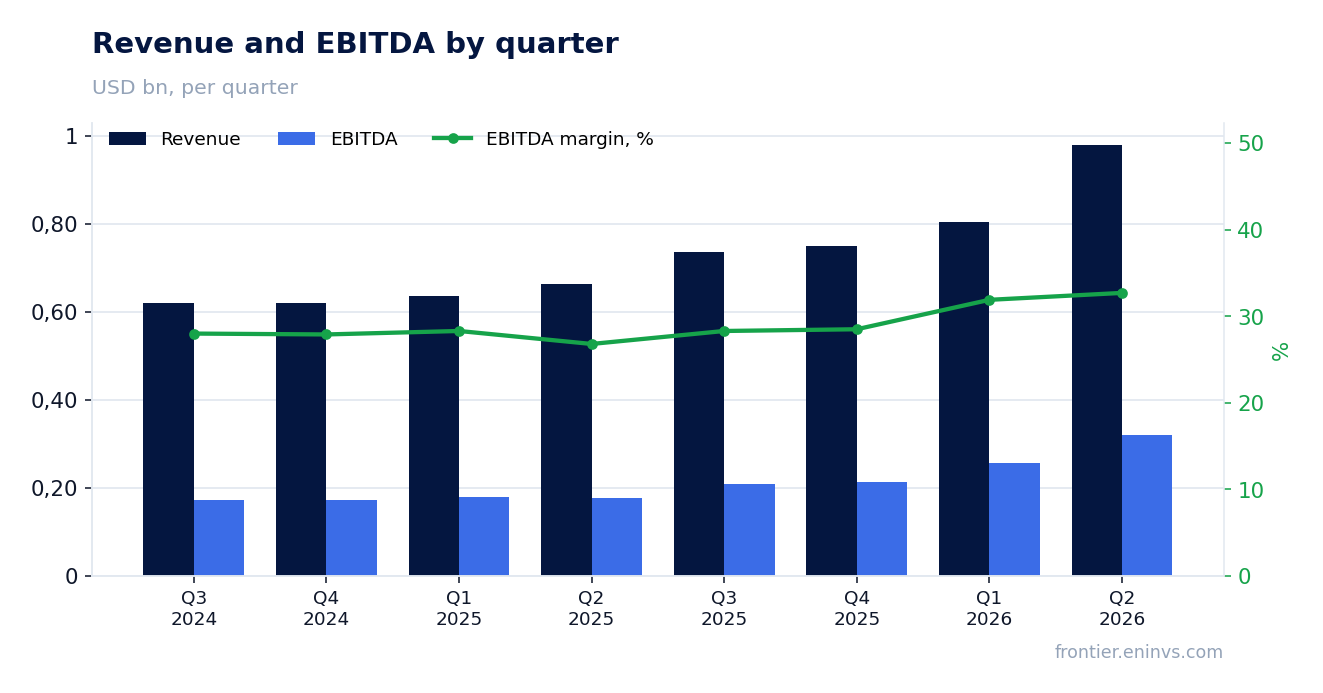
EBITDA margin expanded from 26.8% to 32.7% on operating leverage and revenue growth
In Q2 2026, EBITDA grew 80.5% YoY to $321.0 million, with EBITDA margin expanding from 26.8% to 32.7%. Operating profit rose to $303.9 million from $164.8 million a year earlier, reflecting operating leverage: revenue is growing faster than operating expenses.
GAAP operating expenses increased 17.8% YoY to $237.2 million, but significantly slower than revenue. As a result, operating margin expanded from 24.8% to 31.0% on a GAAP basis. The company also notes that gross margin remained stable at 55.2% GAAP and 55.6% non-GAAP, indicating that margin improvement is driven by operating leverage, not pricing.
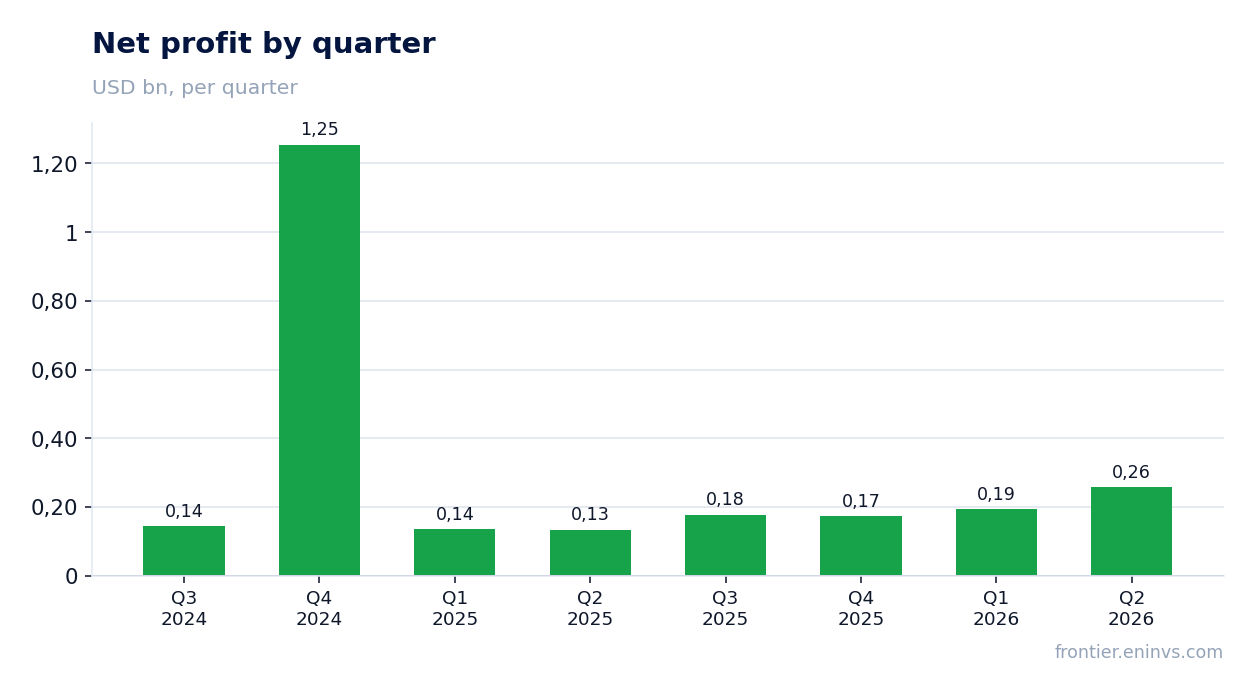
Net profit rose 92.4% to $257.3 million, but nearly $54 million was stock-based compensation
Net profit in Q2 2026 was $257.3 million, up 92.4% YoY. However, stock-based compensation accounted for a significant portion of expenses: $53.5 million in Q2 2026 versus $60.3 million a year earlier. Non-GAAP net income, which excludes these and other items, was $320.1 million, or $6.50 per diluted share.
The gap between GAAP and non-GAAP metrics is significant: non-GAAP net income is 24% higher than GAAP. This matters for valuation: investors should recognize that a large part of 'profit' is actually non-cash expenses that do not affect cash flow but dilute shareholders. Diluted shares outstanding rose to 49.3 million, reflecting continued issuance under compensation programs.
Inventories increased to $675.8 million, but days of inventory fell to 140
At the end of Q2 2026, inventories stood at $675.8 million, up from $619.2 million in Q1 2026. However, days of inventory based on current quarter revenue fell to 140 days from 157 days in Q1, indicating faster inventory turnover relative to sales growth.
The company also notes that based on next quarter's projected revenue, days of inventory were 121 days, 7 days lower than in Q1. This is a positive signal: inventory growth is lagging revenue growth, reducing the risk of excess inventory if demand slows. Nevertheless, absolute inventory levels rose 9% QoQ, which warrants attention if revenue growth decelerates.
Board authorized an additional $500 million for buybacks, bringing total to $1 billion
In its Q2 2026 report, the company announced that the board approved an additional $500 million for share repurchases, increasing the total program to $1 billion. This decision underscores management's confidence in financial stability and future cash flows.
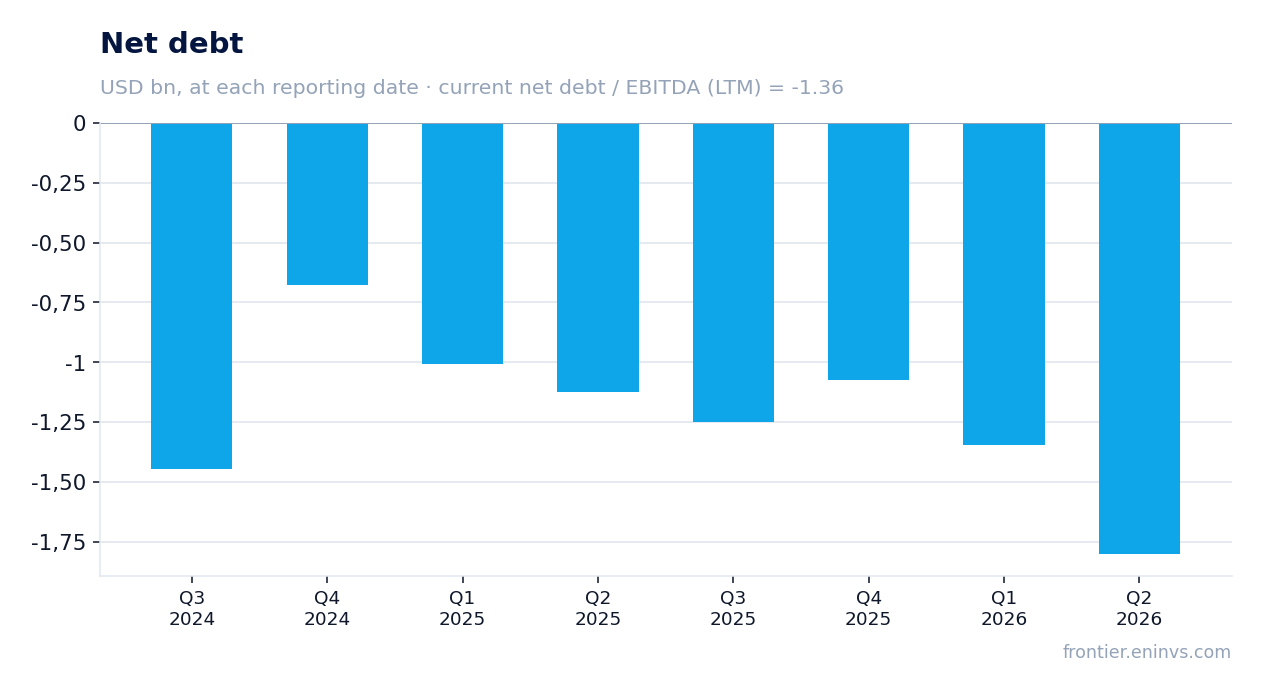
At quarter-end, cash and short-term investments stood at $1,413.8 million, significantly exceeding debt (net debt is negative: –$1,803.0 million). Operating cash flow for the quarter was $227.9 million, sufficient to fund both buybacks and capex of $82.4 million. Dividend yield over the trailing twelve months is 0.58%, relatively low, but combined with buybacks it enhances total shareholder returns.
Q3 guidance implies revenue of $1,140–1,160 million, up 16–18% sequentially
The company guides Q3 2026 revenue in the range of $1,140–1,160 million, implying sequential growth of 16–18% over Q2. This guidance significantly exceeds historical growth rates and indicates sustained strong demand, particularly in Enterprise Data.
Gross margin guidance is 55.2–55.8% GAAP and 55.4–56.0% non-GAAP, roughly in line with current levels. GAAP operating expenses are expected at $252.7–258.7 million, above the actual $237.2 million in Q2, reflecting continued investment in R&D and sales. The company also expects a non-GAAP tax rate of 15% for 2026.
Shares trade at 74.2x EV/EBITDA LTM, in line with the 3-year average, but P/E of 96.2 looks stretched
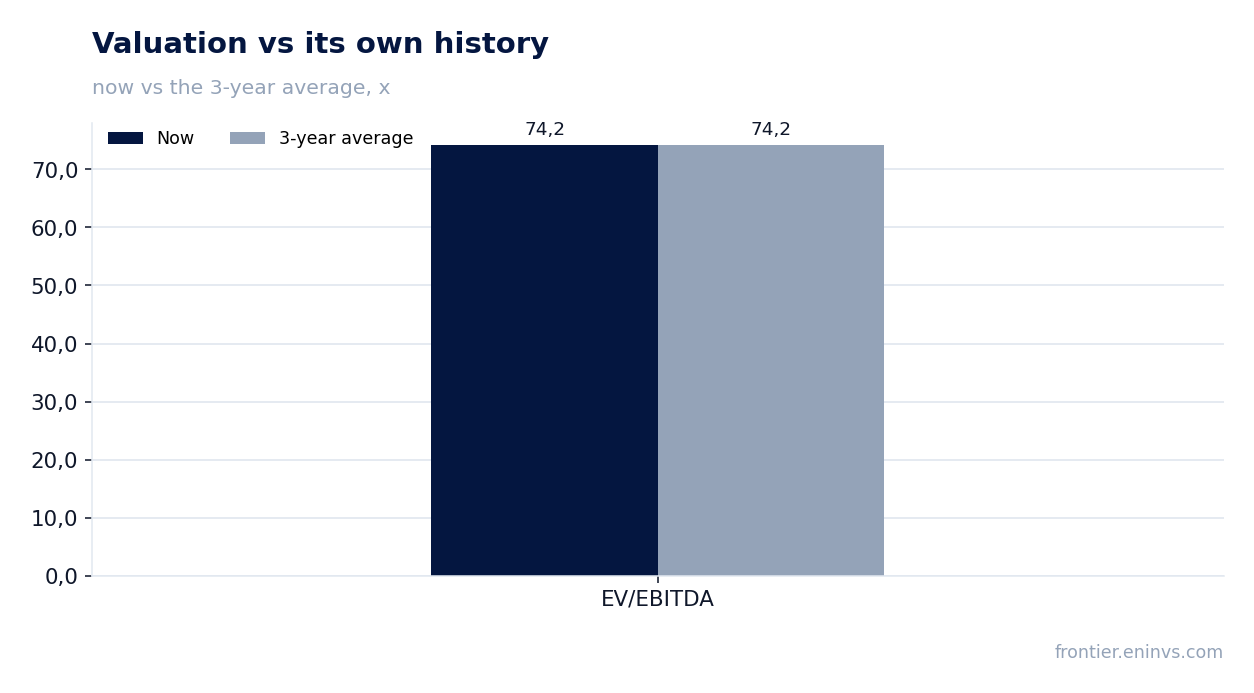
Current market capitalization is $59,793.2 million, and EV/EBITDA LTM is 74.2, almost exactly in line with the 3-year average (74.2). This means the market values the company in line with its historical valuation, neither at a premium nor a discount. However, P/E LTM is 96.2, reflecting high earnings growth expectations.
According to the portal's model, based on EBITDA growth and target multiple, the upside potential is +15% to fair value. This suggests the current price does not fully reflect future growth, but also does not offer significant undervaluation. The company has negative net debt (–$1,803.0 million), providing financial flexibility, and ROE of 27.2% indicates high capital efficiency.
Valuation on the latest reported figures
| Metric | Value |
|---|---|
| Market cap | 59.8 bn USD |
| P/E (LTM) | 96.2 |
| EV/EBITDA (LTM) | 74.2 |
| P/B | 16.93 |
| Net debt / EBITDA (LTM) | -1.36 |
| Operating cash flow (LTM) | 0.84 bn |
| ROE | 27.2% |
| Dividend yield (12m) | 0.6% |
| EV/EBITDA, 3-year average | 74.2 |
Bottom line
The Q2 2026 report shows strong growth: revenue accelerated to +47.6%, EBITDA margin expanded to 32.7%, and Q3 guidance implies further acceleration. The company generates significant operating cash flow, has negative net debt, and is increasing its buyback program. However, the current valuation – 74.2x EV/EBITDA and 96.2x P/E – already prices in high expectations, and the portal model suggests only +15% upside. The share looks rather attractive for long-term investors who believe in the sustainability of the AI trend, but warrants caution if growth decelerates.
Open the company's financial profile MPWR →
See also: market overview · valuation map · stock screeners