Morgan Stanley: revenue accelerates to +27%, but operating cash flow remains negative
15 июля Morgan Stanley раскрыла результаты за второй квартал 2026 года: выручка выросла на 27,1% год к году до 21,3 млрд долларов, EBITDA – на 45,1%, чистая прибыль – на 57,7%. Однако операционный денежный поток за квартал составил минус 2,7 млрд долларов, а за последние 12 месяцев – минус 17,9 млрд. При такой динамике и с учётом мультипликаторов выше собственной истории акции выглядят скорее привлекательно, но с оговорками.
Key takeaways
— Revenue in Q2 grew 27% – the fastest in five quarters
— EBITDA margin reached 40.1% – a record level amid revenue growth
— Net profit rose 58% thanks to operating leverage and lower credit loss provisions
— Operating cash flow remains negative for the second consecutive quarter
— Debt burden decreased in the quarter but increased by $12.8 billion over the year
— Bank capital is growing, ROE exceeds 19%
— Institutional Securities segment doubled profit thanks to investment banking boom
Attractiveness
Key figures, USD bn
| Metric | Q2 2025 | Q2 2026 | Change |
|---|---|---|---|
| Revenue | 16.8 | 21.3 | +27.1% |
| EBITDA | 5.89 | 8.55 | +45.1% |
| Operating profit | — | 7.35 | — |
| Net profit | 3.54 | 5.58 | +57.7% |
| Operating cash flow | 11.8 | -2.75 | -123.2% |
| Capex | 0.73 | 0.82 | +12.4% |
| EBITDA margin | 35.1% | 40.1% | +5.0 pp |
| Net margin | 21.1% | 26.1% | +5.0 pp |
Revenue in Q2 grew 27% – the fastest in five quarters
In Q2 2026, Morgan Stanley's revenue reached $21.3 billion, up 27.1% year-over-year. This is the fastest growth in the last five quarters – the previous high was in Q3 2025 (+18.5%).
The main driver was the Institutional Securities segment, where revenue jumped 44% to $11.0 billion. Investment banking grew 58%, driven by a doubling of underwriting revenue and a 57% rise in advisory services. Wealth Management also showed strong dynamics (+14%), supported by growth in client assets and net new assets.
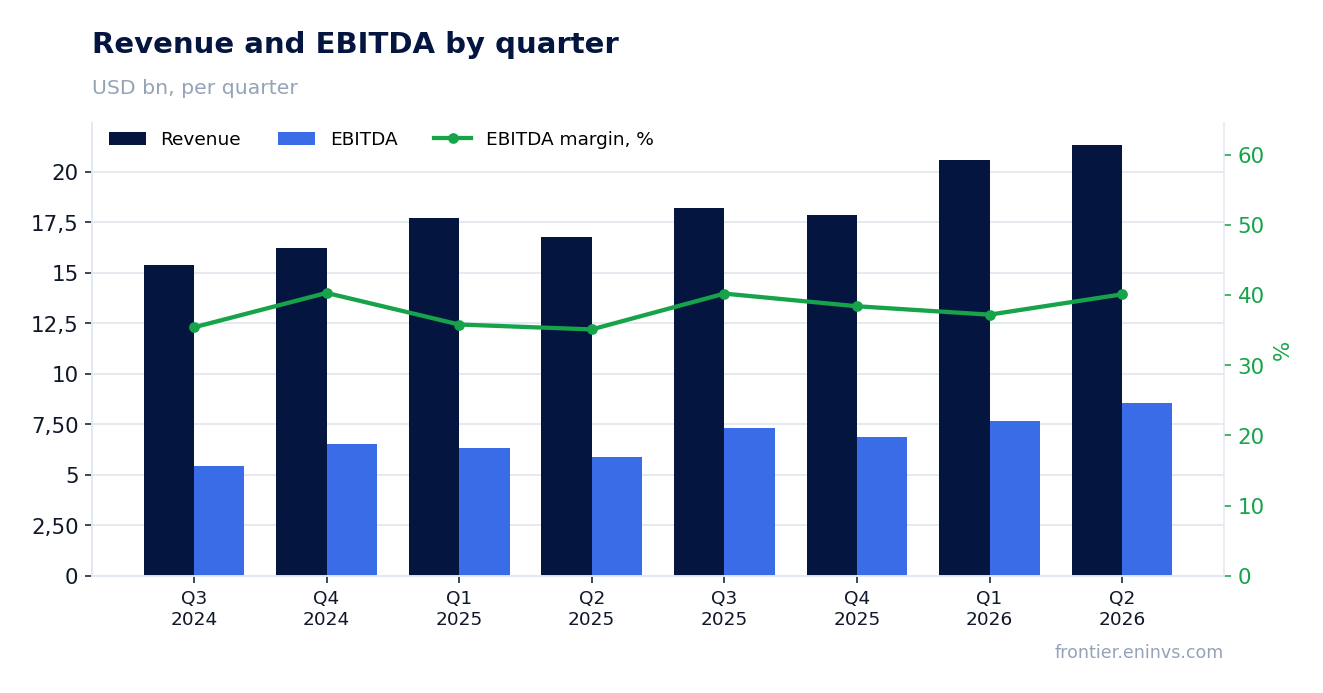
EBITDA margin reached 40.1% – a record level amid revenue growth
EBITDA for the quarter was $8.55 billion, up 45.1% year-over-year. EBITDA margin expanded from 35.1% to 40.1% – the highest level in the period under review.
Margin expansion was driven by operating leverage: revenue grew faster than expenses. Non-interest expenses rose only 16%, while revenue grew 27%. Particularly notable is the decline in compensation as a percentage of revenue – from 43% to 38%.
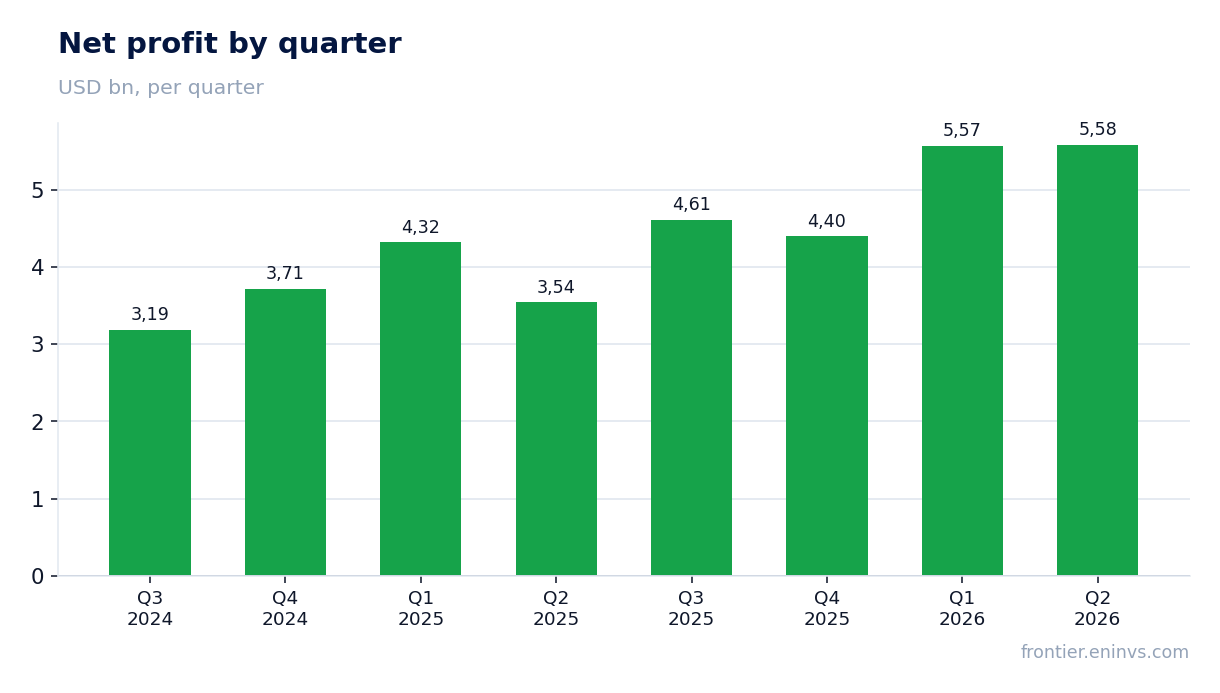
Net profit rose 58% thanks to operating leverage and lower credit loss provisions
Net profit in Q2 was $5.58 billion, up 57.7% year-over-year. Net margin expanded from 21.1% to 26.1%.
In addition to operating leverage, support came from a halving of credit loss provisions to $98 million. The effective tax rate remained roughly flat year-over-year (23.1% vs. 22.7%).
Operating cash flow remains negative for the second consecutive quarter
In Q2 2026, operating cash flow was minus $2.7 billion, and over the last twelve months – minus $17.9 billion. Negative OCF is typical for banks: it reflects movements in client balances and central counterparty positions, not operational losses.
Nevertheless, persistently negative OCF over most of the last eight quarters (except Q4 2024 and Q2 2025) indicates a significant liquidity outflow that the bank compensates by raising debt. This is evident from a 20% increase in long-term debt over the year.
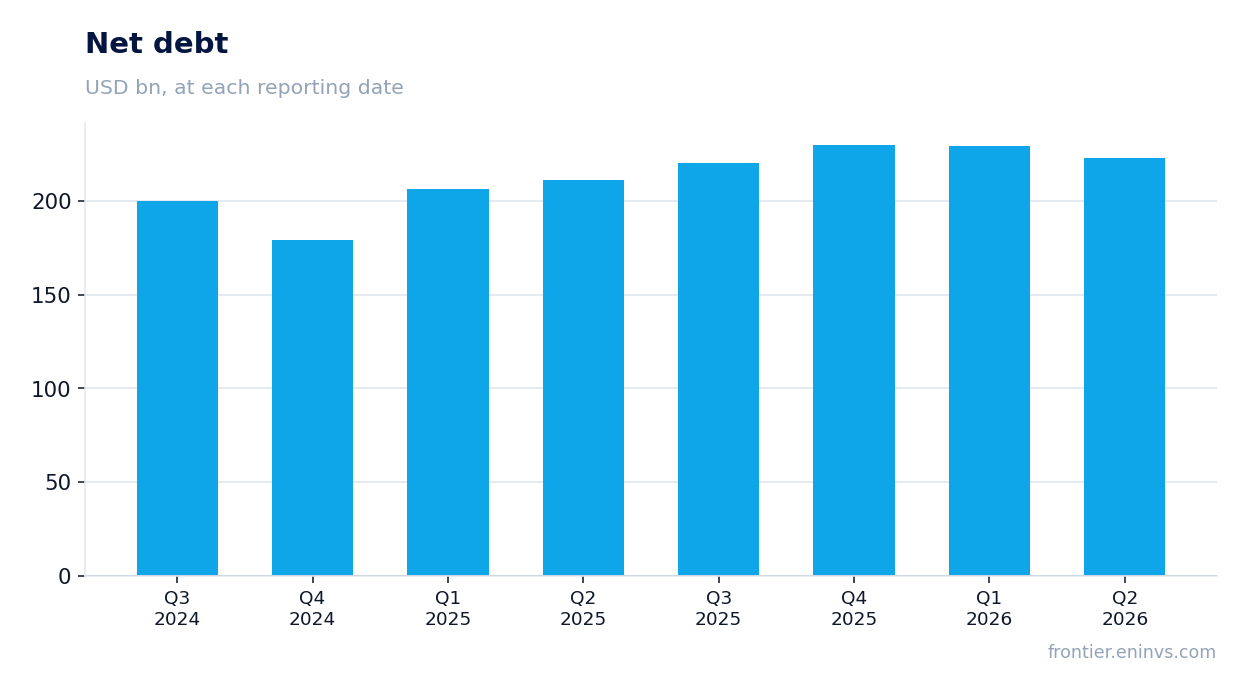
Debt burden decreased in the quarter but increased by $12.8 billion over the year
Net debt at the end of June was $223.0 billion, down $5.6 billion from the end of March. However, over the last twelve months, debt increased by $12.8 billion.
The increase in debt is related to balance sheet growth: assets rose 24% year-over-year to $1.675 trillion, mainly due to loan growth (+18%) and securities. At the same time, bank capital is also growing – total equity increased 8% over the year, and the Common Equity Tier 1 (CET1) ratio under the advanced approach stands at 16.2%.
Bank capital is growing, ROE exceeds 19%
Return on equity (ROE) for the last twelve months was 19.4%. In Q2, ROE was even higher at 20.7% (vs. 13.9% a year ago). Book value per share rose to $67.80.
Tier 1 capital increased 10% year-over-year to $97.2 billion, and capital adequacy remains high: CET1 ratio under the standardized approach is 14.8%, under the advanced approach – 16.2%. This gives the bank room to expand lending and pay dividends.
Institutional Securities segment doubled profit thanks to investment banking boom
Institutional Securities segment profit in Q2 grew 99% to $3.19 billion. The driver was investment banking: underwriting revenue rose 59%, advisory – 57%.
Trading also showed strong dynamics: equity revenue grew 69%, fixed income – 13%. The segment's share of the bank's total profit was 57%.
Valuation on the latest reported figures
| Metric | Value |
|---|---|
| Operating cash flow (LTM) | -17.9 bn |
| ROE | 19.4% |
Bottom line
Morgan Stanley delivered a strong quarter: revenue accelerated to 27%, EBITDA margin reached 40.1%, and net profit rose 58%. The main driver was the investment banking boom, which doubled Institutional Securities segment profit. However, operating cash flow remains negative, and debt increased by $12.8 billion over the year – the bank is funding balance sheet growth with borrowed funds. At the current valuation, the shares look rather attractive, but investors should watch OCF dynamics and the sustainability of investment banking revenues.
Open the company's financial profile MS →
See also: market overview · valuation map · stock screeners