Matador Resources: profit up 2.6x, but capex growth swallowed nearly all of it
On 5 August Matador Resources Company reported second-quarter 2026 results. Revenue rose 31.1% year on year to USD 1,173.4m, EBITDA by 50.9% to 892.4m and net profit by 160.0% to 390.7m. The EBITDA margin climbed to 76.1% from 66.0% a year earlier, while quarterly capex reached USD 1,167.2m, nearly triple the year-earlier figure. At USD 48.8 before the release the stock looks rather attractive: EV/EBITDA LTM of 3.53 against a three-year average of 3.17, net debt at 0.23x EBITDA LTM, and the portal model putting fair value 43% below the market price.
Key takeaways
— Revenue rose 31.1% year on year, and almost all of the gain came from oil at USD 98.16 a barrel
— The EBITDA margin climbed to 76.1% on a one-off derivatives effect, not just price
— Net profit grew 2.6x, but USD 85.5m of it was an unrealised derivatives revaluation
— Quarterly capex rose to USD 1,167.2m and nearly tripled operating cash flow
— Leverage stands at 0.23x EBITDA LTM, but absolute net debt rose to USD 912.7m
— Dividend yield of 2.47% on a payout that grows with profit
— EV/EBITDA of 3.53 against a three-year average of 3.17, while the portal model implies 43% downside
Attractiveness
Key figures, USD bn
| Metric | Q2 2025 | Q2 2026 | Change |
|---|---|---|---|
| Revenue | 0.90 | 1.17 | +31.1% |
| EBITDA | 0.59 | 0.89 | +50.9% |
| Operating profit | 0.29 | 0.58 | +100.0% |
| Net profit | 0.15 | 0.39 | +160.0% |
| Operating cash flow | 0.50 | 0.94 | +87.0% |
| Capex | 0.49 | 1.17 | +137.5% |
| EBITDA margin | 66.0% | 76.1% | +10.1 pp |
| Net margin | 16.8% | 33.3% | +16.5 pp |
Revenue rose 31.1% year on year, and almost all of the gain came from oil at USD 98.16 a barrel
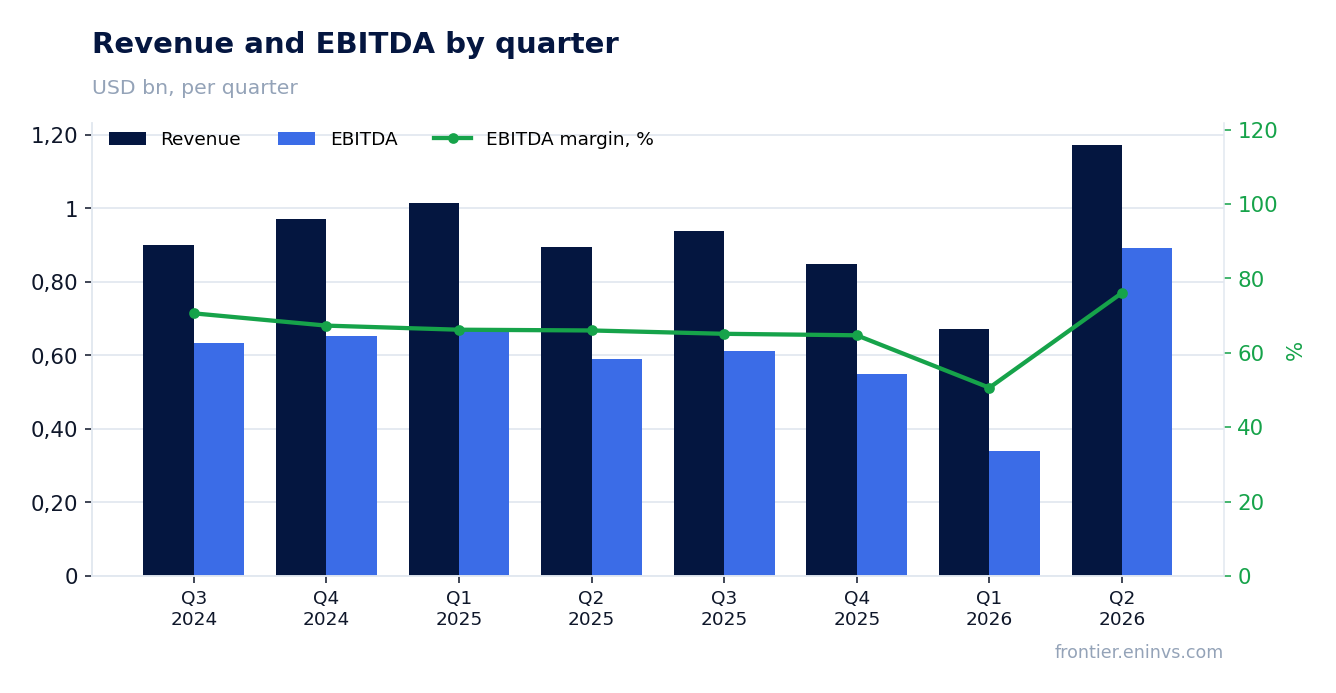
Second-quarter 2026 revenue came to USD 1,173.4m against USD 895.3m a year earlier, up 31.1%. This reverses two quarters of decline: in Q1 2026 revenue fell 33.8% year on year, in Q4 2025 it fell 12.6%. The main driver was the oil price: the average realised price before derivatives rose to USD 98.16 a barrel from USD 64.34 a year earlier, up 53%.
Oil production rose 3% year on year to 126,106 barrels a day, above the upper end of the May guidance of 125,000 barrels. Gas worked the other way: the average realised price before derivatives went to minus USD 0.79 per thousand cubic feet from plus USD 2.05 a year earlier, down 139%. The negative gas price reflects weak Waha pricing, which led the company to voluntarily shut in some volumes.
Total production averaged 215,631 barrels of oil equivalent a day, 3% above the year-earlier level and 3% above the midpoint of its own guidance. The company notes that Waha-related shut-ins and third-party plant maintenance removed about 9,900 barrels a day, slightly less than the 10,000 barrels it had expected. Oil accounted for 58% of output.
The EBITDA margin climbed to 76.1% on a one-off derivatives effect, not just price
Second-quarter 2026 EBITDA came to USD 892.4m, up 50.9% year on year, with the margin rising to 76.1% from 66.0% a year earlier. That level is unusual even for an oil-weighted producer. Part of the explanation lies in the revenue mix: alongside USD 1,087.6m of oil and gas revenue, the report includes an unrealised derivatives gain of USD 85.5m, which is not tied to current production.
Operating costs per barrel rose to USD 32.90 from USD 29.91 a year earlier. The main contributors were taxes other than income at USD 5.24 per barrel versus USD 3.58, and midstream operating costs at USD 3.09 versus USD 2.34. Lease operating costs came in better than expected at USD 5.45 per barrel against guidance of USD 5.60, on lower repair and maintenance spending.
The gap between the oil price with and without derivatives is wide: USD 83.19 versus USD 98.16 a barrel. That means part of the price gain was locked in by hedges at lower levels, and the margin would be lower without the derivatives line. Sustaining a margin above 70% depends on oil holding near USD 98.
Net profit grew 2.6x, but USD 85.5m of it was an unrealised derivatives revaluation
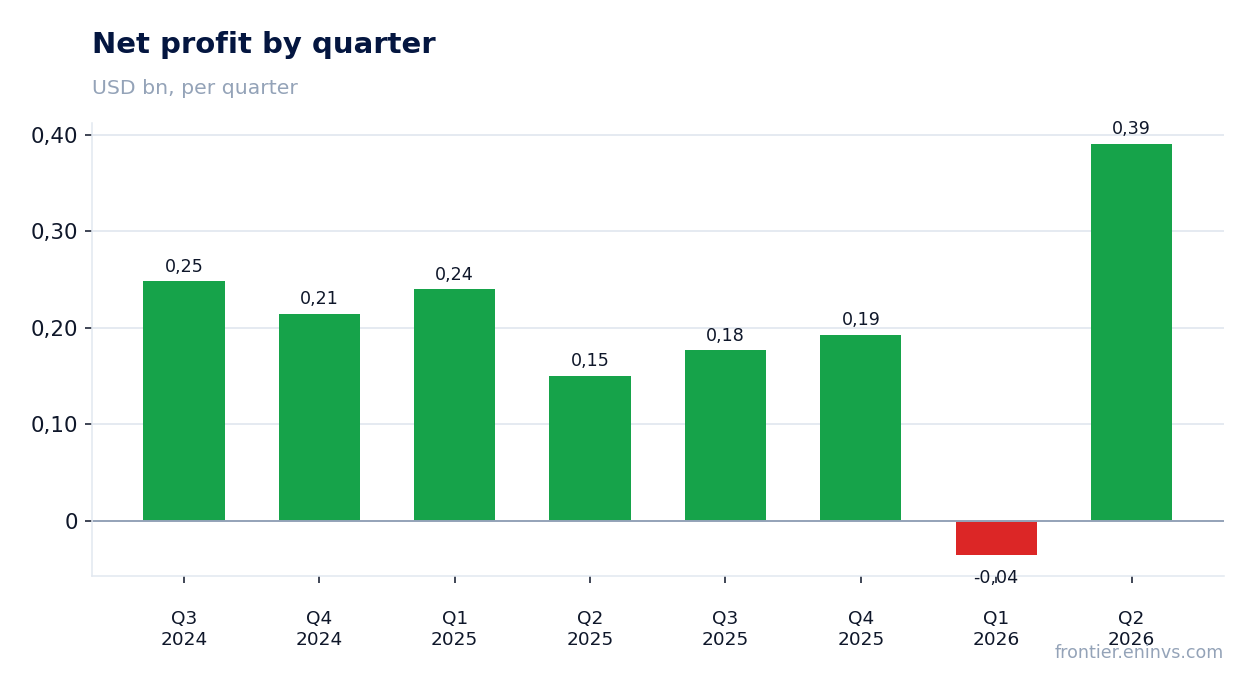
Second-quarter 2026 net profit came to USD 390.7m against USD 150.2m a year earlier, up 160.0%. The net margin rose to 33.3% from 16.8%. However, the income statement includes an unrealised derivatives gain of USD 85.5m, versus a loss of USD 37.3m a year earlier. Without that one-off, profit would have been materially lower.
Adjusted net income, which the company reports separately, was USD 324.6m against USD 190.9m a year earlier. The gap between net and adjusted profit is USD 66.1m, mostly the same derivatives revaluation. Adjusted earnings per diluted share were USD 2.61 versus USD 1.53 a year earlier.
Operating profit rose to USD 577.3m from USD 288.7m, exactly double. Interest expense increased to USD 60.8m from USD 53.3m, reflecting higher debt. The income tax charge was USD 106.8m, of which USD 106.6m was deferred, meaning almost no cash taxes were paid.
Quarterly capex rose to USD 1,167.2m and nearly tripled operating cash flow
Second-quarter 2026 operating cash flow was USD 937.1m against USD 501.0m a year earlier. That is a strong result, but capex rose to USD 1,167.2m from USD 491.4m. As a result, free cash flow was negative and the company covered the gap with borrowings. The report states adjusted free cash flow of USD 303.2m, but that measure is calculated differently and excludes part of the spending.
The capex increase is tied to acquisitions: in May 2026 the company bought 5,154 federal acres, in June–July it closed the Cardinal Midstream purchase, and in July it agreed to buy Paloma and Ridge Runner. The second quarter absorbed the federal lease sale costs as well as accelerated drilling. The company raised its 2026 capex guidance to USD 1,625–1,725m from USD 1,450–1,550m.
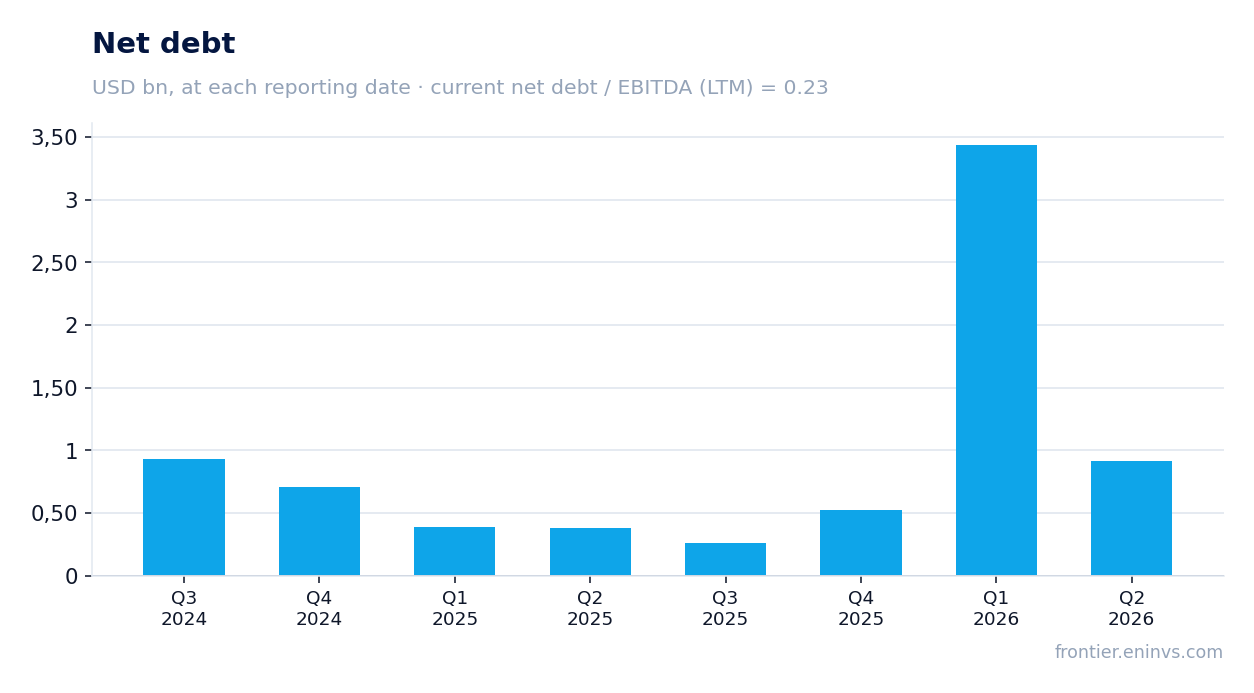
Debt rose: net debt at quarter-end was USD 912.7m against USD 529.3m at end-2025. The company repaid over USD 200m on the credit line tied to the federal lease sale and increased RBL borrowings. Net debt to EBITDA LTM is 0.23, still a low level, but the absolute debt is growing along with the acquisitions.
Leverage stands at 0.23x EBITDA LTM, but absolute net debt rose to USD 912.7m
Net debt at end-Q2 2026 was USD 912.7m, or 0.23x EBITDA for the trailing twelve months. That is a low level, giving the company room to fund acquisitions. However, net debt rose from USD 529.3m at end-2025, and in Q1 2026 it reached USD 3,438.5m at the peak of borrowings for the federal lease sale.
Interest expense was USD 60.8m for the quarter and USD 112.3m for the half-year. With EBITDA LTM of USD 2,282.8m, interest coverage remains high. The company targets a 1.0x debt-to-EBITDA ratio by end-2027, funded mainly by free cash flow.
The debt structure includes USD 939.0m under the credit agreement, USD 911.0m under the San Mateo credit facility and USD 2,366.4m of senior unsecured notes. San Mateo is consolidated, but Matador owns only 51%, so part of the debt sits with the partner's share. That eases the burden on shareholders but does not remove the obligation.
Dividend yield of 2.47% on a payout that grows with profit
The trailing twelve-month dividend yield is 2.47%. The company does not disclose the quarterly dividend in this release, but it confirms its commitment to returning capital: in Q2 it repurchased 225,000 shares for USD 11m at an average price of USD 49.59. Dividends and buybacks are part of one policy, and their total size depends on free cash flow.
Our estimate for the 2026 dividend is based on current profit and the established payout practice. With net profit of USD 723.7m over the last twelve months and a payout ratio of about 25%, the annual dividend could be around USD 180m, or roughly USD 1.45 per share. That implies a yield of about 3% at the current price. The estimate is sensitive to the oil price and to how much of profit is stripped of one-offs.
The key risk to the dividend is rising capex. The company raised its 2026 capex guidance to USD 1,625–1,725m and plans to use part of free cash flow to repay debt. If oil falls below USD 80, free cash flow may not cover both the dividend and the drilling programme. At USD 48.8 the 2.47% yield is lower than it would be at a higher share price, but still above many alternatives given the low leverage.
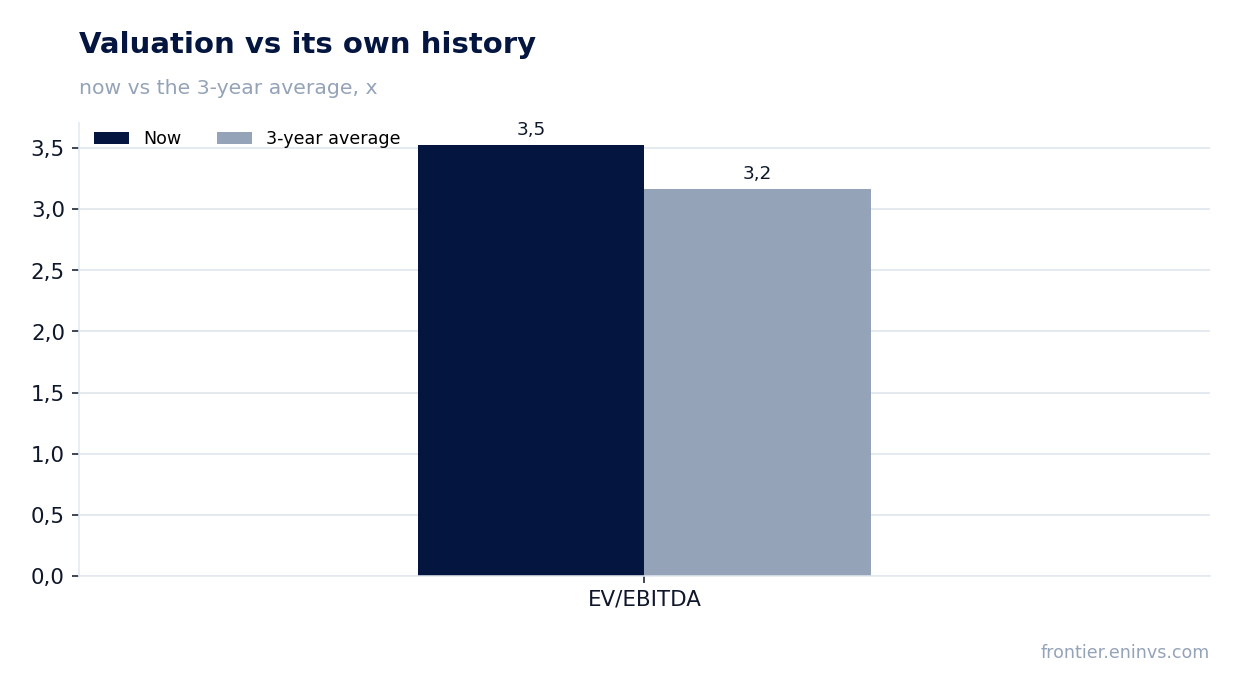
EV/EBITDA of 3.53 against a three-year average of 3.17, while the portal model implies 43% downside
EV/EBITDA for the trailing twelve months is 3.53, above the three-year average of 3.17. That means the market values the company slightly above its own recent history despite the strong report. The trailing P/E is 10.40, somewhat below historical levels for oil companies, but no own-history P/E comparison is given in the facts.
The portal model, which reprices EBITDA at current commodity prices and a target EV/EBITDA, puts fair value 43% below the current market price. This is our own estimate, not a market consensus. It reflects the possibility that the current oil price near USD 98 is above a sustainable level, and that profit and EBITDA would fall if it normalises.
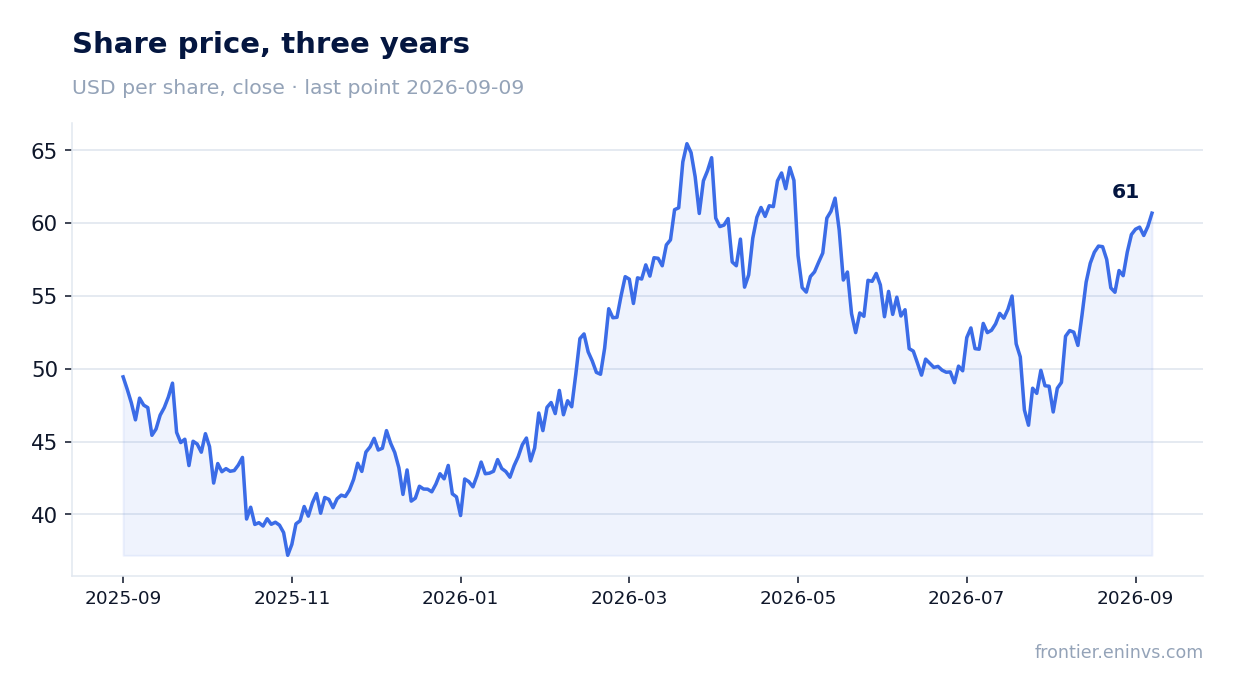
Since the report on 5 August the stock has risen 24.3% to 9 September, though it fell 3.6% on the release day. The market reacted to strong operating results and raised production guidance, but not to the capex increase. At USD 48.8 and EV/EBITDA of 3.53 the stock looks rather attractive if oil prices stay high, and rather unattractive if they revert to average levels.
Valuation on the latest reported figures
| Metric | Value |
|---|---|
| Market cap | 7.52 bn USD |
| P/E (LTM) | 10.4 |
| EV/EBITDA (LTM) | 3.5 |
| P/B | 1.33 |
| Net debt / EBITDA (LTM) | 0.23 |
| Operating cash flow (LTM) | 2.40 bn |
| ROE | 27.1% |
| Dividend yield (12m) | 2.5% |
| EV/EBITDA, 3-year average | 3.2 |
Bottom line
The Q2 2026 report is operationally strong: oil production rose 3% to 126,106 barrels a day, revenue by 31.1%, EBITDA by 50.9%, and the margin climbed to 76.1%. However, a significant part of profit – USD 85.5m – came from an unrealised derivatives revaluation, while capex of USD 1,167.2m nearly tripled operating cash flow, pushing net debt up to USD 912.7m. The 2.47% dividend yield and low leverage of 0.23x EBITDA LTM support the stock, but EV/EBITDA of 3.53 is above the three-year average of 3.17, and the portal model implies 43% downside. At USD 48.8 the stock looks rather attractive for those who believe high oil prices will persist, but a cautious investor should note that current profit depends heavily on a price level that may prove temporary.
Open the company's financial profile MTDR →
See also: market overview · valuation map · stock screeners