Murphy Oil: profit up tenfold on expensive oil, but half of quarterly cash flow absorbed by expanded capex
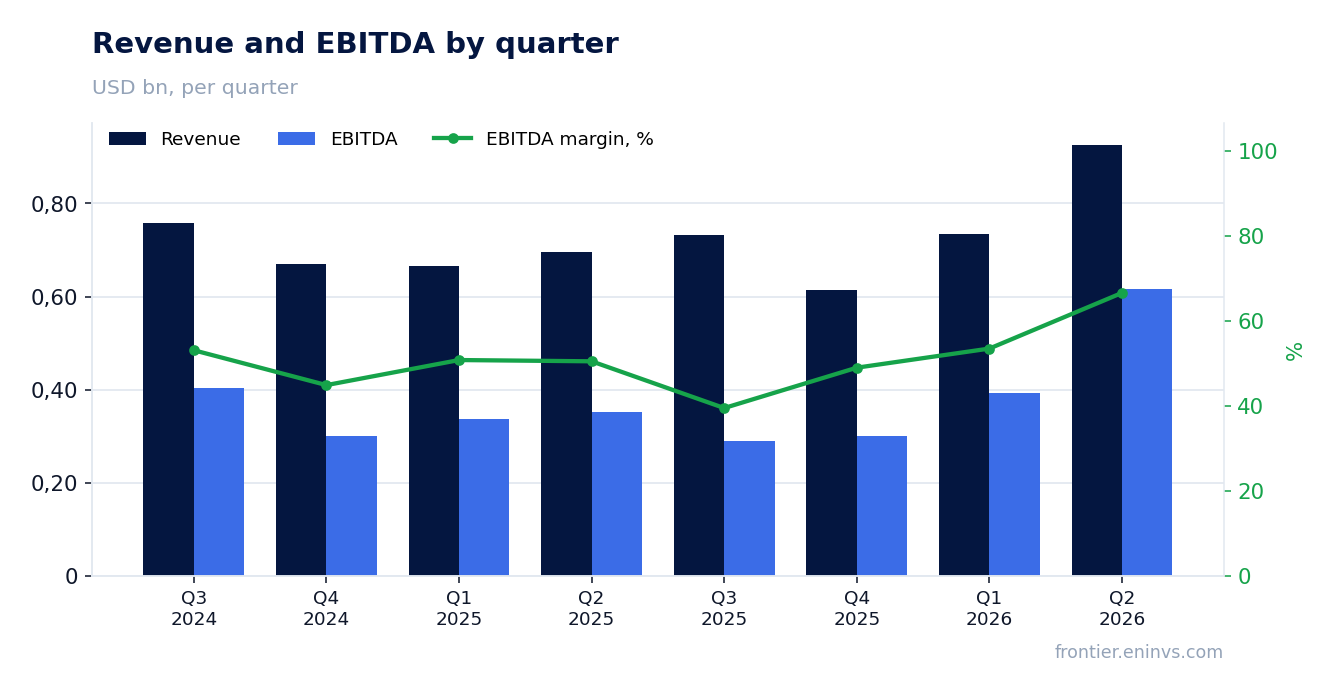
On August 5, Murphy Oil Corporation released its second-quarter 2026 results. Revenue rose 33.2% year on year to USD 926.3 million, EBITDA grew 68.6% to USD 616.8 million, and net income increased 10.4-fold to USD 232.2 million. The EBITDA margin climbed to 64.0% from 50.5% a year earlier, while free cash flow reached USD 110.0 million. Capital expenditure rose to USD 476.0 million, and the company raised its full-year programme midpoint from USD 1.25 billion to USD 1.55 billion. The shares fell 6.1% on the release, and with an EV/EBITDA of 4.56 against its own three-year average of 4.25 the stock looks neutral: the strong quarter is already priced in, and higher investment delays cash returns to shareholders.
Key takeaways
— Revenue rose 33.2% on expensive oil, not on volumes: production fell to 169.0 thousand barrels of oil equivalent per day
— EBITDA margin climbed to 64.0% thanks to a collapse in lease operating expenses and lower transportation costs
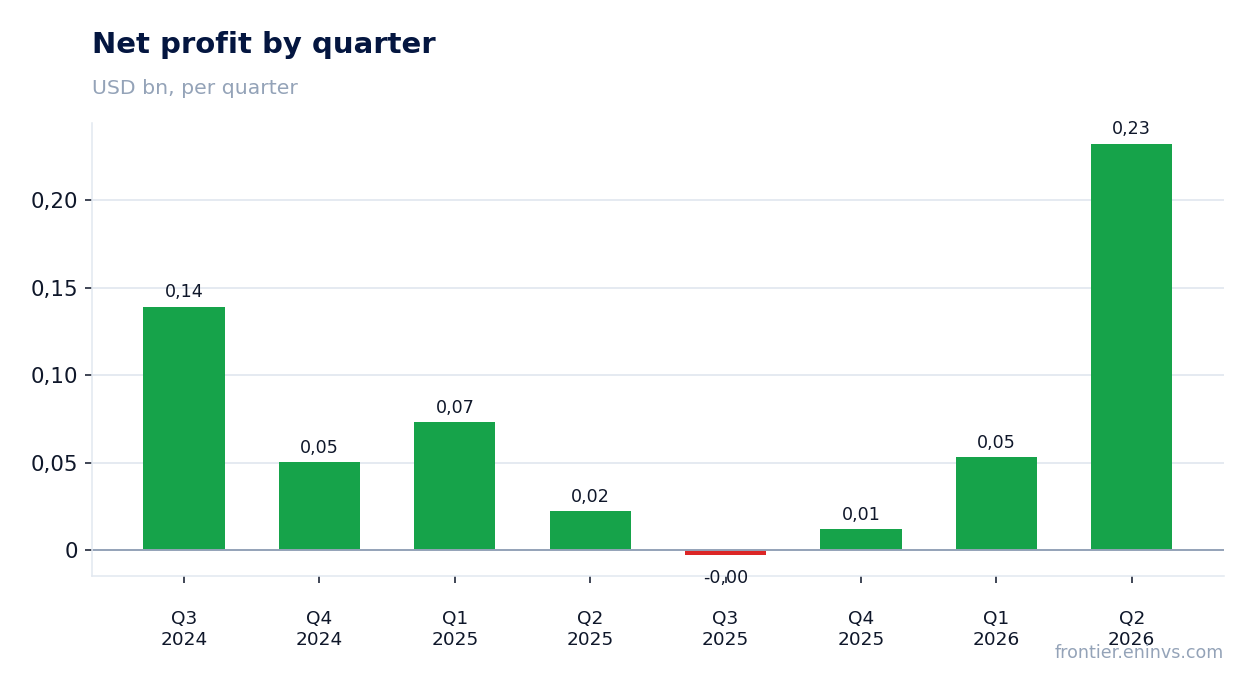
— Net income of USD 232.2 million includes one-off items; adjusted net income was USD 225.8 million
— Free cash flow of USD 110.0 million was half of operating cash flow as capex rose to USD 476.0 million
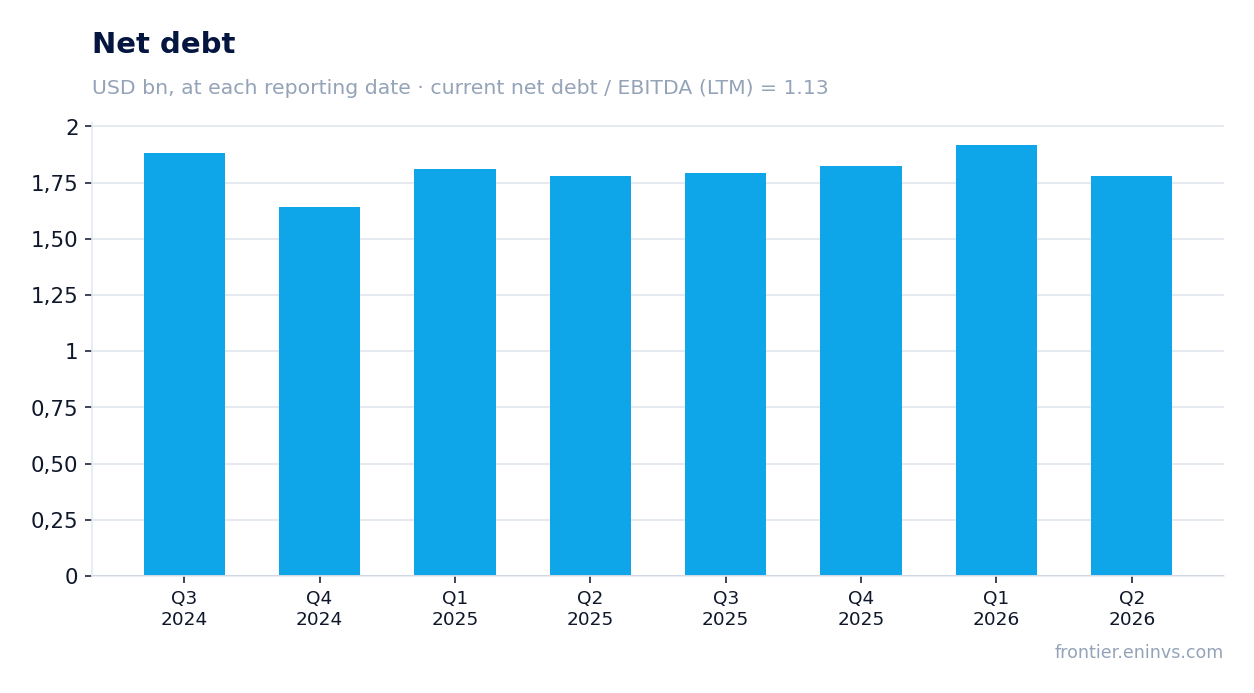
— Leverage at 1.13x EBITDA LTM remains moderate, but the company expanded its drilling programme to USD 1.55 billion
— The dividend of USD 0.35 per share yields 3.58%, but higher capex may limit its growth
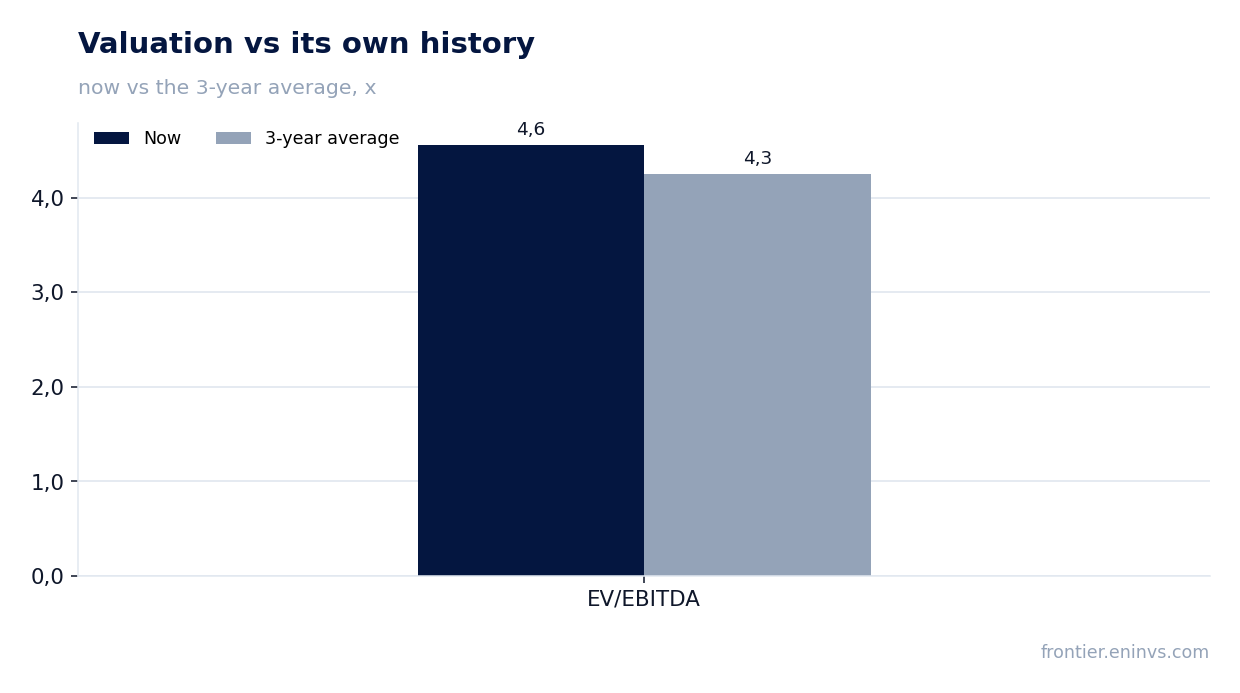
— EV/EBITDA of 4.56 versus the three-year average of 4.25 – the stock trades slightly above its own history
Attractiveness
Key figures, USD bn
| Metric | Q2 2025 | Q2 2026 | Change |
|---|---|---|---|
| Revenue | 0.70 | 0.93 | +33.2% |
| EBITDA | 0.35 | 0.59 | +68.6% |
| Operating profit | 0.09 | 0.35 | +284.6% |
| Net profit | 0.02 | 0.23 | +942.1% |
| Operating cash flow | 0.36 | 0.66 | +83.2% |
| Capex | 0.31 | 0.48 | +54.8% |
| EBITDA margin | 50.5% | 64.0% | +13.5 pp |
| Net margin | 3.2% | 25.1% | +21.9 pp |
Revenue rose 33.2% on expensive oil, not on volumes: production fell to 169.0 thousand barrels of oil equivalent per day
Revenue in the second quarter of 2026 reached USD 926.3 million, up 33.2% year on year. This growth was driven entirely by prices: the average US onshore oil price rose to USD 99.55 per barrel from USD 64.00 a year earlier, and in Canada to USD 103.88 from USD 64.76. At the same time, total production fell to 169.0 thousand barrels of oil equivalent per day from 189.7 thousand a year earlier, mainly due to a drop in Tupper Montney gas production to 355.7 million cubic feet per day from 454.3 million.
Oil production also declined: in the US Gulf of America it fell to 50.9 thousand barrels per day from 58.8 thousand, partly offset by higher onshore production in Canada. The company noted that production was at the upper end of quarterly guidance due to strong well performance at Tupper Montney, but volumes are still lower year on year.
Thus, revenue growth is a story of prices, not operational expansion. For the result to be sustainable, prices must remain high, as the company's own volumes are falling.
EBITDA margin climbed to 64.0% thanks to a collapse in lease operating expenses and lower transportation costs
EBITDA in the second quarter of 2026 was USD 616.8 million, up 68.6% year on year, and the EBITDA margin rose to 64.0% from 50.5%. Such margin expansion with revenue growing only 33.2% means costs declined in absolute terms. Lease operating expenses fell to USD 143.7 million from USD 215.6 million a year earlier, and transportation, gathering and processing costs dropped to USD 45.3 million from USD 54.1 million. Per barrel of oil equivalent, lease operating expenses declined to USD 8.83 from USD 11.80.
The main contribution to lower unit costs came from offshore projects: in the Gulf of America lease operating expenses fell to USD 10.43 per barrel from USD 20.91, likely due to a change in production mix or completion of costly work. Onshore US, unit costs actually rose to USD 9.60 from USD 8.20.
Whether the cost reduction was one-off or reflects a sustainable improvement is an open question. If lease operating expenses return to previous levels, the EBITDA margin could compress even if oil prices hold.
Net income of USD 232.2 million includes one-off items; adjusted net income was USD 225.8 million
Net income attributable to Murphy in the second quarter of 2026 was USD 232.2 million, or USD 1.59 per diluted share, versus USD 22.3 million a year earlier. However, the report states that adjusted net income from continuing operations was USD 225.8 million, or USD 1.55 per share. The difference of USD 6.8 million was mainly due to a foreign exchange gain of USD 9.2 million before tax, partly offset by tax.
A year earlier, the company had a foreign exchange loss of USD 34.3 million, which depressed the comparison base. Thus, the 10.4-fold increase in net income is partly explained by the reversal of foreign exchange effects, not only by operational improvements. Adjusted net income rose from USD 38.5 million a year earlier, a 5.9-fold increase.
For assessing the sustainability of the business, the adjusted figure, which strips out currency fluctuations, is more important. It also grew many times over, but less impressively than headline net income.
Free cash flow of USD 110.0 million was half of operating cash flow as capex rose to USD 476.0 million
Operating cash flow from continuing operations in the second quarter of 2026 was USD 655.9 million, significantly higher than USD 358.1 million a year earlier. However, capital expenditure rose to USD 476.0 million from USD 250.8 million, including exploration drilling costs. As a result, free cash flow was only USD 110.0 million, though still better than USD 17.8 million a year earlier.
The company raised its full-year capital programme midpoint from USD 1.25 billion to USD 1.55 billion to accelerate high-impact exploration and development projects. This means free cash flow may remain under pressure in the second half. At the same time, liquidity remains substantial: USD 2.48 billion, including an undrawn USD 2.00 billion credit facility and USD 480 million of cash.
Higher capex is a bet on future production, but it reduces current cash returns to shareholders. If new projects do not deliver rapid growth, free cash flow may remain modest.
Leverage at 1.13x EBITDA LTM remains moderate, but the company expanded its drilling programme to USD 1.55 billion
Net debt at the end of the second quarter of 2026 was USD 1.78 billion, equivalent to 1.13x EBITDA for the trailing twelve months. This is a moderate level for an oil and gas company. Total debt of USD 1.55 billion consists of long-term fixed-rate notes with an average coupon of 6.3% and an average maturity of 8.7 years, reducing refinancing risk.
The company does not disclose the previous value of the net debt/EBITDA ratio, so it cannot be said that leverage rose or fell. However, absolute net debt declined slightly versus the previous reporting date – by USD 0.1 billion – and over the last 12 months by USD 0.0 billion. This indicates a stable debt position.
The expansion of the capital programme to USD 1.55 billion could increase debt if oil prices fall. But at current prices and moderate leverage, the risk appears manageable.
The dividend of USD 0.35 per share yields 3.58%, but higher capex may limit its growth
In the second quarter of 2026, Murphy Oil paid a dividend of USD 0.35 per share, 7.7% higher than USD 0.325 a year earlier. At the pre-release share price of USD 38.38, the trailing 12-month dividend yield is 3.58%. This is a moderate yield, which may be attractive relative to current interest rates but is not exceptional.
The company has not announced a dividend increase for the current year, but historically it has raised payouts. Our estimate for the 2026 dividend is about USD 1.40 per share, based on the quarterly payment of USD 0.35, implying a yield of 3.65% at the current price. However, this estimate depends on earnings and cash flow, which can be volatile due to oil prices.
The increase in capital expenditure to USD 1.55 billion could limit the scope for dividend increases. If free cash flow remains around USD 110 million per quarter, the company can cover dividends, but raising the payout may require additional debt or cuts to share repurchases.
EV/EBITDA of 4.56 versus the three-year average of 4.25 – the stock trades slightly above its own history
At the time of the report, the trailing 12-month EV/EBITDA was 4.56, slightly above the company's three-year average of 4.25. This means the stock is valued a bit more expensively than usual relative to its EBITDA. The trailing P/E is 18.75, which also does not look cheap for an oil and gas company, but ROE of 17.9% supports the valuation.
Our portal model, which re-prices EBITDA at current commodity prices and the target EV/EBITDA, indicates a 39% downside to fair value. This is the portal's own calculation, not a consensus. It reflects the risk that current high oil prices are not sustainable and that profit and valuation could decline if they normalise.
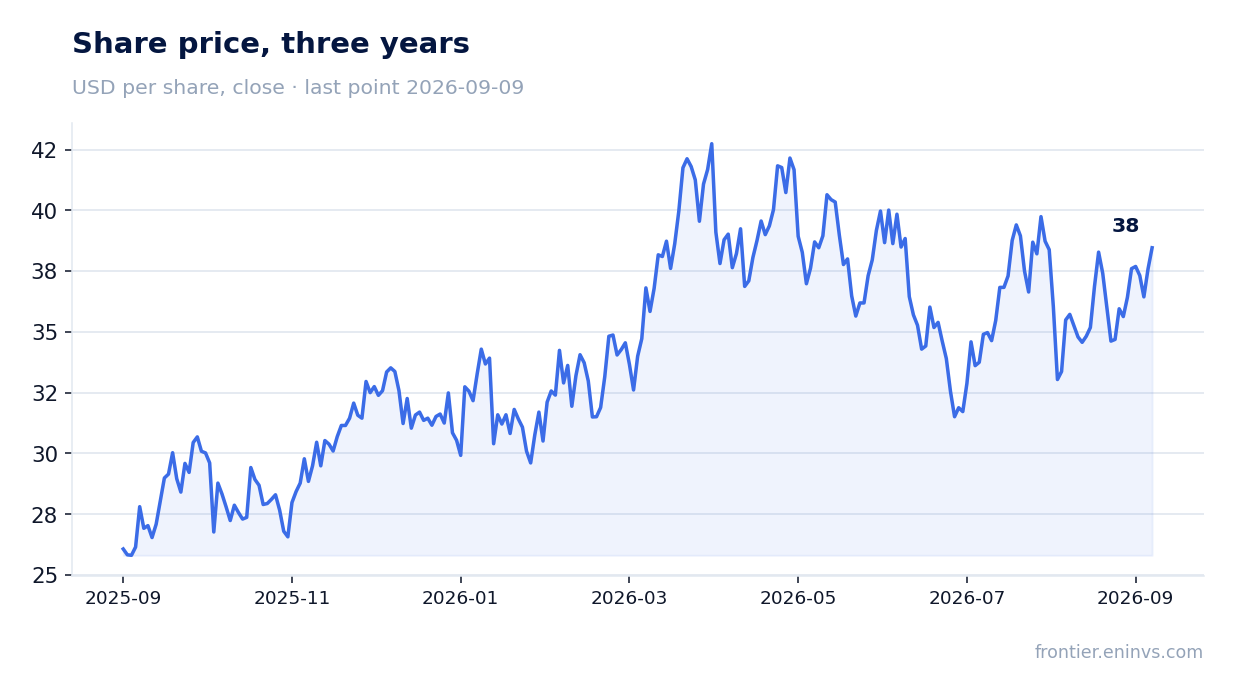
The stock fell 6.1% on the release day but has since gained 0.2% through September 9. The market likely acknowledged the strong quarter but is concerned about higher capex and falling production. At the current valuation, the stock looks fairly valued, without an obvious margin of safety.
Valuation on the latest reported figures
| Metric | Value |
|---|---|
| Market cap | 5.51 bn USD |
| P/E (LTM) | 18.7 |
| EV/EBITDA (LTM) | 4.6 |
| P/B | 1.08 |
| Net debt / EBITDA (LTM) | 1.13 |
| Operating cash flow (LTM) | 1.20 bn |
| ROE | 17.9% |
| Dividend yield (12m) | 3.6% |
| EV/EBITDA, 3-year average | 4.3 |
Bottom line
Bottom line: the quarter was very strong in terms of profit and margin, but this result rests on high oil prices, not on production growth. A one-off foreign exchange gain and lower unit costs enhanced the picture, yet free cash flow remains modest due to the expanded investment programme. Leverage at 1.13x EBITDA LTM is moderate, and the 3.58% dividend looks sustainable, but its growth is limited. The stock trades slightly above its three-year average EV/EBITDA, and the portal model indicates 39% downside. At the current price, the share looks neutral: its strengths are already priced in, and the risks of falling prices and rising costs are not compensated.
Open the company's financial profile MUR →
See also: market overview · valuation map · stock screeners