Nebius: revenue soars 454%, but EBITDA margin turns negative amid massive capex
On August 25, Nebius reported Q2 2026 results: revenue surged 454% YoY to $582.3 million, EBITDA was $118.4 million versus a loss a year earlier, but net profit turned negative at $190.4 million. The shares look rather attractive amid explosive growth and massive investments, but caution is warranted due to high leverage and negative margins.
Key takeaways
— Nebius's Q2 2026 revenue grew 454% YoY to $582.3 million, driven by expansion of cloud and AI services.
— EBITDA turned positive for the first time in four quarters – $118.4 million, with a margin of 20.3%.
— Net loss of $190.4 million reflects rising operating expenses and depreciation after massive investments.
— Operating cash flow reached $2,246.1 million in Q2, but capex of $5,657.4 million led to negative free cash flow.
— Net debt rose to $503.6 million at quarter-end, with net debt/EBITDA of 2.5 for the trailing twelve months.
— Capex over the trailing twelve months totaled $11.6 billion, far exceeding operating cash flow of $384.8 million.
— At a current market cap of $65.3 billion and EV/EBITDA of 366.4, shares trade at a premium to historical levels.
Attractiveness
Key figures, USD bn
| Metric | Q2 2025 | Q2 2026 | Change |
|---|---|---|---|
| Revenue | 0.11 | 0.58 | +454.0% |
| EBITDA | 0.59 | 0.12 | -80.0% |
| Operating profit | -0.11 | -0.18 | — |
| Net profit | 0.58 | -0.19 | -132.6% |
| Operating cash flow | -0.17 | 2.25 | to profit |
| Capex | 0.51 | 5.66 | +1008.0% |
| EBITDA margin | 564.0% | 20.3% | -543.7 pp |
| Net margin | 556.0% | -32.7% | -588.7 pp |
Nebius's Q2 2026 revenue grew 454% YoY to $582.3 million, driven by expansion of cloud and AI services.
In Q2 2026, Nebius increased revenue to $582.3 million, up 454% from the same period last year, when it stood at $105.1 million. Growth accelerated compared to previous quarters: Q1 2026 revenue reached $399.0 million, and Q4 2025 was $227.7 million.
The main driver was the expansion of the cloud platform and AI services, consistent with the company's strategy to monetize AI infrastructure. Sequential dynamics are also impressive: revenue grew 46% from Q1 2026, indicating sustained strong demand.
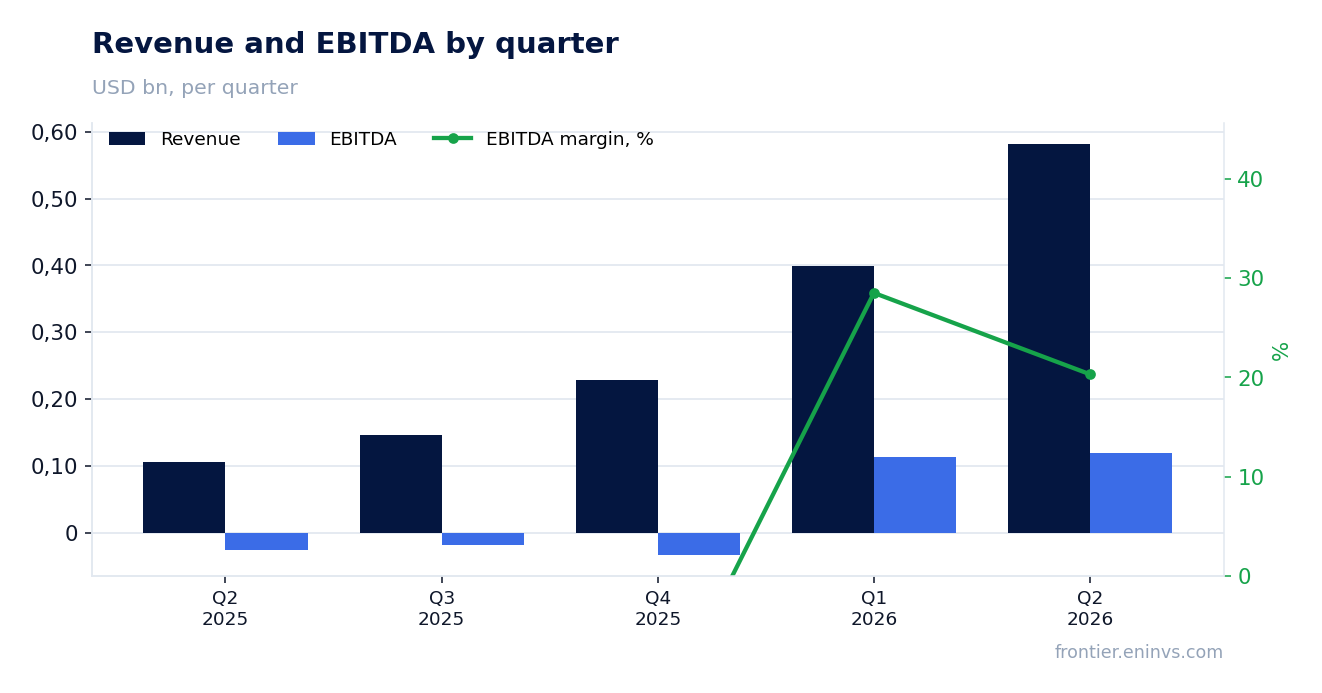
EBITDA turned positive for the first time in four quarters – $118.4 million, with a margin of 20.3%.
In Q2 2026, EBITDA reached $118.4 million versus a loss of $26.5 million a year earlier. EBITDA margin hit 20.3%, a significant improvement from previous quarters when it was negative: Q1 2026 EBITDA was $113.8 million, and Q4 2025 was -$34.1 million.
The turnaround is explained by operating leverage: rapid revenue growth outpaces operating expense growth. However, EBITDA excludes depreciation and interest, which remain significant due to massive investments.
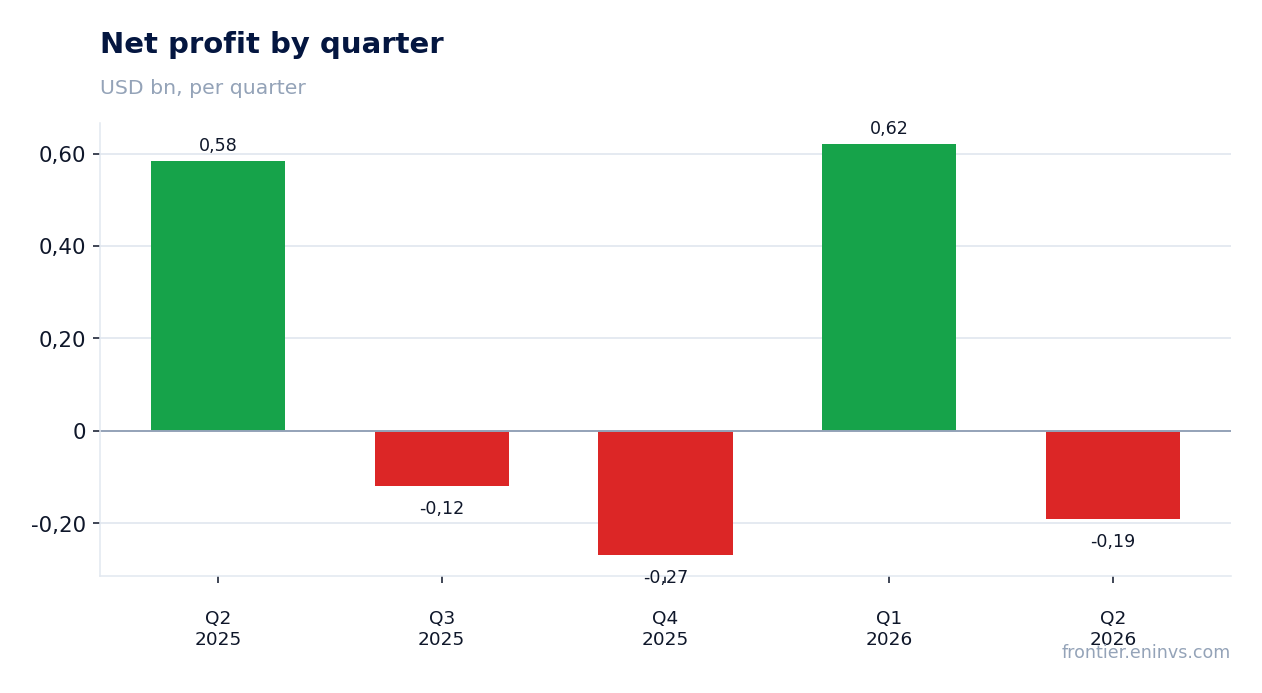
Net loss of $190.4 million reflects rising operating expenses and depreciation after massive investments.
Despite positive EBITDA, Nebius ended the quarter with a net loss of $190.4 million versus a profit of $584.4 million a year earlier. Operating profit was also negative at -$175.9 million, indicating high depreciation charges and development expenses.
The loss is partly due to a high base effect: Q2 2025 net profit included one-off gains. In the current quarter, the company continues to invest heavily in capacity expansion, weighing on the bottom line.
Operating cash flow reached $2,246.1 million in Q2, but capex of $5,657.4 million led to negative free cash flow.
In Q2 2026, Nebius's operating cash flow was $2,246.1 million, significantly higher than in previous periods (Q1: $2,258.0 million, Q4 2025: $834.3 million). However, capex reached $5,657.4 million, resulting in negative free cash flow of about $3.4 billion.
The company is in a phase of intensive data center construction and equipment purchases, requiring huge investments. Over the trailing twelve months, capex totaled about $11.6 billion, while operating cash flow for the same period was only $384.8 million. This means the company is financing investments through debt and accumulated funds.
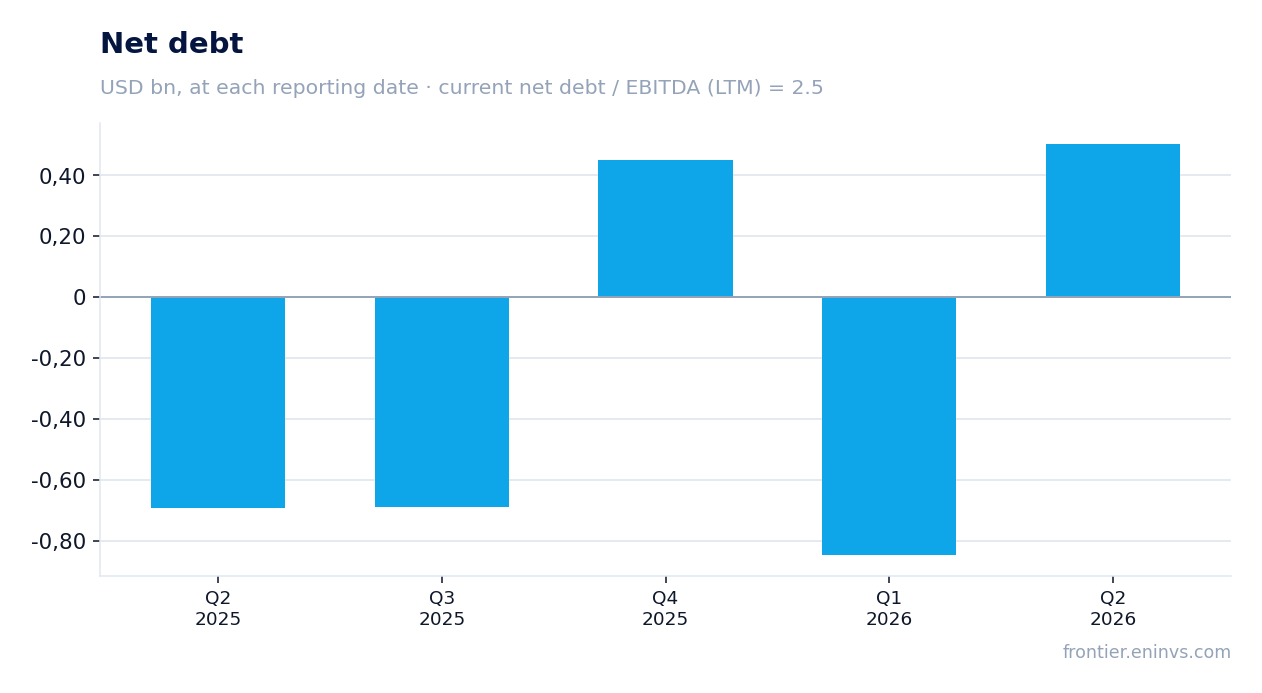
Net debt rose to $503.6 million at quarter-end, with net debt/EBITDA of 2.5 for the trailing twelve months.
At the end of Q2 2026, Nebius's net debt was $503.6 million versus a negative value (net cash position) of $847.8 million in Q1. The increase in debt is related to financing capital expenditures.
The net debt/EBITDA ratio for the trailing twelve months is 2.5, a moderate level, but given negative free cash flow, leverage may continue to rise. Net debt increased by $1.4 billion during the quarter and by $1.2 billion over twelve months.
Capex over the trailing twelve months totaled $11.6 billion, far exceeding operating cash flow of $384.8 million.
Over the trailing twelve months (Q3 2025 through Q2 2026), Nebius's capex totaled approximately $11.6 billion, while operating cash flow for the same period was only $384.8 million. This creates a significant gap, which the company covers through debt and previously accumulated funds.
The scale of investment reflects Nebius's ambitions to build the largest AI infrastructure in Europe, but raises questions about payback timelines. While revenue is growing faster than operating expenses, achieving positive free cash flow will require either a slowdown in capex or further revenue growth.
At a current market cap of $65.3 billion and EV/EBITDA of 366.4, shares trade at a premium to historical levels.
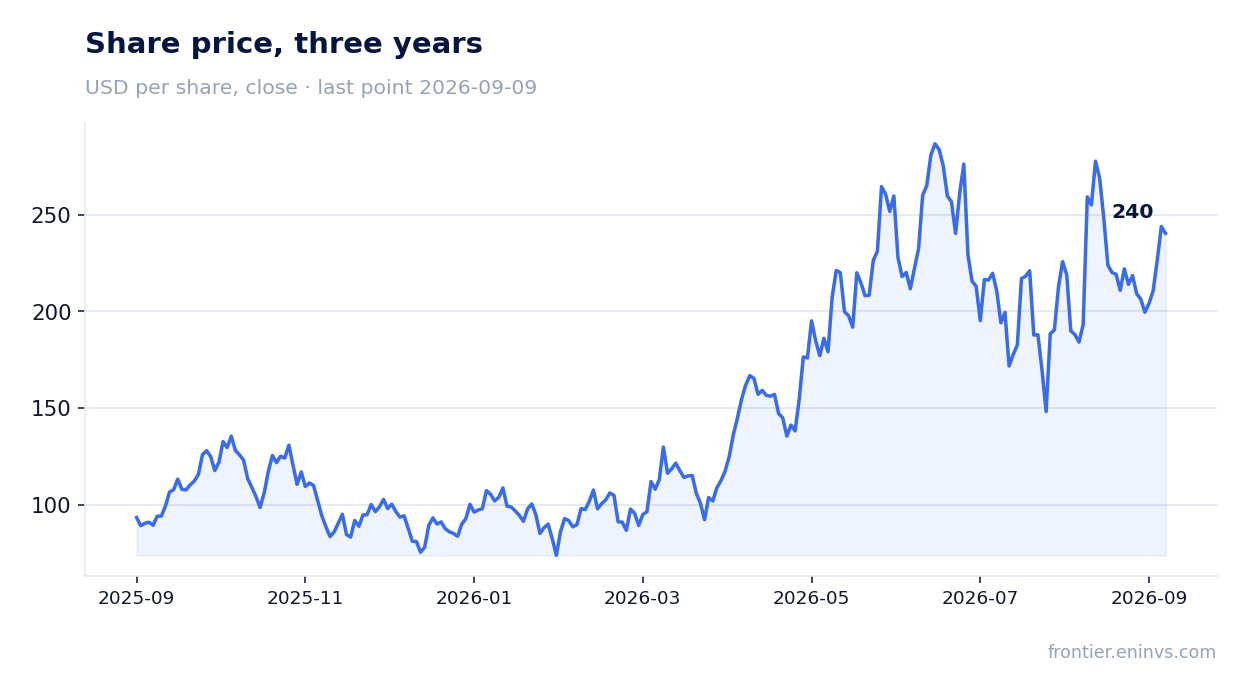
Nebius's market capitalization is $65.3 billion, and the EV/EBITDA multiple for the trailing twelve months is 366.4. This is an extremely high valuation, reflecting investor expectations for future growth, but it leaves little room for error.
For comparison, in previous quarters EBITDA was negative, so the current multiple lacks a direct historical base. However, even with rapid revenue growth, such a valuation implies that the company must sustain growth rates and significantly improve margins to justify the current share price.
Valuation on the latest reported figures
| Metric | Value |
|---|---|
| Market cap | 65.3 bn USD |
| EV/EBITDA (LTM) | 366.4 |
| P/B | 14.22 |
| Net debt / EBITDA (LTM) | 2.50 |
| Operating cash flow (LTM) | 0.38 bn |
| ROE | 42.0% |
Bottom line
Bottom line: Nebius shows impressive revenue growth – +454% in Q2, and turned EBITDA positive for the first time in four quarters. However, net profit remains negative, and capex is several times higher than operating cash flow, requiring constant debt raising. At the current valuation of 366.4 EV/EBITDA, the shares look rather attractive for long-term investors who believe in the scaling of AI infrastructure, but are extremely vulnerable to any execution missteps. The key question for holders is when investments will start generating positive free cash flow.
Open the company's financial profile NBIS →
See also: market overview · valuation map · stock screeners