NETFLIX INC: Q2 2026 — revenue up 13.4%, but operating margin shrinks and shares trade at twice the three-year norm

16 июля 2026 года NETFLIX INC раскрыла результаты за второй квартал 2026 года. Выручка выросла на 13,4% год к году до 12 559,9 млн долларов, EBITDA — на 11,4%, чистая прибыль — на 8,8%. При этом операционная маржа снизилась с 34,1% до 33,4%, а акции торгуются с мультипликатором EV/EBITDA 23,6 против среднего за три года 32,5 — бумага выглядит скорее привлекательной, но с оговорками.
Key takeaways
— Q2 2026 revenue grew 13.4% to $12,559.9 million, but growth slowed from 15.9% a year ago
— Operating margin fell to 33.4% from 34.1% a year ago due to higher content amortization in the first half
— Net profit rose only 8.8% to $3,401.4 million, weighed by higher tax payments and interest expenses
— Free cash flow dropped to $1,525.2 million from $2,267.4 million a year ago due to higher capex and taxes
— The company maintained its 2026 revenue guidance of $51.0–$51.4 billion, implying 13–14% growth
— Shares rose 6.2% after the report but trade at EV/EBITDA of 23.6 versus the three-year average of 32.5
Attractiveness
Key figures, USD bn
| Metric | Q2 2025 | Q2 2026 | Change |
|---|---|---|---|
| Revenue | 11.1 | 12.6 | +13.4% |
| EBITDA | 3.85 | 4.29 | +11.4% |
| Operating profit | 3.77 | 4.19 | +11.1% |
| Net profit | 3.13 | 3.40 | +8.8% |
| Operating cash flow | 2.42 | 1.74 | -28.0% |
| Capex | 0.16 | 0.22 | +40.2% |
| EBITDA margin | 34.8% | 34.2% | -0.6 pp |
| Net margin | 28.2% | 27.1% | -1.1 pp |
Q2 2026 revenue grew 13.4% to $12,559.9 million, but growth slowed from 15.9% a year ago
In Q2 2026, NETFLIX INC revenue reached $12,559.9 million, up 13.4% year over year. This is a noticeable slowdown from the 15.9% growth in Q2 2025. The company attributes growth primarily to membership gains, pricing, and higher advertising revenue.
By region, Latin America grew fastest at 21% (16% in constant currency), while UCAN (US and Canada) grew only 10% due to a partial quarter impact from recent price increases. EMEA and APAC grew 14% and 16%, respectively, with EMEA crossing the $4 billion quarterly revenue mark for the first time.
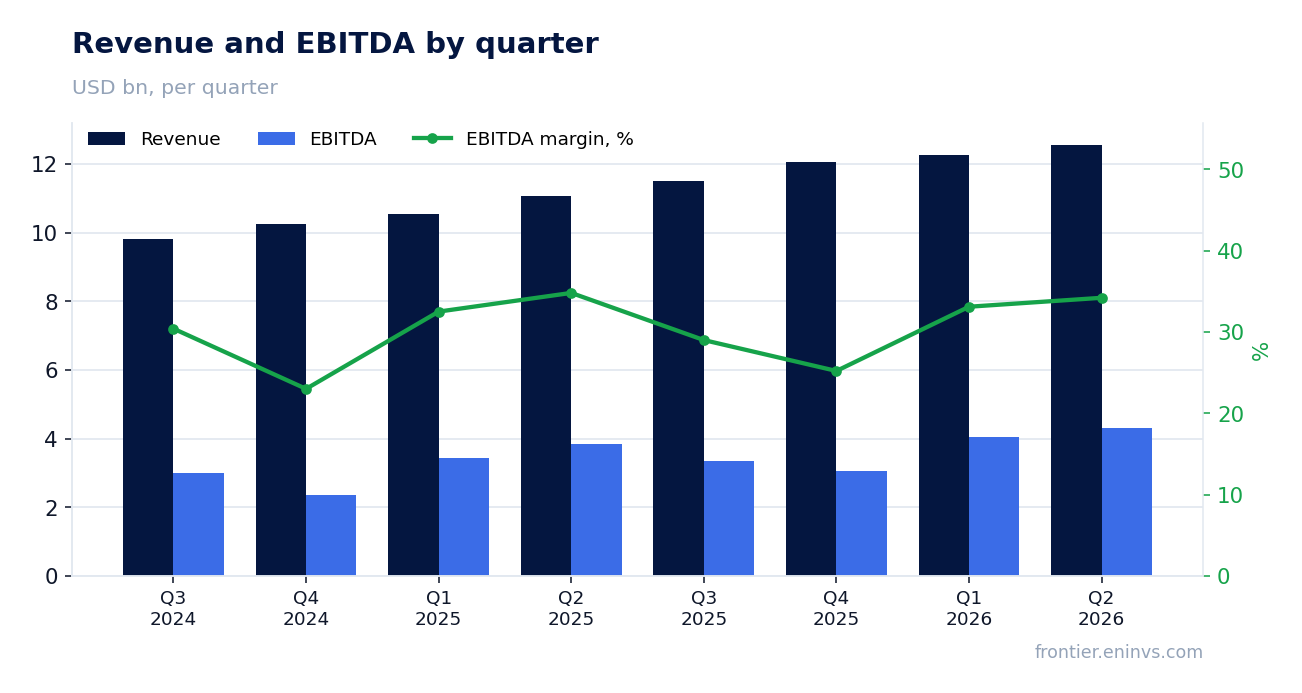
Operating margin fell to 33.4% from 34.1% a year ago due to higher content amortization in the first half
Operating profit in Q2 rose 11.4% to $4,192.6 million, but slower than revenue, so operating margin contracted to 33.4% from 34.1% a year ago. The company explicitly cites higher content amortization growth in the first half; it expects a slowdown in the second half, with full-year 2026 amortization growth of about 10%.
EBITDA margin for the quarter was 34.2% versus 34.8% a year earlier. This is the second consecutive quarter of margin compression, reflecting continued investment in content and technology.
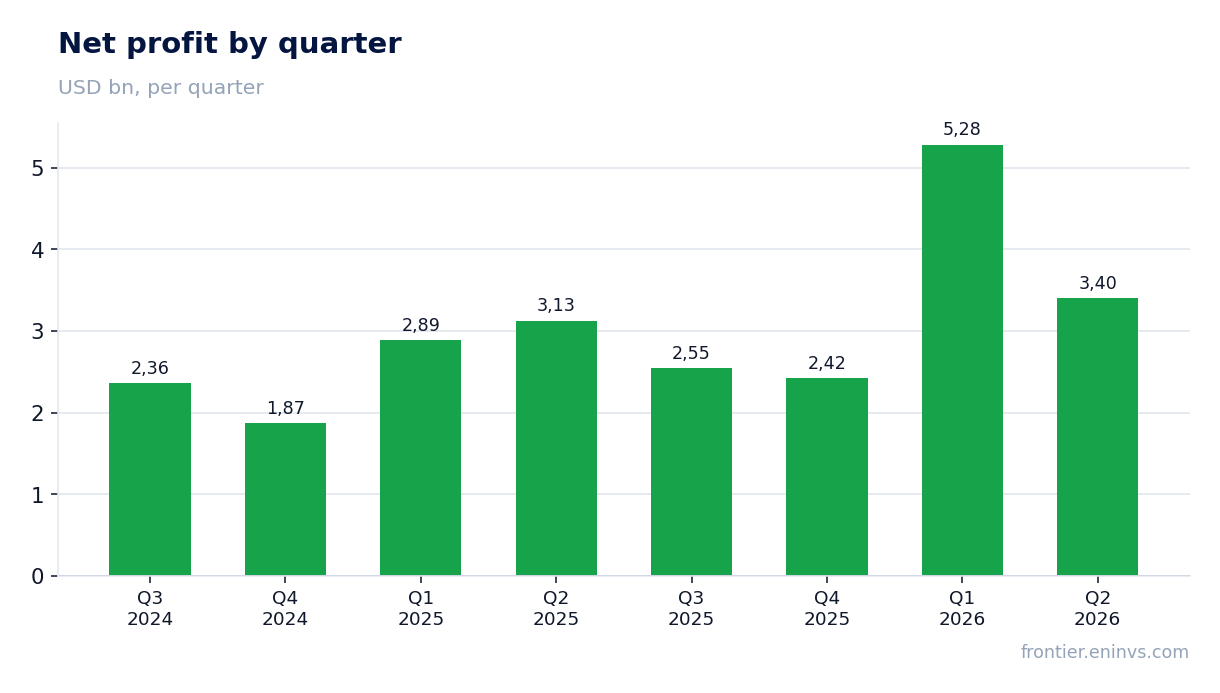
Net profit rose only 8.8% to $3,401.4 million, weighed by higher tax payments and interest expenses
Net profit in Q2 2026 was $3,401.4 million, up 8.8% year over year. Growth noticeably lags revenue and operating profit growth. The reason is a higher effective tax rate: income tax expense rose to $667.2 million from $506.3 million a year ago, partly due to a one-time payment related to the Warner Bros. termination fee.
Interest expense also rose to $175.7 million from $182.6 million a year ago, but this was partly offset by higher other income. Net margin for the quarter fell to 27.1% from 28.2% a year earlier.
Free cash flow dropped to $1,525.2 million from $2,267.4 million a year ago due to higher capex and taxes
Operating cash flow in Q2 was $1,743.8 million versus $2,423.3 million a year ago. Capital expenditures rose to $218.6 million from $155.9 million. As a result, free cash flow fell to $1,525.2 million from $2,267.4 million a year ago. The company attributes this partly to higher tax payments related to the Warner Bros. termination fee.
Over the trailing twelve months, operating cash flow was $10,100.0 million, and the company still expects full-year 2026 free cash flow of approximately $12.5 billion. Despite the quarterly drop, the company continues aggressive share repurchases: it spent $4.7 billion on buybacks in Q2, a record quarter.
The company maintained its 2026 revenue guidance of $51.0–$51.4 billion, implying 13–14% growth
NETFLIX INC reaffirmed its 2026 revenue guidance of $51.0–$51.4 billion, implying growth of 13–14% (about 12% in constant currency). The operating margin forecast remains at 31.5% versus 29.5% in 2025. The company also expects advertising revenue to roughly double in 2026 to about $3 billion.
For Q3 2026, the company guides revenue of $12,860 million, implying 11.7% year-over-year growth, and operating margin of 33.2% versus 28.2% a year ago. This points to continued growth deceleration but improved profitability versus last year.
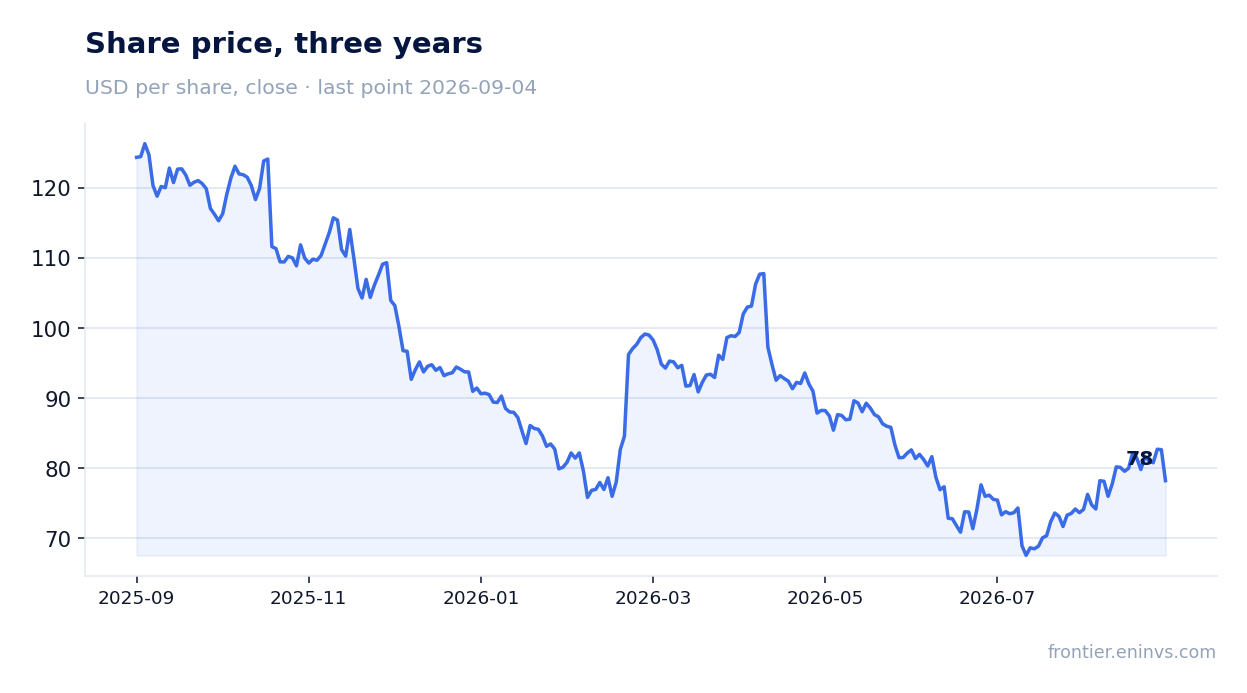
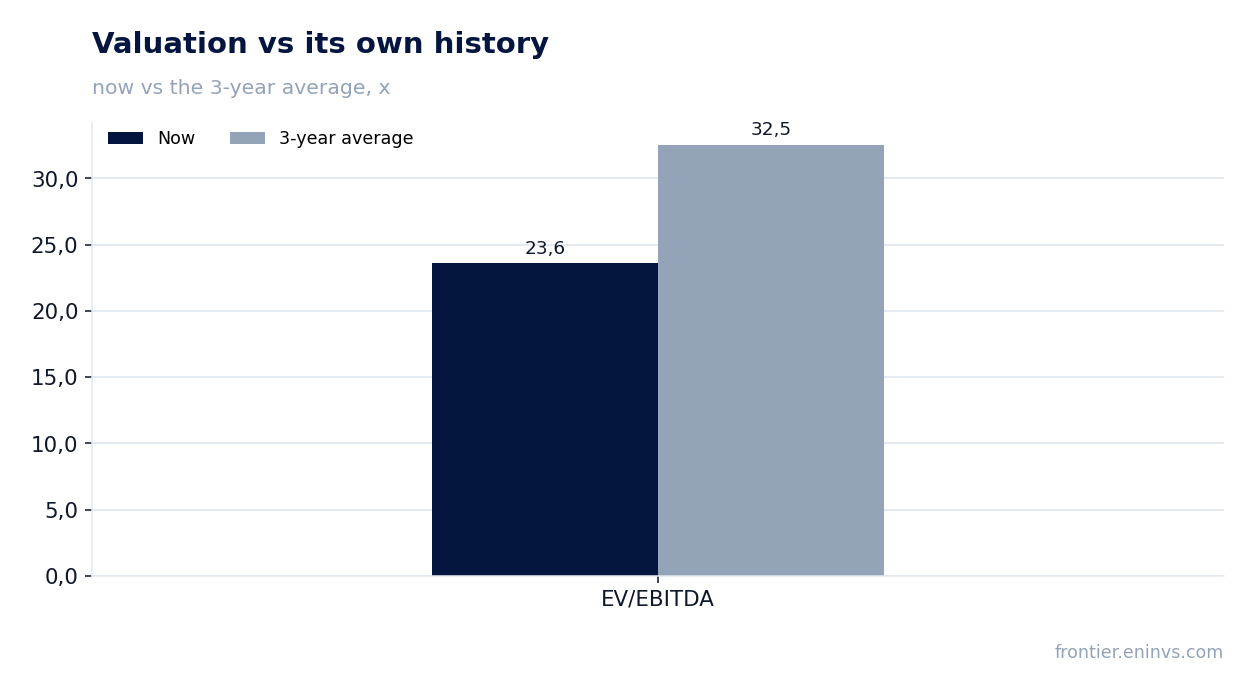
Shares rose 6.2% after the report but trade at EV/EBITDA of 23.6 versus the three-year average of 32.5
Following the July 16 report, NETFLIX INC shares rose 0.9% on the release day and gained another 6.2% by September 4. However, the current EV/EBITDA multiple is 23.6 – significantly below the three-year average of 32.5. In other words, the market values the company cheaper than usual despite continued growth.
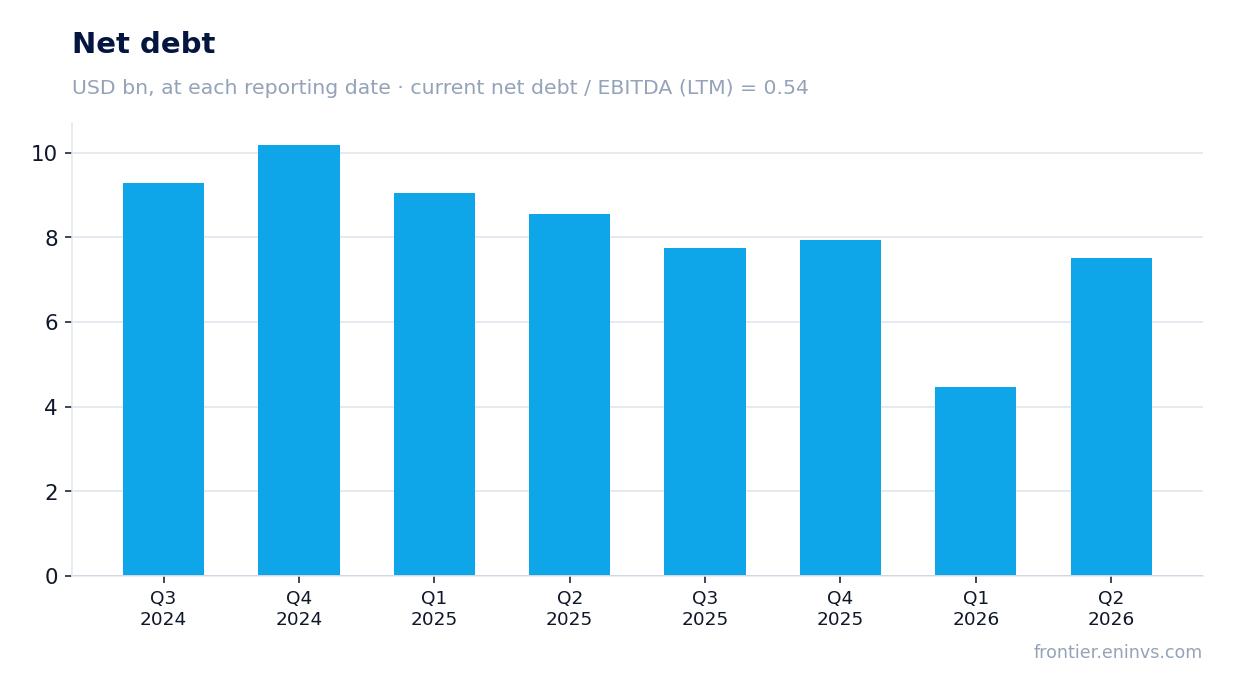
P/E LTM is 24.9, and ROE is 44.4%. Net debt at quarter-end was $7,511.8 million, implying a net debt/EBITDA LTM ratio of 0.54 – moderate leverage. According to the portal's model, the upside to fair value is +9%.
Valuation on the latest reported figures
| Metric | Value |
|---|---|
| Market cap | 340 bn USD |
| P/E (LTM) | 24.9 |
| EV/EBITDA (LTM) | 23.6 |
| P/B | 12.77 |
| Net debt / EBITDA (LTM) | 0.54 |
| Operating cash flow (LTM) | 10.1 bn |
| ROE | 44.4% |
| EV/EBITDA, 3-year average | 32.5 |
Bottom line
NETFLIX INC's Q2 2026 report showed strong but decelerating revenue growth of 13.4% alongside operating margin compression to 33.4%. Net profit rose only 8.8% due to one-off tax payments, and free cash flow fell by nearly a third. Nevertheless, the company maintained its 2026 revenue growth guidance of 13–14% and expects advertising revenue to double to $3 billion. At the current EV/EBITDA of 23.6 versus the three-year average of 32.5, the shares look rather attractive, especially given the +9% upside on the portal's model. The key question for holders is whether the company can sustain double-digit revenue growth and restore margin in the second half.
Open the company's financial profile NFLX →
See also: market overview · valuation map · stock screeners