Northern Oil and Gas: profit up 2.4x, but the entire quarterly cash flow went into drilling and debt
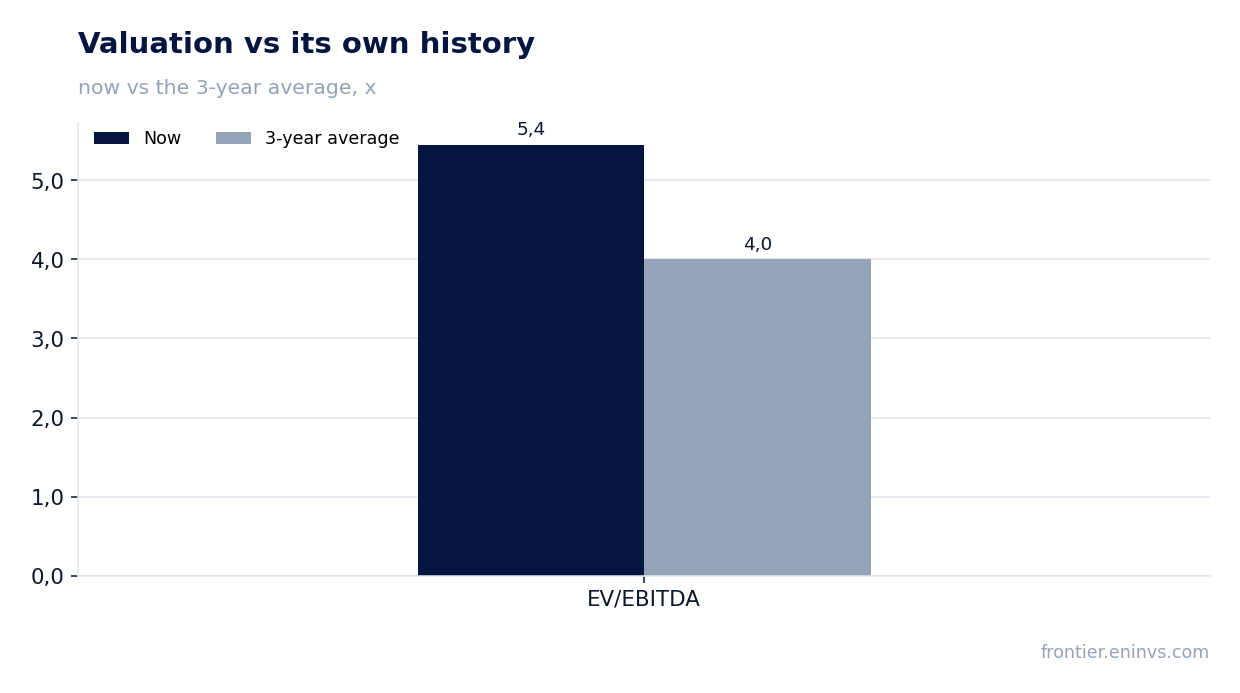
On August 25, Northern Oil and Gas, Inc. released its second-quarter 2026 results. Revenue rose 5.4% year on year to $745.2 million, EBITDA added 5.0% to $401.0 million, and net profit jumped 137.6% to $236.6 million. The profit growth looks strong, but operating cash flow of $321.6 million was almost entirely absorbed by capital expenditure of $379.8 million, while debt rose to $2,677.2 million over the quarter. At the current price the shares look neutral: the EV/EBITDA multiple of 5.45x is above its own three-year average of 4.00x, and the 7.0% dividend yield remains the main support for the valuation.
Key takeaways
— Revenue rose 5.4% year on year but added 37.0% quarter on quarter – a rebound after a weak start to the year
— Profit grew 2.4x year on year, not quarter on quarter – a comparison against a low base last year
— EBITDA margin holds at 53.8%, though it was 64.2% a quarter ago – margin compressed as revenue grew faster than EBITDA
— Operating cash flow of $321.6 million did not cover capital expenditure of $379.8 million – free cash flow remains negative
— Debt rose to $2,677.2 million, with net debt / LTM EBITDA at 2.53 – leverage is moderate but requires servicing
— The 7.0% dividend yield is the main support for the valuation, but the payout absorbs a significant share of profit
— EV/EBITDA of 5.45x is above its own three-year average of 4.00x – the market is already pricing in a profit recovery
Attractiveness
Key figures, USD bn
| Metric | Q2 2025 | Q2 2026 | Change |
|---|---|---|---|
| Revenue | 0.71 | 0.75 | +5.4% |
| EBITDA | 0.38 | 0.40 | +5.0% |
| Operating profit | 0.18 | 0.35 | +100.1% |
| Net profit | 0.10 | 0.24 | +137.6% |
| Operating cash flow | 0.36 | 0.32 | -11.2% |
| Capex | 0.33 | 0.38 | +16.1% |
| EBITDA margin | 54.0% | 53.8% | -0.2 pp |
| Net margin | 14.1% | 31.8% | +17.7 pp |
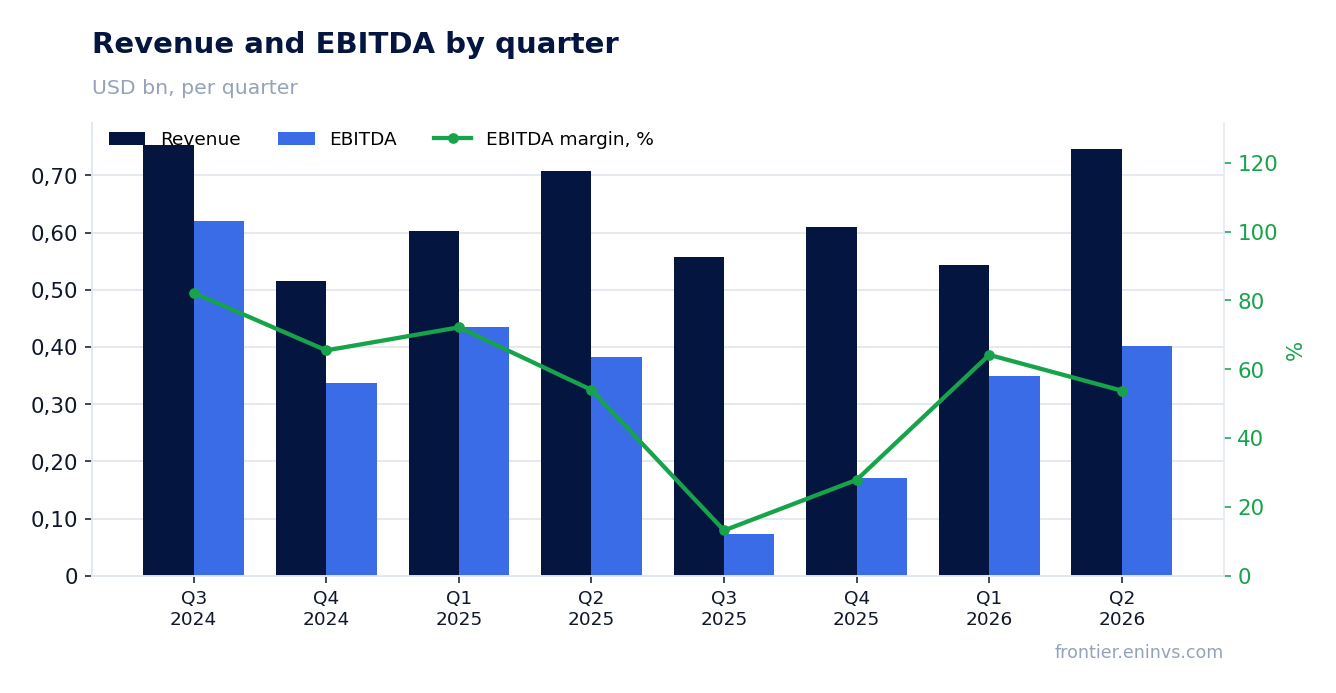
Revenue rose 5.4% year on year but added 37.0% quarter on quarter – a rebound after a weak start to the year
In the second quarter of 2026, Northern Oil and Gas revenue reached $745.2 million, up 5.4% from a year earlier. Quarter on quarter, revenue grew 37.0% from $544.1 million. This is the highest quarterly figure in the last four quarters.
The year-on-year trend remains weak: in the first quarter of 2026 revenue fell 9.6%, while in the fourth quarter of 2025 it rose 18.5%. The second-quarter recovery only partly offset the weak start to the year and has not yet put the company on a sustainable growth path.
The main driver of growth appears to be higher production volumes or improved pricing, though the provided data does not disclose details. For an investor, the key point is that the quarterly rebound has not yet been confirmed by a similar move in profit.
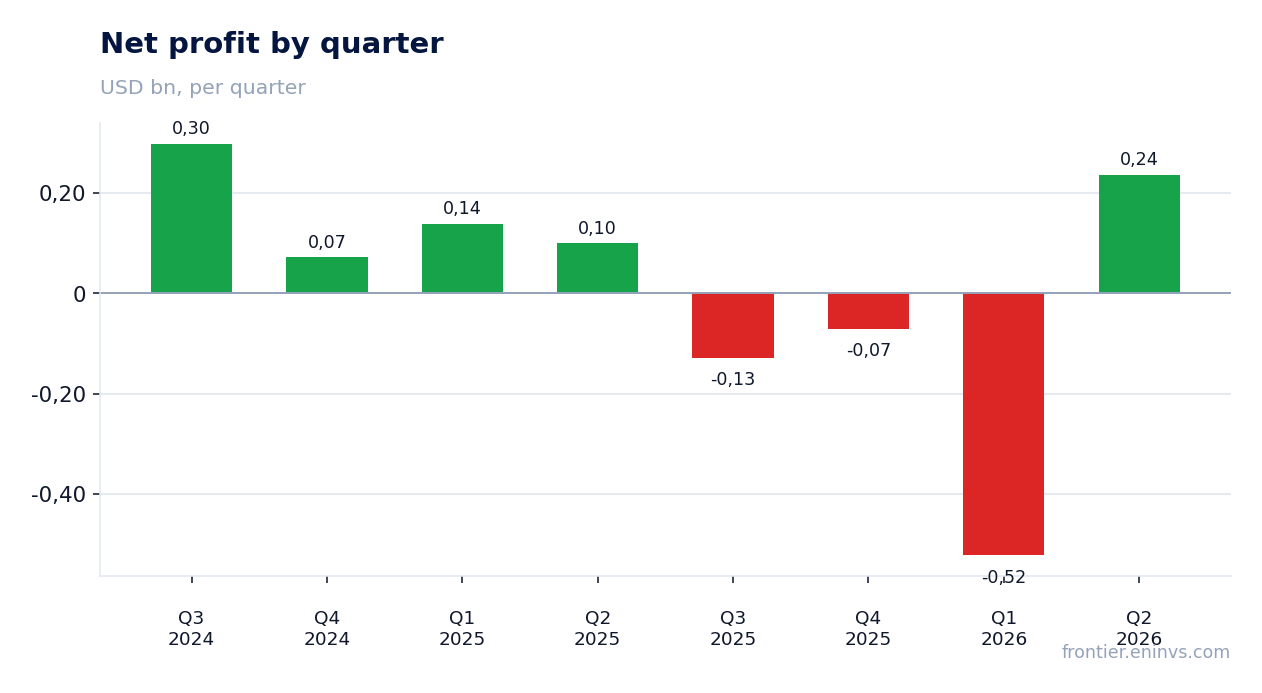
Profit grew 2.4x year on year, not quarter on quarter – a comparison against a low base last year
Net profit in the second quarter of 2026 was $236.6 million, up 137.6% from $99.6 million in the second quarter of 2025. However, compared with the first quarter of 2026, when a loss of $522.8 million was recorded, this is a recovery rather than continued growth.
The net margin rose to 31.8% from 14.1% a year earlier. This jump is explained not only by higher revenue but also by a low base effect: a year ago profit was depressed by one-off factors that are not disclosed in the provided data.
Importantly, trailing twelve-month profit was only $38.8 million – well below the quarterly figure, which points to large losses in previous periods. The sustainability of the current profit is questionable.
EBITDA margin holds at 53.8%, though it was 64.2% a quarter ago – margin compressed as revenue grew faster than EBITDA
EBITDA in the second quarter of 2026 was $401.0 million, up 5.0% from a year earlier. The EBITDA margin was 53.8%, virtually unchanged from 54.0% in the second quarter of 2025.
However, compared with the first quarter of 2026, when EBITDA was $349.5 million on revenue of $544.1 million, the margin was 64.2%. The decline in the second quarter occurred because revenue grew 37.0% while EBITDA rose only 14.7% quarter on quarter.
This means revenue growth was accompanied by faster cost growth. Operating profit in the second quarter was $352.5 million, up from $152.4 million in the first quarter, but still below the third quarter of 2024 level of $433.9 million.
Operating cash flow of $321.6 million did not cover capital expenditure of $379.8 million – free cash flow remains negative
Operating cash flow in the second quarter of 2026 was $321.6 million, down 11.2% from $362.1 million a year earlier. Capital expenditure was $379.8 million, up 16.1% from $327.3 million in the second quarter of 2025.
As a result, free cash flow remains negative: operating cash flow does not cover capital expenditure. The gap is $58.2 million, financed by debt.
Over the trailing twelve months, operating cash flow was $1,500.0 million, while capital expenditure over the same period, based on quarterly reports, exceeded $1,600 million. The company continues to invest more than it earns, increasing its reliance on external financing.
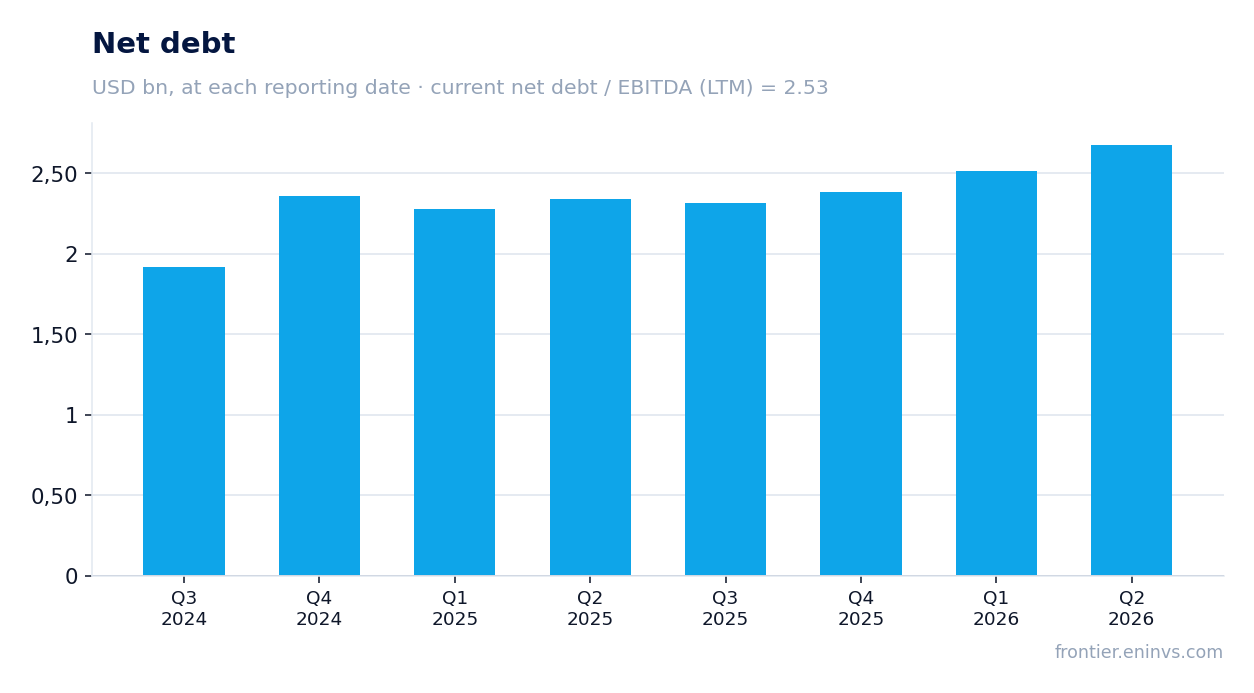
Debt rose to $2,677.2 million, with net debt / LTM EBITDA at 2.53 – leverage is moderate but requires servicing
Net debt at the end of the second quarter of 2026 was $2,677.2 million, up $162.7 million over the quarter and $337.1 million over 12 months. Debt is rising against a background of negative free cash flow.
The net debt / LTM EBITDA ratio is 2.53. This is a moderate level for an oil and gas company, but it requires stable servicing. Interest expenses are not disclosed in the provided data, but at current borrowing costs they could significantly affect profit.
Importantly, the net debt / LTM EBITDA ratio is not compared with a previous value, as the facts do not contain historical data for this metric. One can only state that absolute debt is growing.
The 7.0% dividend yield is the main support for the valuation, but the payout absorbs a significant share of profit
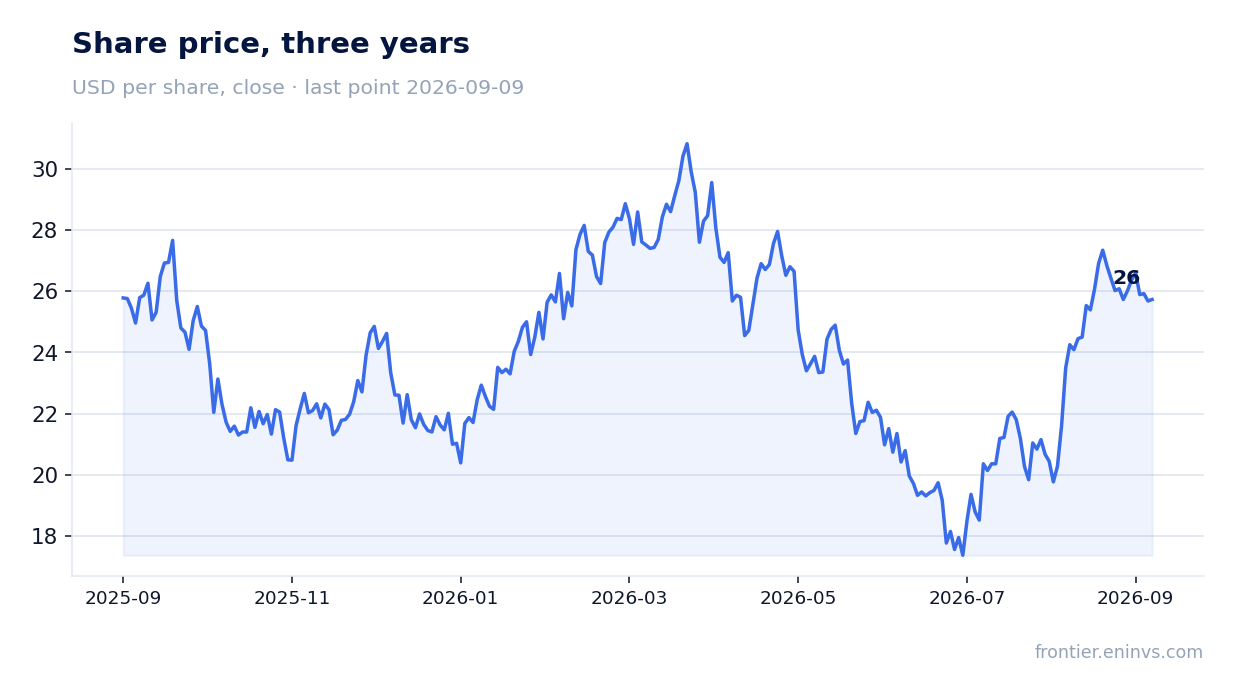
The trailing twelve-month dividend yield is 7.0%. This is above the key rate, making the stock attractive for income investors. However, the sustainability of the payout is questionable: trailing twelve-month profit was only $38.8 million, while quarterly profit was $236.6 million.
If the company maintains the current quarterly dividend, the annual payout could be significantly higher than trailing twelve-month profit allows. This means the dividend is either financed by debt or the company expects profit to recover in coming quarters.
Our estimate for the current year's dividend: assuming a payout ratio of 50% of quarterly profit, the annual payout could be around $470 million, which at the current market capitalisation of $2,741.5 million gives a yield of about 17%. However, this estimate is highly sensitive to profit: if profit returns to the first-quarter level (a loss), the payout could be cut.
EV/EBITDA of 5.45x is above its own three-year average of 4.00x – the market is already pricing in a profit recovery
The current EV/EBITDA multiple is 5.45x, above its own three-year average of 4.00x. This means the market values the company more highly than its average over the past three years, despite weak revenue and profit dynamics.
The P/E LTM multiple is 70.7x, reflecting low trailing twelve-month profit. If profit recovers to the second-quarter level, P/E could fall to 11.6x, making the valuation more attractive.
However, the current valuation does not look cheap: EV/EBITDA is above its historical average, and the 7.0% dividend yield, while above the key rate, does not compensate for the risks associated with negative free cash flow and rising debt.
Valuation on the latest reported figures
| Metric | Value |
|---|---|
| Market cap | 2.74 bn USD |
| P/E (LTM) | 70.7 |
| EV/EBITDA (LTM) | 5.4 |
| P/B | 1.29 |
| Net debt / EBITDA (LTM) | 2.53 |
| Operating cash flow (LTM) | 1.50 bn |
| ROE | 50.1% |
| Dividend yield (12m) | 7.0% |
| EV/EBITDA, 3-year average | 4.0 |
Bottom line
Bottom line: in the second quarter of 2026, Northern Oil and Gas showed a strong profit recovery – $236.6 million versus a $522.8 million loss a quarter earlier. However, this growth is based on a low base last year and is not accompanied by positive free cash flow: operating cash flow of $321.6 million did not cover capital expenditure of $379.8 million. Debt rose to $2,677.2 million, with net debt / LTM EBITDA at 2.53. The 7.0% dividend yield remains the main support, but its sustainability is questionable. At the current price the stock is neutrally valued: EV/EBITDA of 5.45x is above its own three-year average of 4.00x, and a sustained recovery in profit and free cash flow is needed to improve the valuation.
Open the company's financial profile NOG →
See also: market overview · valuation map · stock screeners