ONTO INNOVATION INC.: record revenue and a backlog above $1bn, but quarterly profit barely reached cash

On 6 August ONTO INNOVATION INC. reported results for the second quarter of 2026. Revenue rose 35.3% year on year to $343.1m, EBITDA by 47.7%, net profit by 77.2% to $60.1m, and the order backlog exceeded $1bn for the first time. Yet operating cash flow stayed at $62.0m and capital expenditure was only $3.7m, and at an EV/EBITDA of 65.1 against its own three-year average of 38.1 the stock looks expensive relative to its own history. The verdict on the share is neutral: the revenue and margin growth is real, but it is already priced in.
Key takeaways
— Revenue rose 35.3% year on year to $343.1m, the best quarter in the company's history
— The record was driven by advanced nodes and advanced packaging, not one-off shipments
— EBITDA margin rose to 20.0% from 18.3% a year earlier, but operating profit grew faster than revenue
— Net profit rose 77.2% to $60.1m, yet operating cash flow stayed at $62.0m
— A cash cushion of $1.88bn and negative net debt of $328.6m provide a margin of safety
— EV/EBITDA of 65.1 against its own three-year average of 38.1 – the market already prices in continued growth
— Guidance for the third quarter: revenue of $380–400m and non-GAAP margin of 31.5–32.5%
Attractiveness
Key figures, USD bn
| Metric | Q2 2025 | Q2 2026 | Change |
|---|---|---|---|
| Revenue | 0.25 | 0.34 | +35.3% |
| EBITDA | 0.05 | 0.07 | +47.7% |
| Operating profit | 0.03 | 0.06 | +97.1% |
| Net profit | 0.03 | 0.06 | +77.2% |
| Operating cash flow | 0.06 | 0.06 | +7.0% |
| Capex | 0.01 | 0.00 | -73.1% |
| EBITDA margin | 18.3% | 20.0% | +1.7 pp |
| Net margin | 13.4% | 17.5% | +4.1 pp |
Revenue rose 35.3% year on year to $343.1m, the best quarter in the company's history
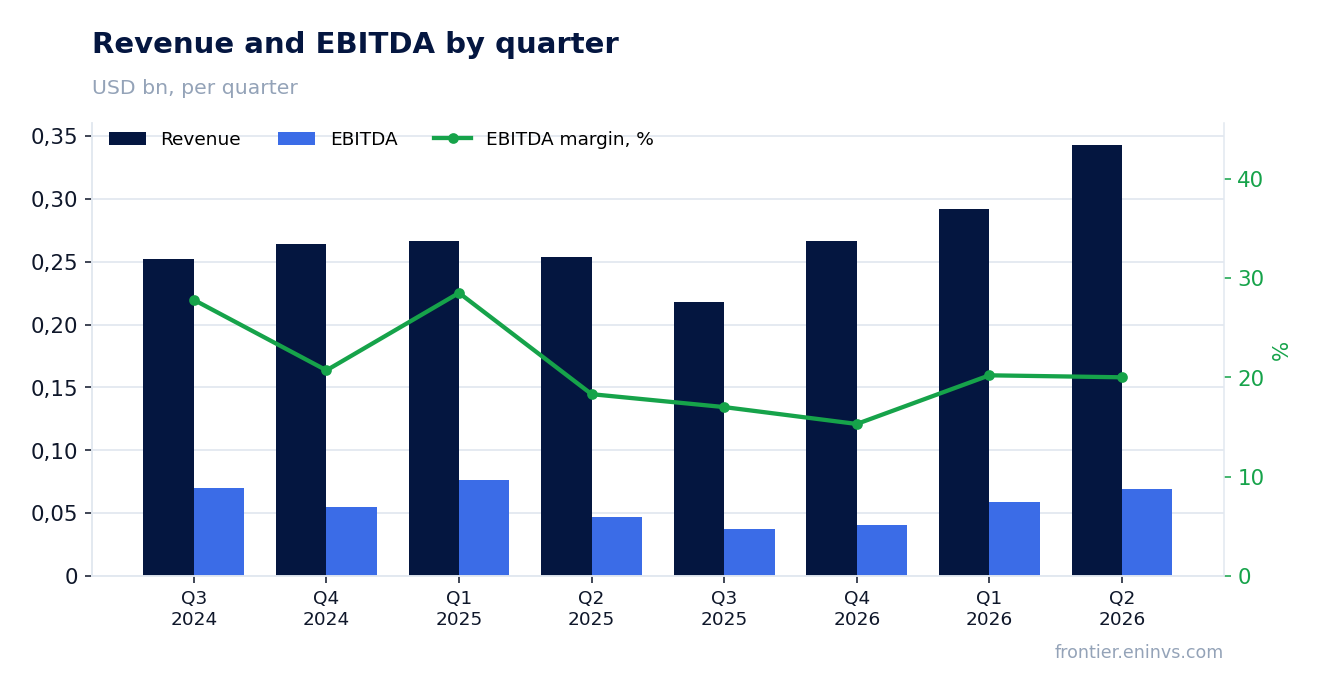
In the second quarter of 2026, ONTO INNOVATION INC.'s revenue reached $343.1m, up 35.3% year on year and nearly 18% sequentially. This is a record for the company. For comparison, revenue in the first quarter of 2026 was $291.9m, and a year earlier, in the second quarter of 2025, it was $253.6m.
Growth came from both key segments. Advanced nodes revenue rose 50% sequentially to a new quarterly record, which the company attributes to broad-based strengthening demand from logic and memory customers. Specialty devices and advanced packaging also reached an all-time high on demand for 2.5D logic, high-bandwidth memory and silicon photonics.
The order backlog exceeded $1bn for the first time. CEO Mike Plisinski noted that visibility remains strong and customers are maintaining investments in multi-year growth plans. This allows the company to expect a strong second half of 2026 and continued momentum into 2027.
The record was driven by advanced nodes and advanced packaging, not one-off shipments
The company explicitly states that the 50% sequential growth in advanced nodes revenue is driven by broad-based demand from logic and memory customers. This is not a one-off large shipment but a reflection of the overall investment cycle in equipment for AI and high-performance computing chips.
The specialty devices and advanced packaging segment also reached an all-time high. The drivers cited are advanced packaging, including 2.5D logic and high-bandwidth memory, as well as silicon photonics. Both areas are tied to technology inflections that define the next generation of AI devices.
Thus, the record revenue rests on structural factors rather than isolated contracts. This is also confirmed by the backlog above $1bn, which provides visibility for several quarters ahead.
EBITDA margin rose to 20.0% from 18.3% a year earlier, but operating profit grew faster than revenue
EBITDA margin in the second quarter of 2026 was 20.0% versus 18.3% in the second quarter of 2025. The margin improvement resulted from revenue growing faster than costs, as well as a favourable shift in the sales mix toward more profitable segments.
Operating profit rose to $63.6m from $32.2m a year earlier, nearly doubling, while revenue grew 35.3%. This indicates positive operating leverage: the company is growing revenue faster than expenses. GAAP gross margin rose to 53.4% from 48.2%, and non-GAAP gross margin to 57.0% from 54.5%.
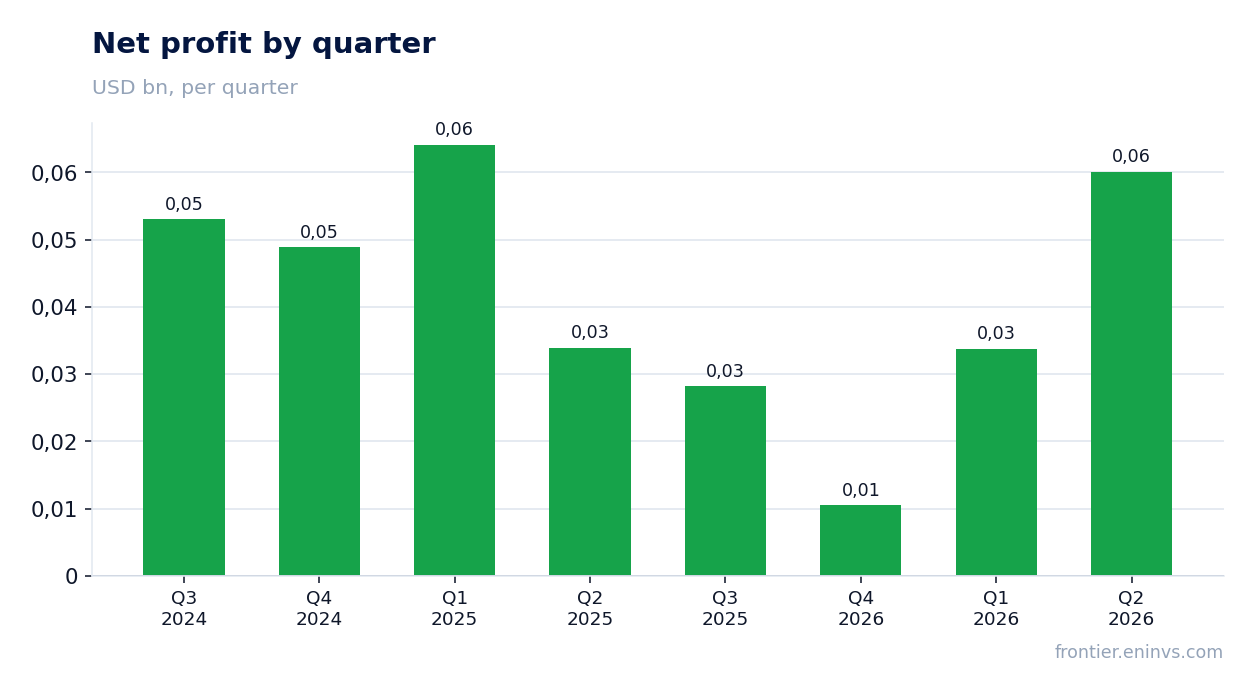
Net profit rose 77.2% to $60.1m, and net margin reached 17.5% from 13.4%. However, it is worth noting that the reported quarter included one-off items: amortisation of intangibles of $19.7m, restructuring expenses of $15.3m and M&A-related expenses of $4.3m. Excluding these, non-GAAP operating profit would have been $102.8m, or 30.0% of revenue.
Net profit rose 77.2% to $60.1m, yet operating cash flow stayed at $62.0m
Net profit in the second quarter of 2026 was $60.1m, up 77.2% year on year. However, operating cash flow remained almost at the level of profit – $62.0m. This means that profit growth is not yet converting into additional cash flow in the same proportion.
Capital expenditure for the quarter was minimal – $3.7m. With such a low burden, free cash flow is approximately equal to operating cash flow and amounts to about $58.3m. For a company delivering record revenue and profit growth, this is a modest result, but it reflects a high share of non-cash items in profit, primarily amortisation.
Over the trailing twelve months, operating cash flow was $328.3m against net profit of $136.8m. The gap is explained by significant amortisation of intangibles and other non-cash charges. This is not a sign of liquidity problems, but it shows that accounting profit is running ahead of cash.
A cash cushion of $1.88bn and negative net debt of $328.6m provide a margin of safety
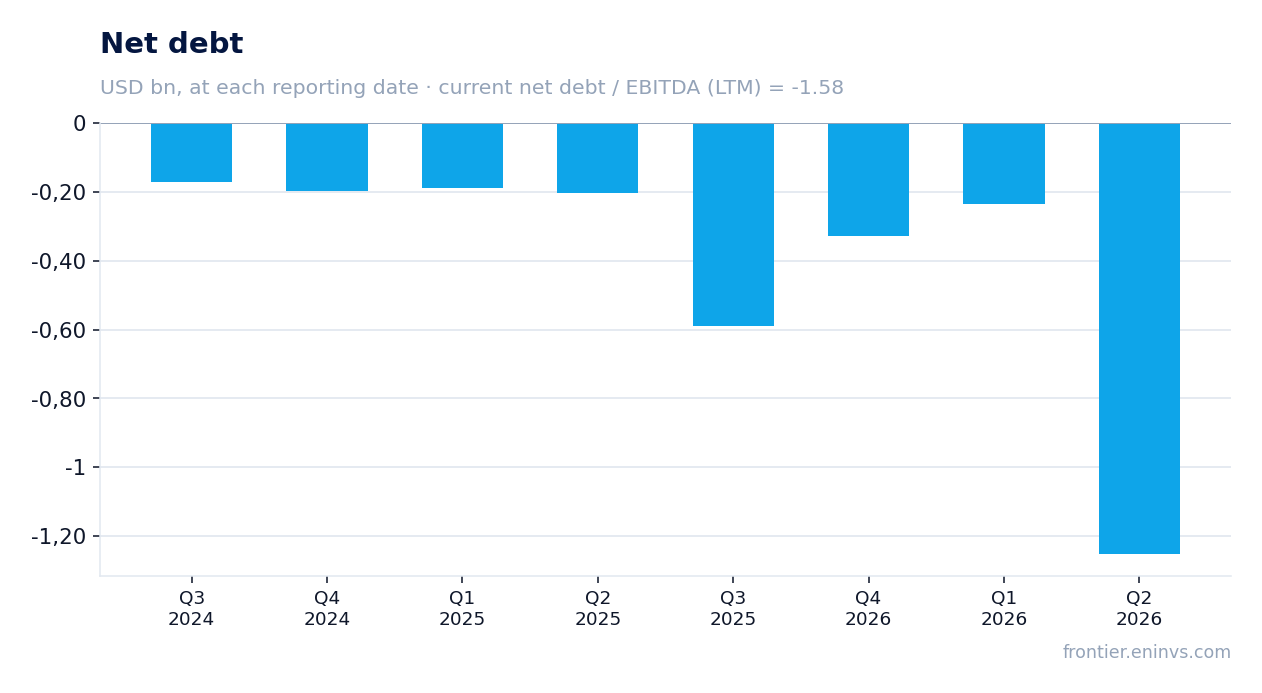
At the end of the second quarter of 2026, the company held $1.88bn in cash and short-term investments. This is significantly more than a year earlier and reflects both cash accumulation from operations and debt financing. In the reporting period, notes of $1.47bn due in 2031 appeared on the balance sheet.
Net debt remains negative at minus $328.6m. The net debt to EBITDA ratio for the trailing twelve months is minus 1.58. This is a comfortable level: the company has more cash than debt and can fund growth without additional borrowing.
Interest income for the quarter was $5.2m, which partially offsets debt servicing costs. However, the appearance of significant debt on the balance sheet is a new development for the company, and in the future it could lead to higher interest expenses if rates remain high.
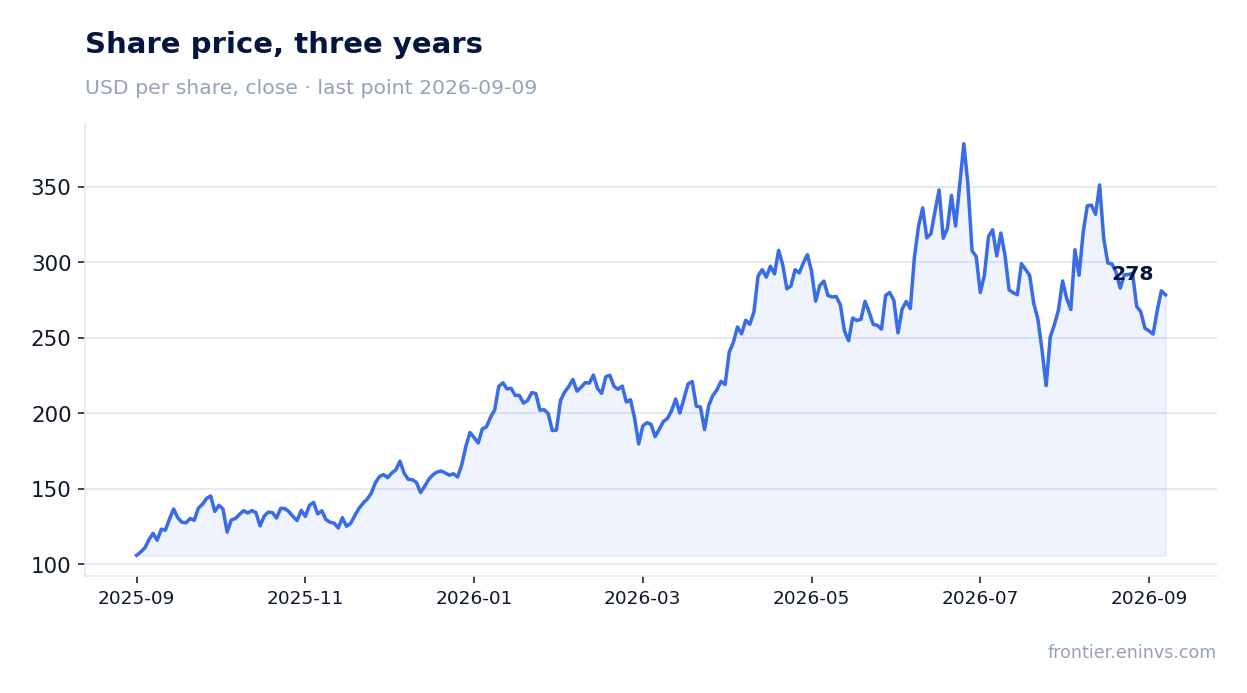
EV/EBITDA of 65.1 against its own three-year average of 38.1 – the market already prices in continued growth
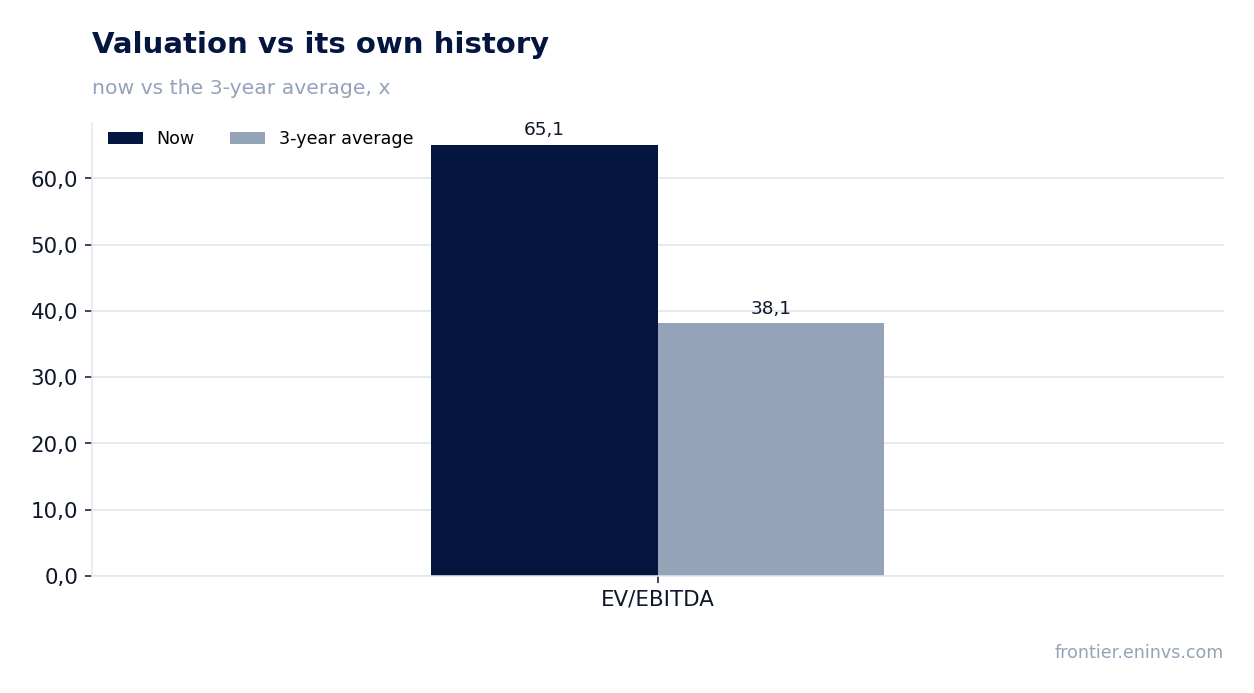
Based on the trailing twelve months, the company's EV/EBITDA is 65.1. This is significantly above its own three-year average of 38.1. Thus, the stock trades at a premium to its historical valuation, implying high market expectations for future growth.
The trailing twelve-month P/E is 101.2. Market capitalisation is $13.84bn. At such a valuation, even a slight slowdown in growth or a decline in margin could lead to a significant correction. Investors are already pricing in not only current records but also their continuation into 2027.
According to the portal's model, which factors in EBITDA growth and a target multiple, the fair value of the share implies an upside of 16% from the current level. This is the portal's own estimate, not a market consensus. It shows that even under an optimistic scenario, the room for further gains is limited.
Guidance for the third quarter: revenue of $380–400m and non-GAAP margin of 31.5–32.5%
The company provided guidance for the third quarter of 2026: revenue in the range of $380–400m, implying further growth both year on year and sequentially. Expected gross margin is 57.3–57.8% on a GAAP basis, above the second-quarter level.
GAAP operating margin is forecast at 21.4–22.4%, and non-GAAP at 31.5–32.5%. This means the company expects to maintain high operating efficiency. Diluted earnings per share guidance: GAAP – $1.54–1.70, non-GAAP – $2.18–2.38.
If the guidance is met, this will be another record quarter. However, it should be noted that the forecast is based on current visibility and may be adjusted if market conditions change. The company notes that demand is supported by customers' multi-year investment plans, which reduces the risk of a sharp slowdown.
Valuation on the latest reported figures
| Metric | Value |
|---|---|
| Market cap | 13.8 bn USD |
| P/E (LTM) | 101.2 |
| EV/EBITDA (LTM) | 65.1 |
| P/B | 6.59 |
| Net debt / EBITDA (LTM) | -1.58 |
| Operating cash flow (LTM) | 0.33 bn |
| ROE | 11.9% |
| EV/EBITDA, 3-year average | 38.1 |
Bottom line
The second-quarter 2026 report showed record revenue, margin and profit growth, and a backlog above $1bn. However, operating cash flow remained at the level of profit, and capital expenditure was minimal, indicating a high share of non-cash items. The company has a solid cash cushion and negative net debt, but its EV/EBITDA valuation significantly exceeds its own three-year average. According to the portal's model, the upside is 16%, which limits attractiveness. The verdict is neutral: the growth is real, but it is already priced in.
Open the company's financial profile ONTO →
See also: market overview · valuation map · stock screeners