Ovintiv: Q2 profit rose 48.5%, but 337 million of it came from asset sales, not production
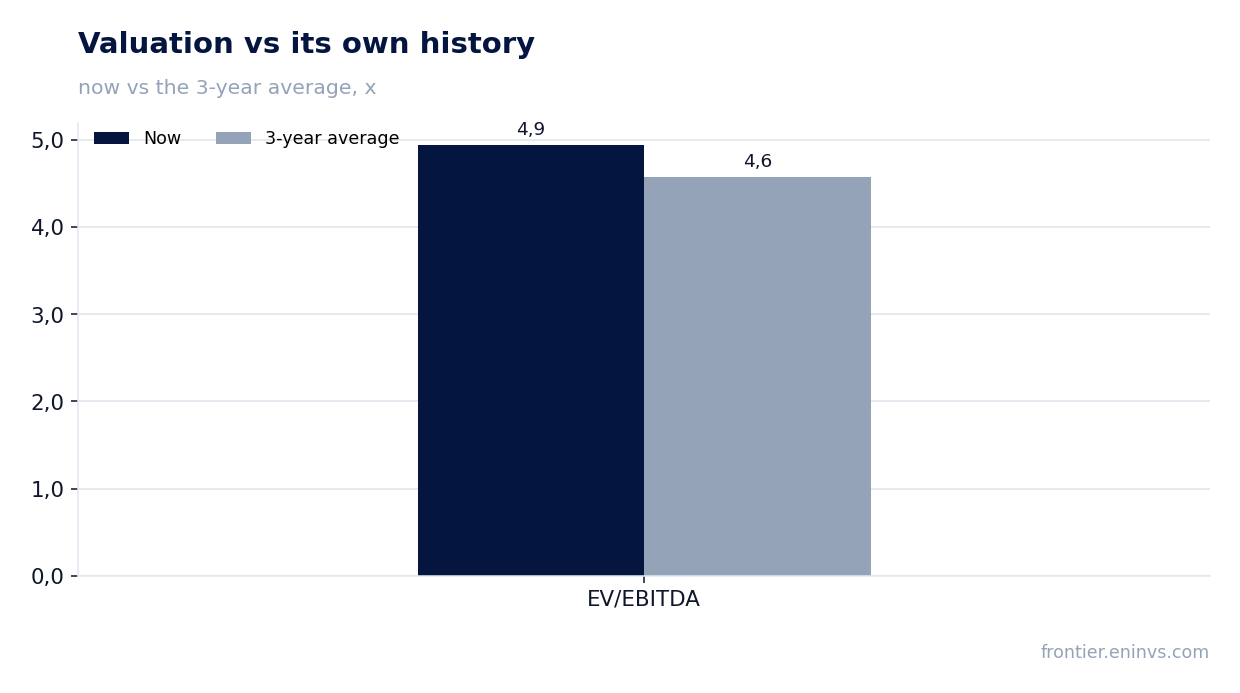
On 23 July, Ovintiv Inc. released its Q2 2026 results. Revenue rose 23.9% year on year to 2,872 million dollars, EBITDA – by 41.8% to 1,513 million, net profit – by 48.5% to 456 million. However, profit includes a one-off loss on asset sales of 337 million; excluding it, adjusted earnings were 491 million. The shares look attractive: EV/EBITDA LTM 4.95 versus the three-year average of 4.58, leverage at 1.31 times EBITDA LTM, and a dividend yield of 1.86% with 84 million paid in the quarter.
Key takeaways
— Q2 revenue added 23.9% year on year, the best growth in five quarters
— EBITDA rose 41.8%, with margin up to 52.7% from 46.0% a year earlier
— Net profit rose 48.5%, but 337 million of it is a one-off loss on asset sales
— Adjusted earnings excluding one-offs were 491 million, or 1.75 dollars per share
— Free cash flow for the quarter was 682 million, covering dividends and buybacks
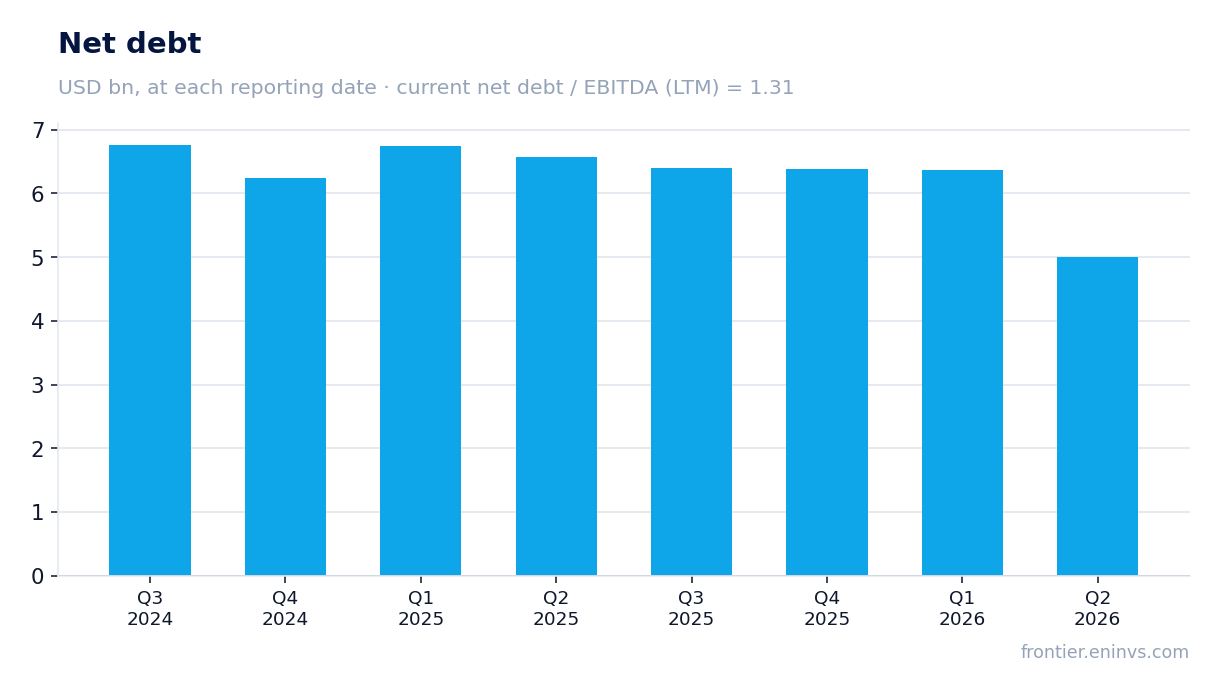
— Leverage at 1.31 times EBITDA LTM, with net debt down to 5,003 million
— Dividend yield of 1.86% on a quarterly payout of 84 million – below the key rate, but the payout ratio is comfortable
Attractiveness
Key figures, USD bn
| Metric | Q2 2025 | Q2 2026 | Change |
|---|---|---|---|
| Revenue | 2.32 | 2.87 | +23.9% |
| EBITDA | 1.07 | 1.51 | +41.8% |
| Operating profit | 0.51 | 0.99 | +94.5% |
| Net profit | 0.31 | 0.46 | +48.5% |
| Operating cash flow | 1.01 | 1.63 | +61.1% |
| Capex | 0.52 | 0.57 | +10.2% |
| EBITDA margin | 46.0% | 52.7% | +6.7 pp |
| Net margin | 13.2% | 15.9% | +2.7 pp |
Q2 revenue added 23.9% year on year, the best growth in five quarters
Q2 2026 revenue was 2,872 million dollars, up 23.9% from a year earlier. This is the highest growth rate in five quarters: in Q1 2026 revenue grew 6.5%, in Q4 2025 it fell 1.9%, in Q3 – by 11.1%. The acceleration came from both higher hydrocarbon prices and increased production volumes following the Montney acquisition.
According to the report, US oil revenue rose to 1,124 million dollars from 831 million a year earlier, while Canadian NGL revenue rose to 719 million from 367 million. Canadian production volumes increased to 369.7 thousand barrels of oil equivalent per day from 300.6 thousand a year earlier, driven by the integration of acquired assets. In the US, production fell to 276.9 thousand barrels per day from 314.7 thousand, explained by the sale of Anadarko assets in April 2026.
The 23.9% revenue growth is not just a price factor. The average US oil realisation price rose to 100.78 dollars per barrel from 64.50 dollars a year earlier, but the company also increased the share of liquid hydrocarbons in its production mix. Overall, the company's realisation price rose to 41.00 dollars per barrel of oil equivalent from 31.32 dollars, which, combined with higher volumes, produced this revenue increase.
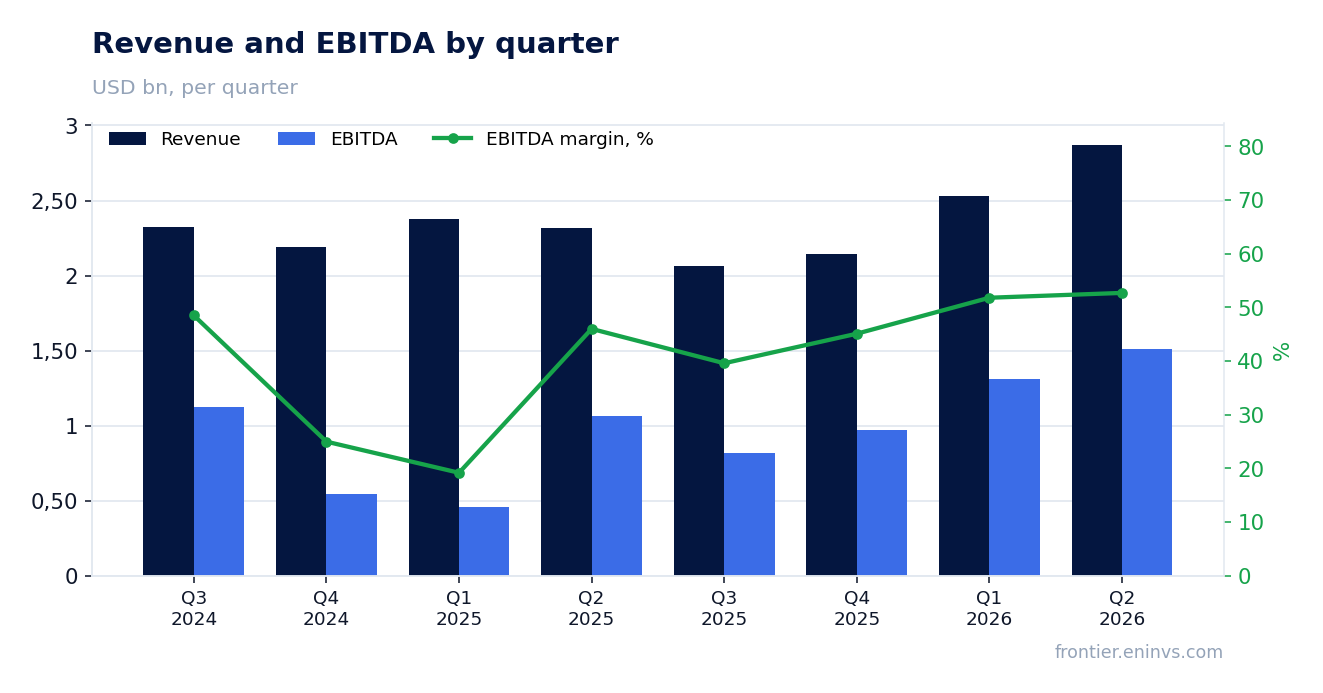
EBITDA rose 41.8%, with margin up to 52.7% from 46.0% a year earlier
Q2 2026 EBITDA was 1,513 million dollars, up 41.8% from a year earlier. The EBITDA margin rose to 52.7% from 46.0% in Q2 2025. Such margin growth on revenue up 23.9% means costs grew slower than revenue.
The main contributor to margin growth was lower unit operating costs. According to the report, US operating costs per barrel of oil equivalent fell to 6.09 dollars from 6.03 dollars, while in Canada they fell to 1.42 dollars from 1.56 dollars. US transportation costs per barrel rose to 4.12 dollars from 4.01 dollars, but in Canada they fell to 12.89 dollars from 11.40 dollars. Overall, the company's unit operating costs fell to 3.25 dollars per barrel from 3.84 dollars a year earlier.
EBITDA growth was also supported by an increased share of higher-margin oil and NGL in the production mix. In Canada, liquid hydrocarbon production rose to 102.8 thousand barrels per day from 76.9 thousand, while gas production grew more slowly. This structurally improves the margin, as liquid hydrocarbons sell at higher prices.
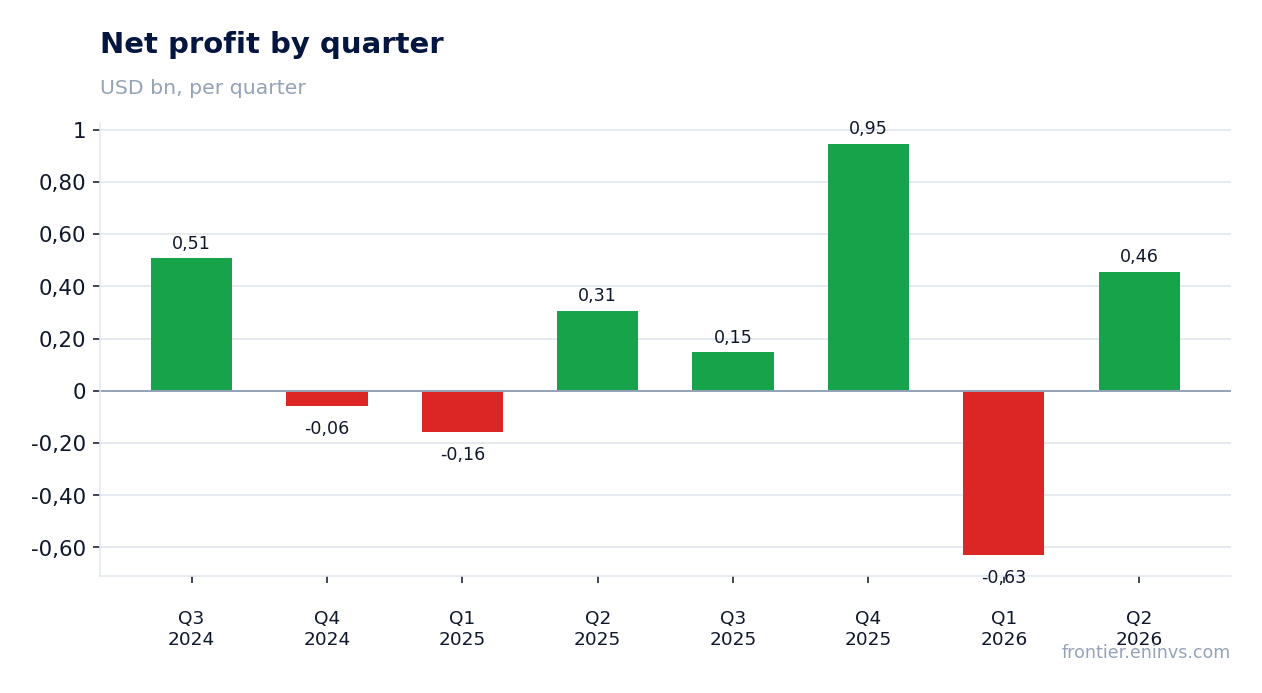
Net profit rose 48.5%, but 337 million of it is a one-off loss on asset sales
Q2 2026 net profit was 456 million dollars, up 48.5% from a year earlier. However, the income statement includes a loss on asset sales of 337 million dollars, which reduced profit. Excluding this one-off loss, profit would have been substantially higher.
Adjusted earnings, which exclude one-off items, were 491 million dollars, or 1.75 dollars per share. A year earlier, adjusted earnings were 265 million, or 1.02 dollars per share. Thus, adjusted earnings rose 85.3%, significantly better than the headline growth of 48.5%. The difference is explained by larger one-off items in the reporting quarter than a year earlier.
Besides the loss on asset sales, net profit was affected by unrealised risk management gains of 190 million dollars, which increased profit, and non-operating foreign exchange losses of 31 million, which reduced it. These items are also excluded from adjusted earnings. Importantly, adjusted earnings reflect the company's sustainable ability to generate income from core operations.
Adjusted earnings excluding one-offs were 491 million, or 1.75 dollars per share
Adjusted earnings in Q2 2026 were 491 million dollars, or 1.75 dollars per share. This is 85.3% more than adjusted earnings a year earlier, which were 265 million, or 1.02 dollars per share. Such growth significantly exceeds headline net profit growth, indicating the strength of the operating business.
Adjusted earnings are calculated by excluding unrealised risk management gains and losses, impairments, non-operating foreign exchange differences and gains/losses on asset sales. In the reporting quarter, these items collectively reduced pre-tax profit by 178 million dollars. A year earlier, they reduced profit by 207 million. Thus, one-off items were less burdensome than a year ago, which produced such strong adjusted earnings growth.
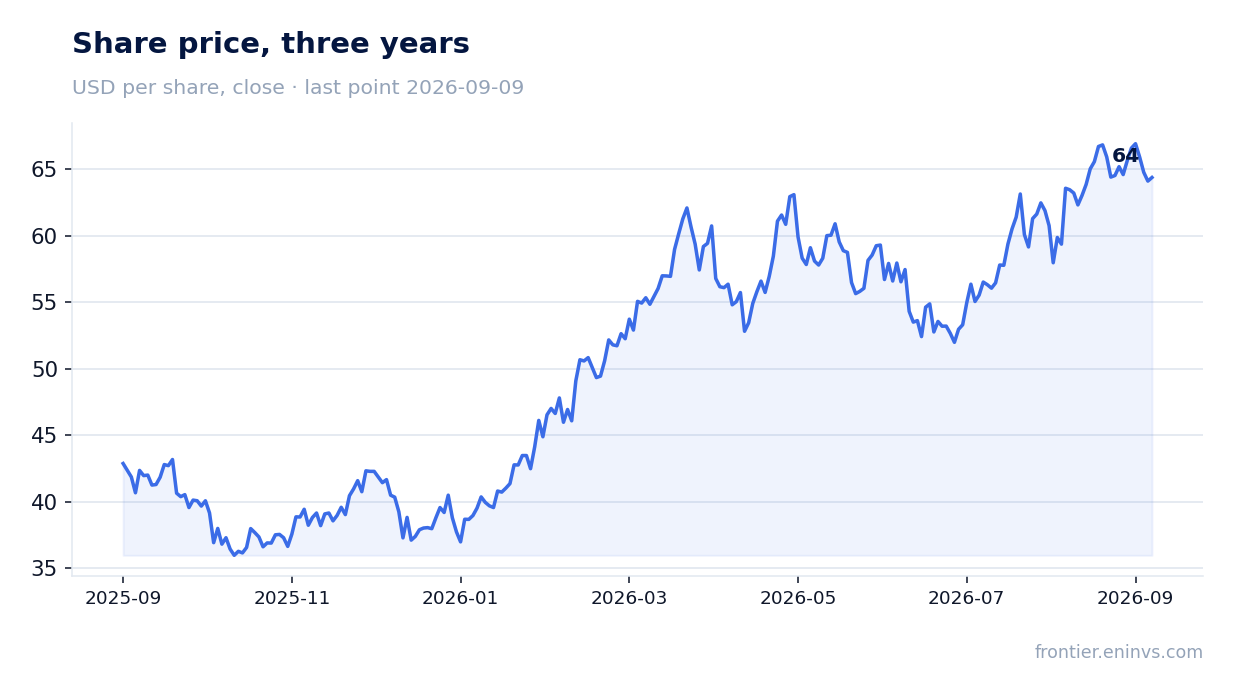
For an investor, the dynamics of adjusted earnings matter more, as they reflect sustainable profitability. Growth of 85.3% year on year shows that the company is not just benefiting from oil prices but also improving operational efficiency. Per share, adjusted earnings rose from 1.02 to 1.75 dollars, which at the current share price of about 60.5 dollars offers significant potential.
Free cash flow for the quarter was 682 million, covering dividends and buybacks
Free cash flow in Q2 2026 was 682 million dollars. It is calculated as non-GAAP cash flow from operations (1,256 million) minus capital expenditures (574 million). This is a substantial amount, allowing the company to fund dividends and buybacks without increasing debt.
Capital expenditures for the quarter were 574 million dollars, of which 545 million was for drilling and development and 28 million for capitalised internal costs. The bulk of investment went to the Permian Basin (327 million) and Montney (242 million). The company also received 2,822 million dollars from asset sales, significantly exceeding capital expenditures and allowing it to reduce debt.
Dividends for the quarter were 84 million dollars, and share buybacks were 345 million. Together this is 429 million, less than free cash flow of 682 million. Thus, the company returns about 63% of free cash flow to shareholders, leaving a cushion in case prices fall. This policy is balanced and does not pressure the balance sheet.
Leverage at 1.31 times EBITDA LTM, with net debt down to 5,003 million
Net debt at the end of Q2 2026 was 5,003 million dollars, down 1.4 billion from the previous reporting date and 1.6 billion less than a year earlier. The reduction came from asset sale proceeds of 2,822 million dollars, which were used to repay debt. The net debt to EBITDA ratio for the trailing twelve months is 1.31, a comfortable level.
Long-term debt on the balance sheet fell to 3,695 million dollars from 4,392 million at the end of 2025. The company repaid 720 million of long-term debt and 1,151 million under the credit facility, while simultaneously raising 1,151 million under the term credit agreement. As a result, total debt declined and cash rose to 700 million from 35 million at the end of 2025. This provides additional financial flexibility.
Interest expense for the quarter was 100 million dollars, slightly higher than 95 million a year earlier. At the current level of debt and EBITDA, interest payments are covered with a large margin. The debt-to-capitalisation ratio fell to 24% from 32% at the end of 2025, indicating a strengthening balance sheet.
Dividend yield of 1.86% on a quarterly payout of 84 million – below the key rate, but the payout ratio is comfortable
In Q2 2026, the company paid dividends of 84 million dollars. A year earlier, the payout was 77 million. The trailing twelve-month dividend yield is 1.86% at the current share price. This is below the key rate, but for an oil and gas company with growing cash flow, such a yield is acceptable.
Our estimate for the 2026 dividend is based on the current quarterly run rate. If the company maintains the payout at 84 million per quarter, the annual dividend will be about 336 million dollars. With adjusted earnings for the trailing twelve months of about 1,028 million dollars, the payout ratio would be approximately 33%. This is a comfortable level that allows the company to sustain payments even if oil prices fall.
The company's dividend policy is not tied to a rigid ratio, but management focuses on the sustainability of free cash flow. Free cash flow for the quarter of 682 million dollars covers the dividend of 84 million more than eight times over. The main risk to the dividend is a fall in hydrocarbon prices, which could reduce cash flow. However, even if EBITDA halves, the payout would remain within 70%.
Valuation: EV/EBITDA 4.95 versus the three-year average of 4.58, and the portal model points to downside
EV/EBITDA for the trailing twelve months is 4.95, above the three-year average of 4.58. This means the shares trade slightly above their historical norm. At the same time, P/E LTM is 19.35, which also does not look cheap, but for a company with growing profits it is acceptable. Market capitalisation is 17,805 million dollars.
According to the portal model, which reprices EBITDA at current commodity prices at the target EV/EBITDA, the upside to fair value is minus 58%. This means that at current oil and gas prices the share looks overvalued relative to the model. However, the model is sensitive to price assumptions, and with higher hydrocarbon prices the valuation could change.
Comparison with history shows that the current multiple is above the three-year average, but not critically. Return on equity is 15.8%, which supports the valuation. The dividend yield of 1.86% is below the market average, but including buybacks the total return to the shareholder is higher. The key question is whether the company can sustain its margin at the current level.
Valuation on the latest reported figures
| Metric | Value |
|---|---|
| Market cap | 17.8 bn USD |
| P/E (LTM) | 19.4 |
| EV/EBITDA (LTM) | 4.9 |
| P/B | 1.59 |
| Net debt / EBITDA (LTM) | 1.31 |
| Operating cash flow (LTM) | 3.70 bn |
| ROE | 15.8% |
| Dividend yield (12m) | 1.9% |
| EV/EBITDA, 3-year average | 4.6 |
Bottom line
Bottom line: Ovintiv delivered a strong quarter – revenue rose 23.9%, EBITDA 41.8%, and adjusted earnings 85.3%. However, headline net profit grew only 48.5% due to a one-off loss on asset sales of 337 million. Free cash flow of 682 million covers dividends and buybacks, while leverage fell to 1.31 times EBITDA. The shares look attractive: EV/EBITDA 4.95 versus the three-year average of 4.58, although the portal model points to downside. The key question for a holder is whether the company can sustain its 52.7% margin if oil prices fall.
Open the company's financial profile OVV →
See also: market overview · valuation map · stock screeners