Palantir Technologies Inc.: revenue doubled, but the market has already priced in the future

On August 3, 2026, Palantir Technologies Inc. reported results for the second quarter of 2026. Revenue grew 92.8% year-over-year to $1,935.5 million, EBITDA rose 336.0% to $1,202.7 million, and net profit increased 225.0% to $1,061.9 million. The shares look attractive despite the high valuation, thanks to accelerating growth and improving margins.
Key takeaways
— Revenue accelerated to 92.8% driven by explosive growth in the US commercial segment
— EBITDA margin doubled year-over-year to 62.1%
— Net profit grew 225% due to operating leverage and a low tax rate
— Operating cash flow rose to $1,216.2 million in the quarter
— The company raised its 2026 revenue guidance to $8,150–8,158 million
— Shares rose 41.7% after the report, but the portal's model sees another 14% upside
Attractiveness
Key figures, USD bn
| Metric | Q2 2025 | Q2 2026 | Change |
|---|---|---|---|
| Revenue | 1.00 | 1.94 | +92.8% |
| EBITDA | 0.28 | 1.20 | +336.0% |
| Operating profit | 0.27 | 0.91 | +238.6% |
| Net profit | 0.33 | 1.06 | +225.0% |
| Operating cash flow | 0.54 | 1.22 | +125.5% |
| Capex | 0.01 | 0.01 | +91.2% |
| EBITDA margin | 27.5% | 62.1% | +34.6 pp |
| Net margin | 32.6% | 54.9% | +22.3 pp |
Revenue accelerated to 92.8% driven by explosive growth in the US commercial segment
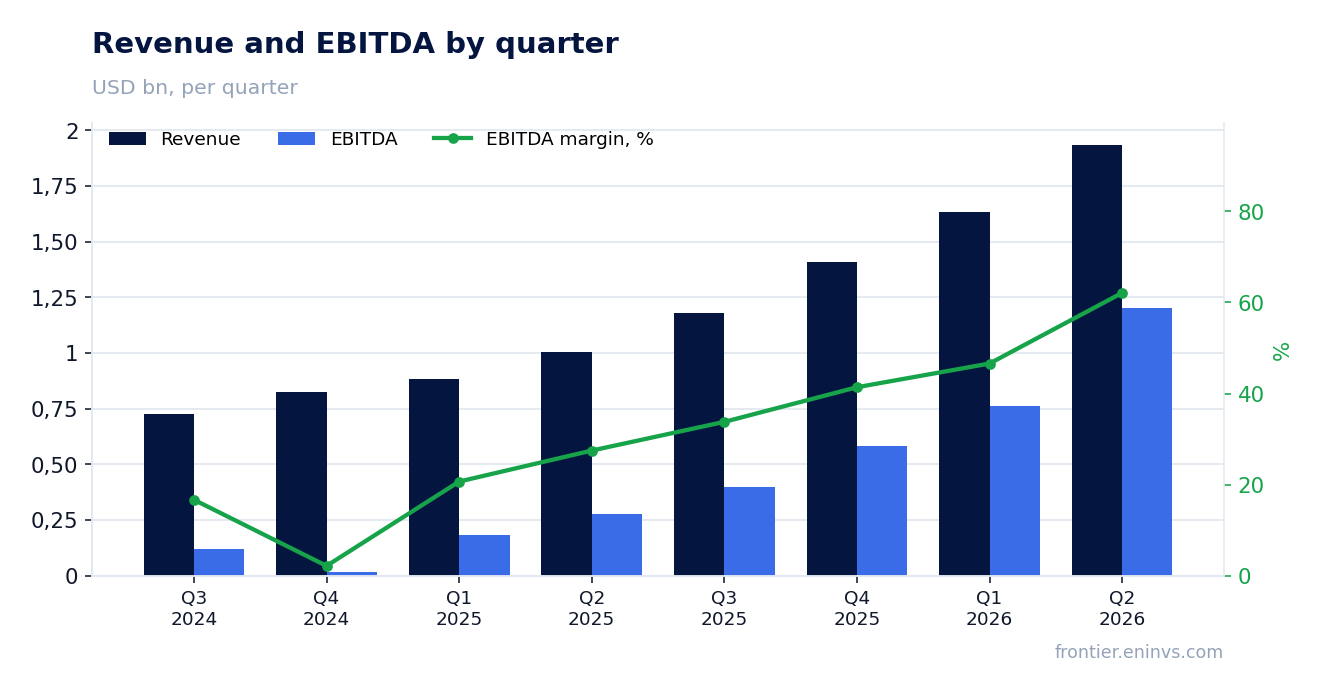
In the second quarter of 2026, Palantir Technologies Inc.'s revenue reached $1,935.5 million, up 92.8% year-over-year. This is an acceleration from previous quarters: in Q1 2026 growth was 84.7%, and in Q4 2025 – 70.0%.
The main driver was the US commercial segment: its revenue grew 149% year-over-year to $764 million, accounting for about 40% of total revenue. The US government segment grew 90% to $809 million, and international markets also contributed, albeit at a slower pace.
EBITDA margin doubled year-over-year to 62.1%
EBITDA for Q2 2026 reached $1,202.7 million, up 336.0% year-over-year. EBITDA margin hit 62.1% versus 27.5% in Q2 2025.
The margin expansion is driven by operating leverage: revenue is growing faster than operating expenses. The company also reported a record Rule of 40 score of 155%, reflecting a combination of high growth and high adjusted operating margin.
Net profit grew 225% due to operating leverage and a low tax rate
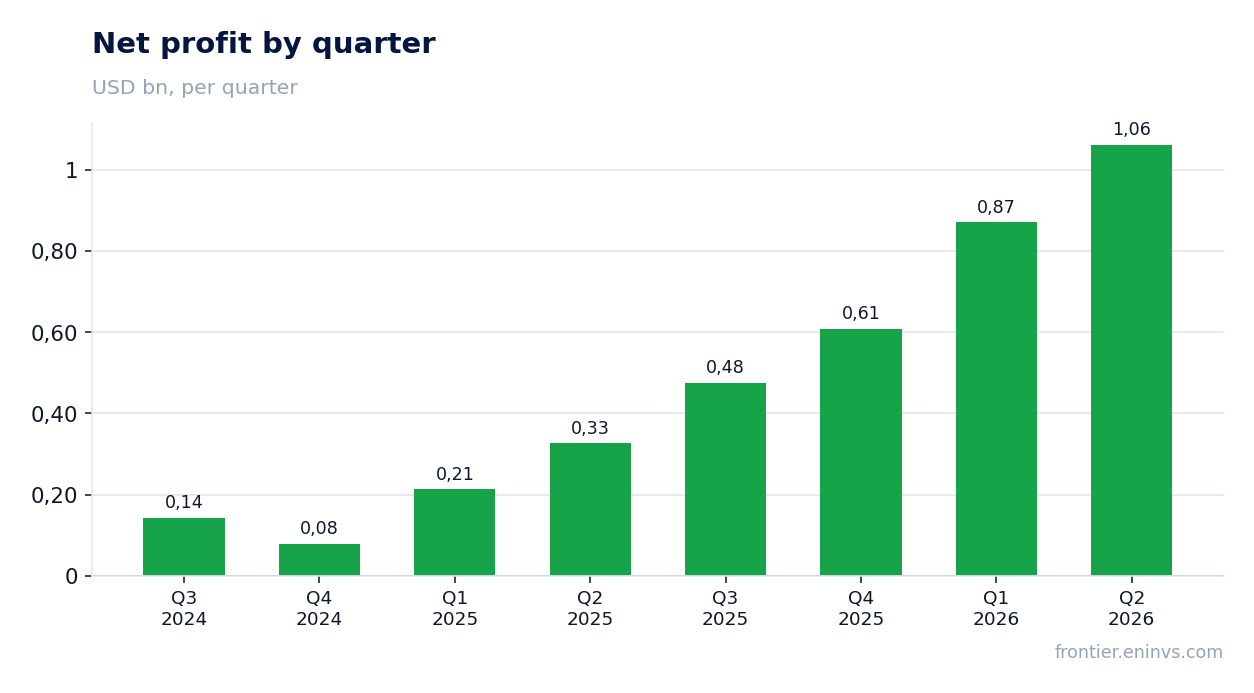
Net profit in Q2 2026 reached $1,061.9 million, up 225.0% year-over-year. Net margin hit 54.9% versus 32.6% in Q2 2025.
Besides operating leverage, profit was positively affected by interest income ($77.5 million) and other income ($91.8 million), as well as a low effective tax rate of about 1.4% ($15.4 million in income tax on pre-tax income of $1,081.3 million).
Operating cash flow rose to $1,216.2 million in the quarter
Operating cash flow in Q2 2026 was $1,216.2 million, more than double the year-ago figure of $539.3 million. Adjusted free cash flow reached $1,220.4 million, corresponding to a 63% margin.
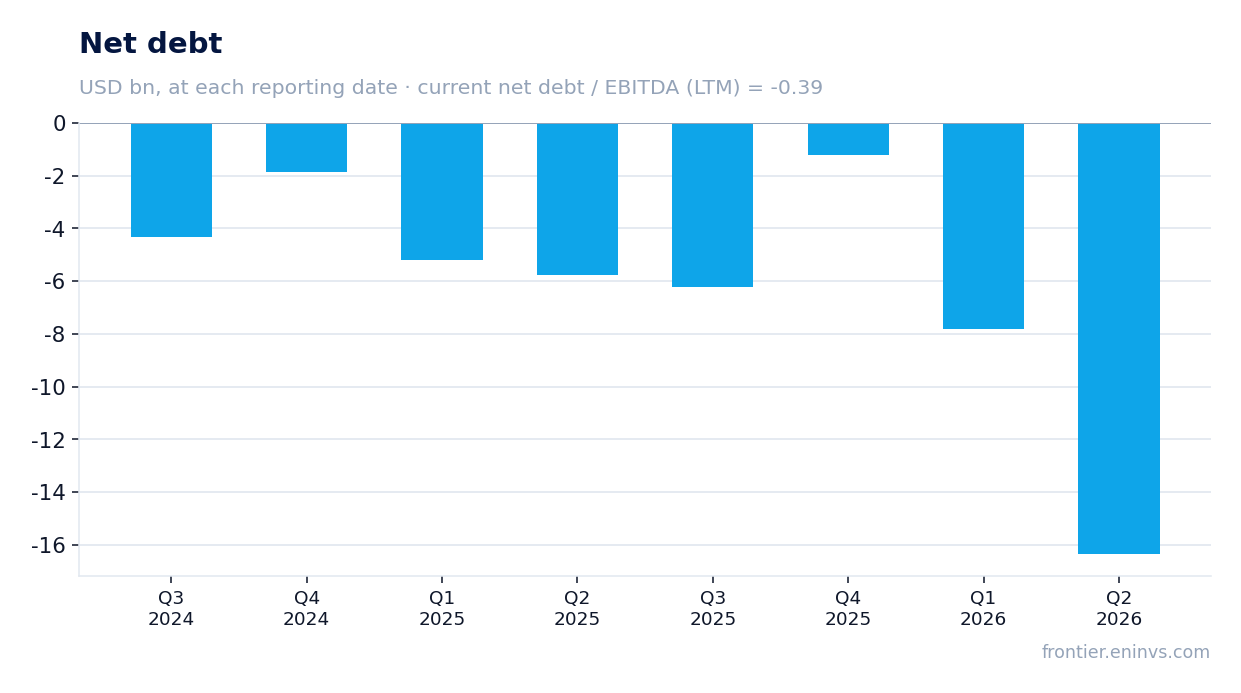
Capital expenditures remain minimal – just $14.6 million for the quarter, typical for a software business. Net debt is negative at -$16,367.7 million, reflecting the company's substantial cash cushion.
The company raised its 2026 revenue guidance to $8,150–8,158 million
Palantir Technologies Inc. raised its full-year 2026 revenue guidance to $8,150–8,158 million, implying growth of about 82% year-over-year. The US commercial revenue guidance was raised to over $3,424 million, representing growth of at least 134%.
The company also raised its adjusted operating income guidance to $4,889–4,897 million and adjusted free cash flow to $4,500–4,700 million. Management expects positive GAAP operating and net income in each quarter of the year.
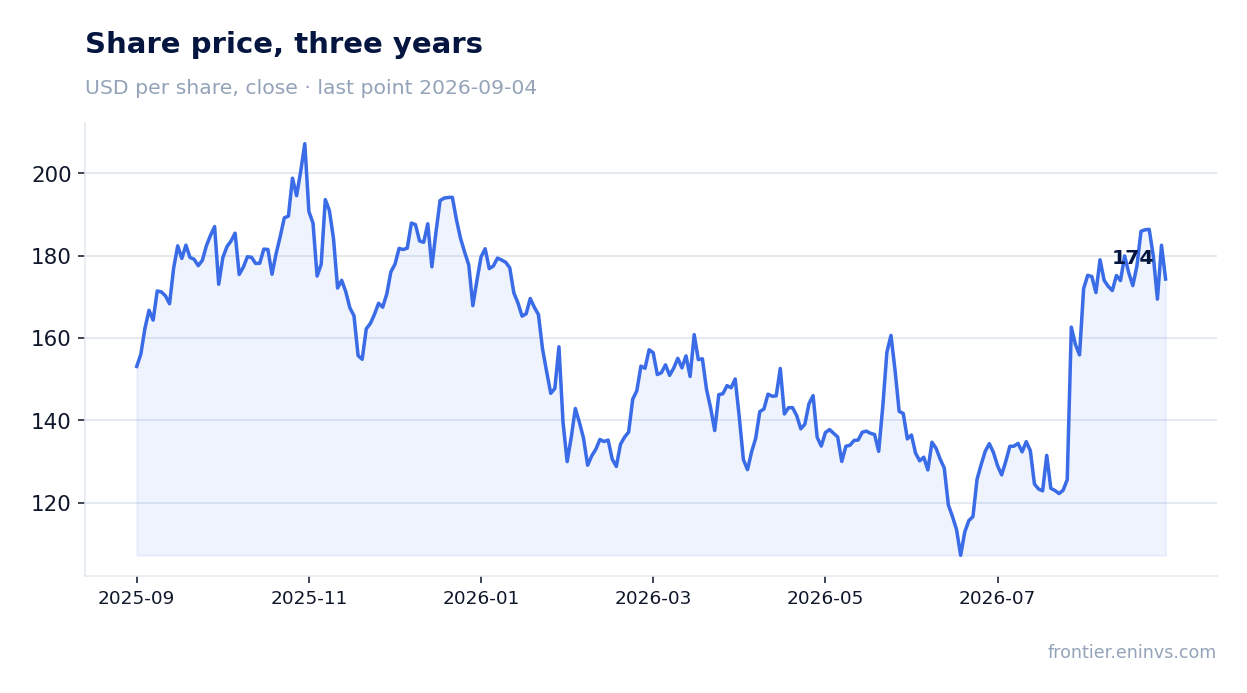
Shares rose 41.7% after the report, but the portal's model sees another 14% upside
The share price before the report was $123.06, up 2.1% on the release day, and by September 4, 2026, it had risen 41.7%. The current market capitalization is $410,759.0 million.
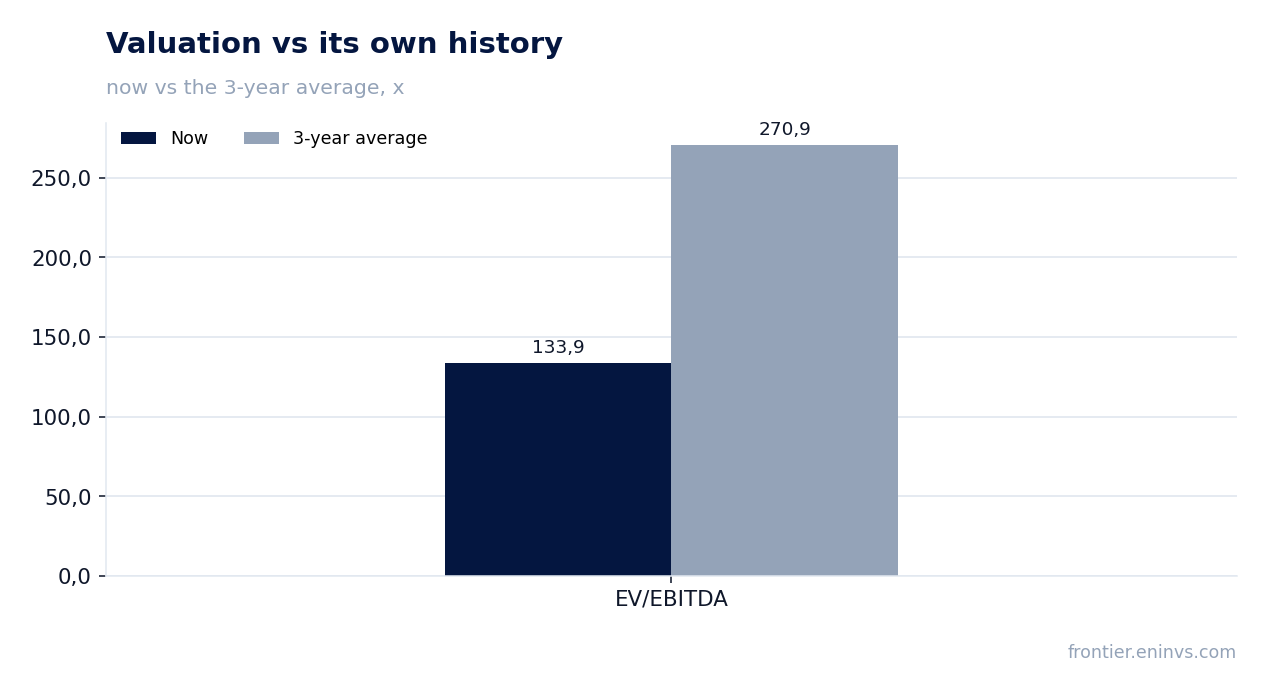
Multiples remain high: P/E LTM is 136.2, EV/EBITDA LTM is 133.9, significantly above the three-year average of 270.9 for EV/EBITDA. According to the portal's model, the upside is +14% to fair value, making the stock attractive despite the apparent overvaluation.
Valuation on the latest reported figures
| Metric | Value |
|---|---|
| Market cap | 411 bn USD |
| P/E (LTM) | 136.2 |
| EV/EBITDA (LTM) | 133.9 |
| P/B | 55.60 |
| Net debt / EBITDA (LTM) | -0.39 |
| Operating cash flow (LTM) | 2.10 bn |
| ROE | 46.6% |
| EV/EBITDA, 3-year average | 270.9 |
Bottom line
Palantir Technologies Inc.'s Q2 2026 report was strong: revenue accelerated to 92.8%, EBITDA margin doubled to 62.1%, and cash flow reached record levels. The company raised guidance, confirming management's confidence in continued growth. However, the current valuation already prices in much of the good news: shares rose 41.7% after the report, and multiples remain at extreme levels. Nevertheless, the portal's model shows 14% upside, making the stock attractive for long-term investors willing to tolerate volatility.
Open the company's financial profile PLTR →
See also: market overview · valuation map · stock screeners