Philip Morris International Inc.: revenue tops $11 billion for the first time, but profit falls on RBH impairment
22 июля 2026 года Philip Morris International Inc. раскрыла результаты за второй квартал 2026 года. Выручка выросла на 10,4% до $11,2 млрд, впервые превысив $11 млрд, EBITDA — на 20,1%, однако чистая прибыль снизилась на 7,3% до $2,8 млрд из-за неденежного обесценения инвестиции в RBH на $511 млн. Акции выглядят скорее привлекательно: рост ускоряется, маржа расширяется, но оценка выше собственной трехлетней истории, а дивидендная доходность ниже средней.
Key takeaways
— Выручка впервые за квартал превысила $11 млрд, рост ускорился до 10,4%
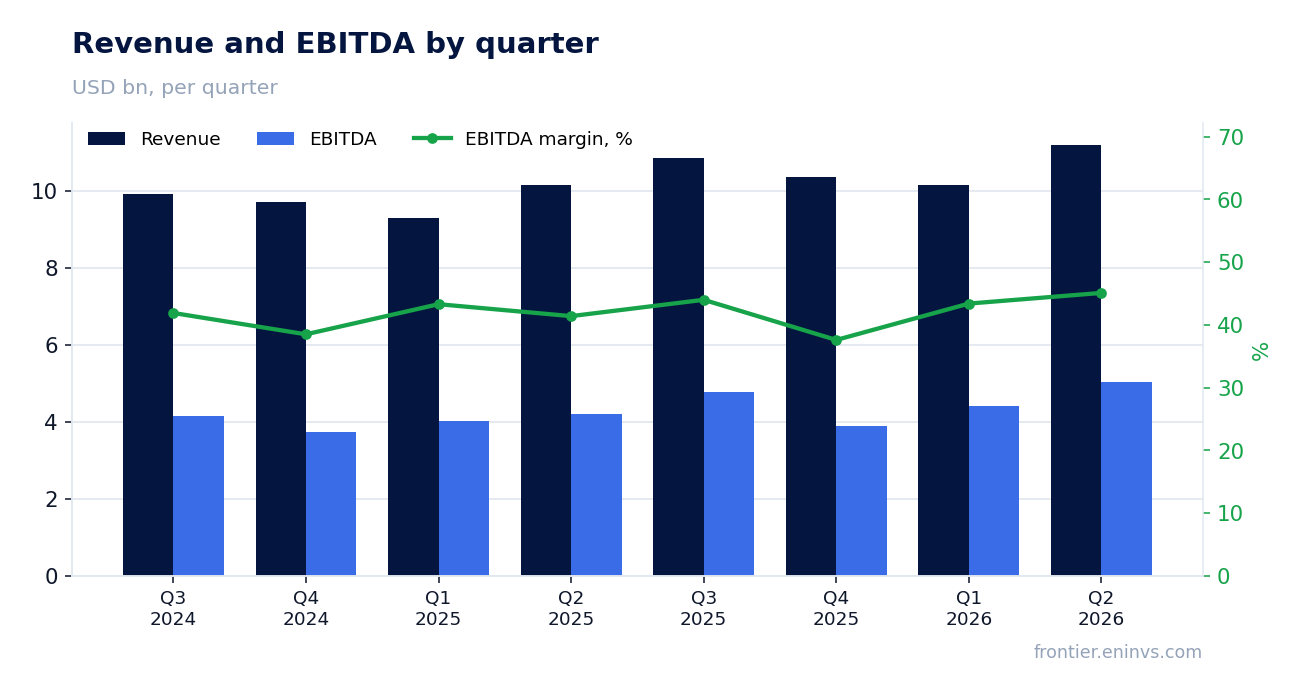
— EBITDA выросла на 20,1%, маржа расширилась до 45,1%
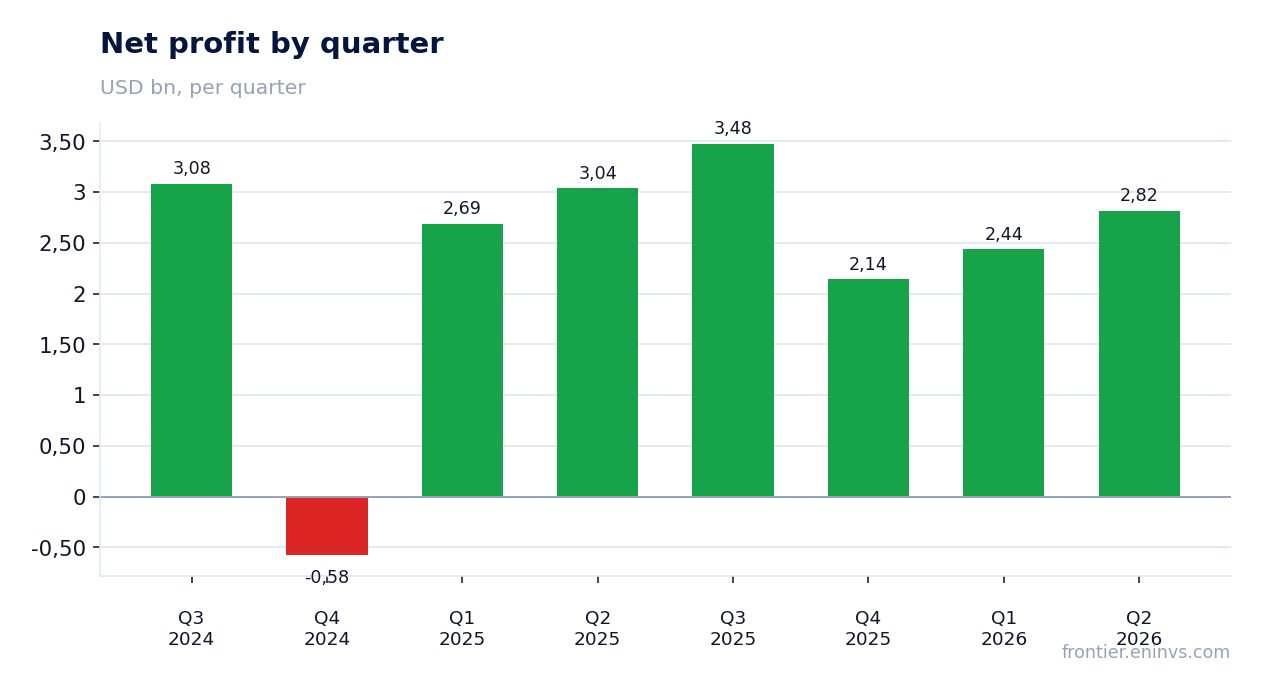
— Чистая прибыль упала на 7,3% из-за разового обесценения RBH на $511 млн
— Бездымный бизнес принес 42% выручки и растёт быстрее общего
— Скорректированная прибыль на акцию выросла на 15,2%, прогноз повышен
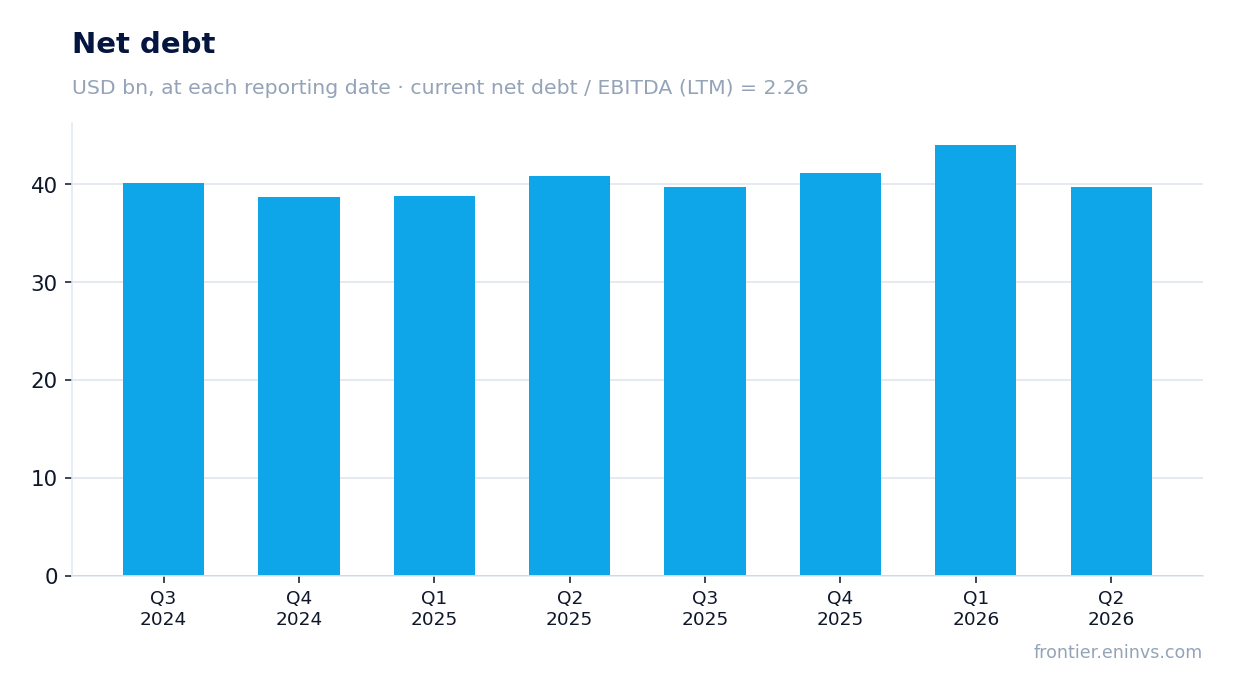
— Долговая нагрузка 2,26x EBITDA, компания целится в 2,0x к концу года
— Акции торгуются дороже своей трехлетней истории, модель портала даёт +18%
Attractiveness
Key figures, USD bn
| Metric | Q2 2025 | Q2 2026 | Change |
|---|---|---|---|
| Revenue | 10.1 | 11.2 | +10.4% |
| EBITDA | 4.20 | 5.05 | +20.1% |
| Operating profit | 3.71 | 4.53 | +22.0% |
| Net profit | 3.04 | 2.82 | -7.3% |
| Operating cash flow | 3.41 | 5.49 | +61.0% |
| Capex | 0.36 | 0.38 | +6.7% |
| EBITDA margin | 41.4% | 45.1% | +3.7 pp |
| Net margin | 30.0% | 25.2% | -4.8 pp |
Revenue tops $11 billion for the first time in a quarter, growth accelerates to 10.4%
In Q2 2026, Philip Morris International Inc. revenue reached $11,192 million, up 10.4% year-on-year. This is an acceleration from +9.1% in Q1 2026 and +7.1% in Q2 2025. Organic growth, excluding currency, was 7.6%.
The main driver was international smoke-free products: revenue grew 14.2% (organically 11.8%) on shipment volume growth of 8.0%. The combustible business also contributed: international combustibles revenue rose 9.8% (organically 6.4%) on 10.0% pricing. In the U.S., revenue declined 0.7% (organically 0.9%) on weak ZYN and cigar dynamics.
EBITDA up 20.1%, margin expands to 45.1%
EBITDA in Q2 2026 was $5,043 million, up 20.1% year-on-year. EBITDA margin expanded from 41.4% to 45.1%. Operating income rose 22.0% to $4,530 million, with organic growth of 10.7%.
Margin expansion was driven by strong pricing (price contribution to revenue of $689 million), volume growth, favorable mix in the smoke-free segment, and scale effects. Gross profit rose 11.5% (organically 8.7%), with gross margin up 0.7 pp to 68.5%.
Net profit falls 7.3% on one-off RBH impairment of $511 million
Net profit in Q2 2026 was $2,817 million, down 7.3% year-on-year. The cause is a non-cash impairment of the RBH equity investment in Canada of $511 million (33 cents per share), which hit reported profit. Excluding this one-off, the trend would have been positive.
Adjusted diluted EPS rose 15.2% to $2.20, or 13.6% excluding currency. Reported diluted EPS fell 7.7% to $1.80. The impairment follows a revision of RBH's five-year financial projections after the business plan was provided to the Plan Administrator.
Smoke-free business contributes 42% of revenue and grows faster than the total
Smoke-free products (heated tobacco, nicotine pouches, e-vapor) contributed approximately 42% of total revenue in Q2 2026, up 0.5 pp from a year earlier. Revenue in this segment grew 11.7% (organically 9.7%), with shipment volumes up 7.5%.
The key driver is IQOS: heated tobacco unit volumes rose 7.6%, and IQOS share of the combined cigarette and HTU category reached 9.2%. Products are available in 109 markets. VEEV e-vapor shipments grew 55.1%, making it the #1 closed-pod system in Europe. ZYN nicotine pouches are available in 60 markets, with volumes up 14.7% (26.3% excluding the Nordics).
Adjusted EPS up 15.2%, guidance raised
Adjusted diluted EPS in Q2 2026 was $2.20, up 15.2% year-on-year ($1.91). Excluding currency, growth was 13.6%. The company raised its 2026 adjusted diluted EPS guidance to $8.26–$8.41, implying growth of 9.5–11.5% over the prior year.
The guidance raise is currency-only: a favorable Q2 effect ($0.03 per share) is partly offset by a stronger U.S. dollar, so the full-year currency benefit was cut from $0.20 to $0.15. Excluding currency, growth is forecast at 7.5–9.5%.
Leverage at 2.26x EBITDA, company targets 2.0x by year-end
Net debt at the end of Q2 2026 was $39,708 million, down $4.3 billion from the previous reporting date. Net debt to EBITDA for the trailing twelve months was 2.26x. The company reiterated its target of reducing this ratio to approximately 2.0x by the end of 2026.
Operating cash flow in Q2 was $5,492 million, well above the average of prior quarters (Q1 2026 was negative at -$399 million). Capital expenditures in Q2 were $380 million, in line with the full-year guidance of $1.4–1.6 billion.
Shares trade above their three-year history, portal model implies +18%
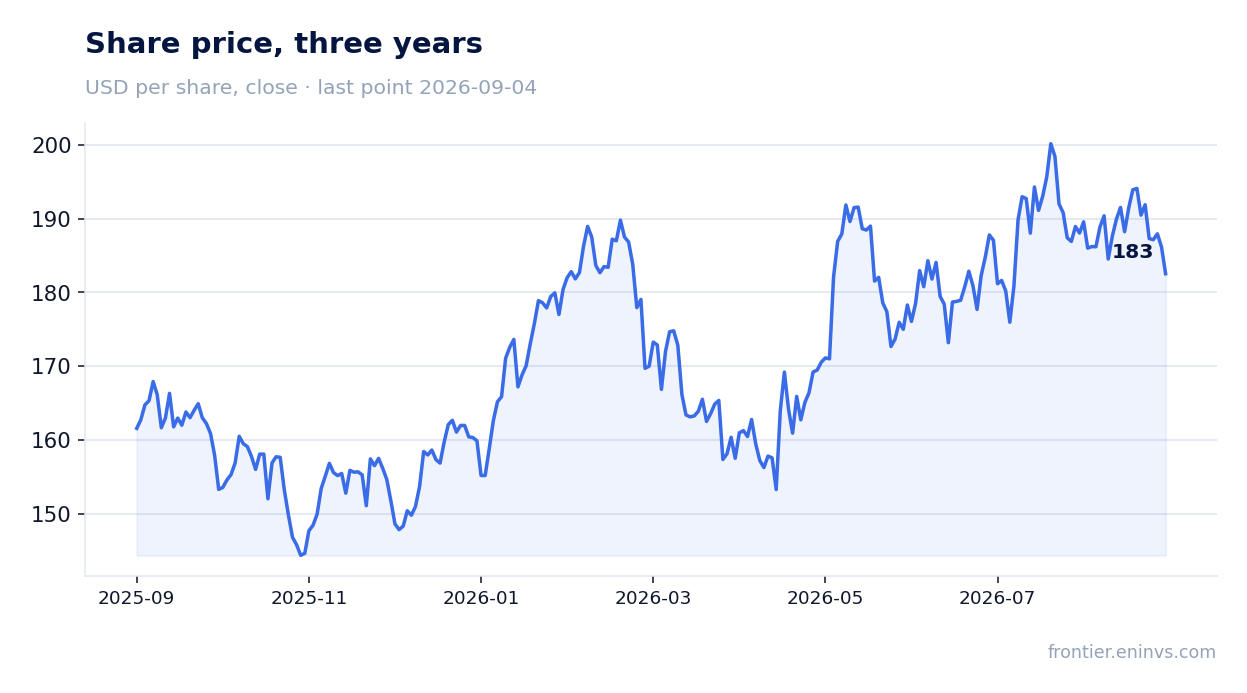
Shares closed at $188.04 before the release. On the release day they rose 3.3%, but by September 4, 2026, they were down 2.9% from the post-release level. Current market capitalization is $284,016.68 million.
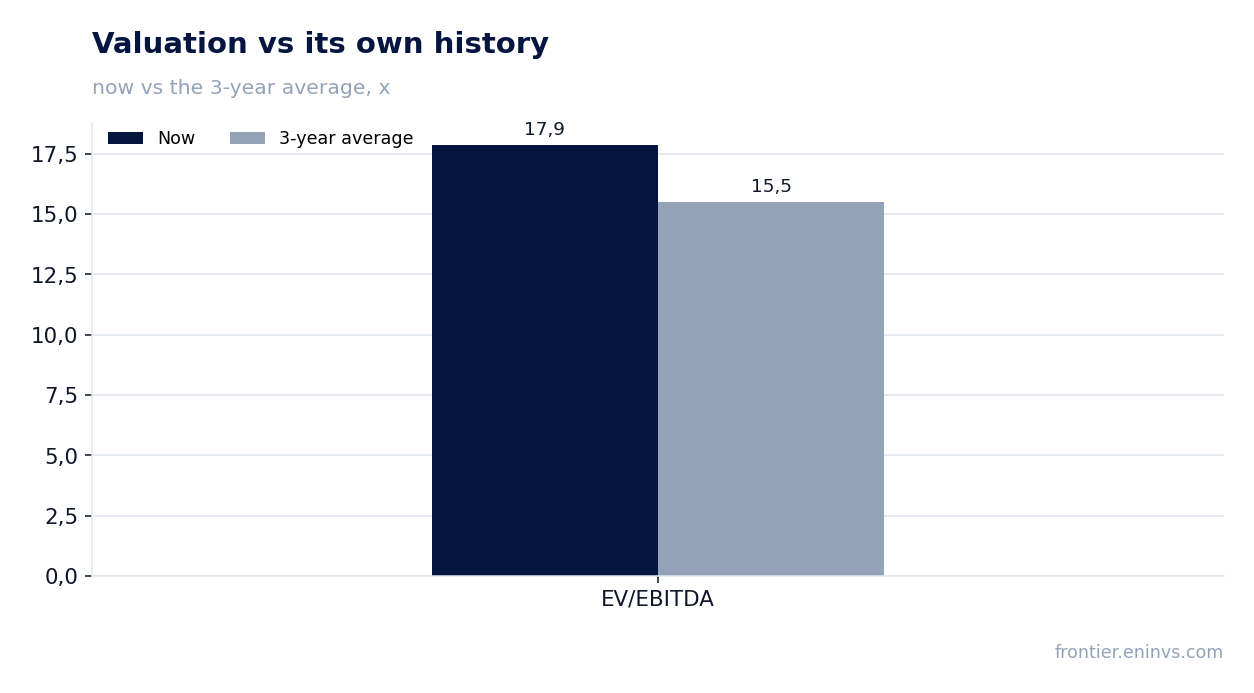
EV/EBITDA for the trailing twelve months is 17.88x, above the three-year average of 15.51x. P/E for the trailing twelve months is 26.12x. On the portal's model, based on EBITDA growth times a target multiple, the upside to fair value is +18%.
Valuation on the latest reported figures
| Metric | Value |
|---|---|
| Market cap | 284 bn USD |
| P/E (LTM) | 26.1 |
| EV/EBITDA (LTM) | 17.9 |
| Net debt / EBITDA (LTM) | 2.26 |
| Operating cash flow (LTM) | 12.2 bn |
| ROE | -112.7% |
| Dividend yield (12m) | 3.2% |
| EV/EBITDA, 3-year average | 15.5 |
Bottom line
Во втором квартале 2026 года Philip Morris International Inc. показала сильный органический рост: выручка впервые превысила $11 млрд, EBITDA выросла на 20,1%, маржа расширилась до 45,1%. Падение чистой прибыли на 7,3% — результат разового неденежного обесценения RBH, не связанного с операционной деятельностью. Скорректированная прибыль на акцию выросла на 15,2%, и компания повысила годовой прогноз. Долговая нагрузка снижается, компания целится в 2,0x к концу года. Однако акции торгуются выше собственной трехлетней истории по EV/EBITDA (17,88x против 15,51x), что ограничивает потенциал роста, несмотря на +18% по модели портала. Вердикт — скорее привлекательно: сильный операционный импульс и снижение долга поддерживают акции, но оценка уже учитывает много хорошего.
Open the company's financial profile PM →
See also: market overview · valuation map · stock screeners