Permian Resources: profit nearly quadrupled, but one-offs and gas hedges carried half the quarter
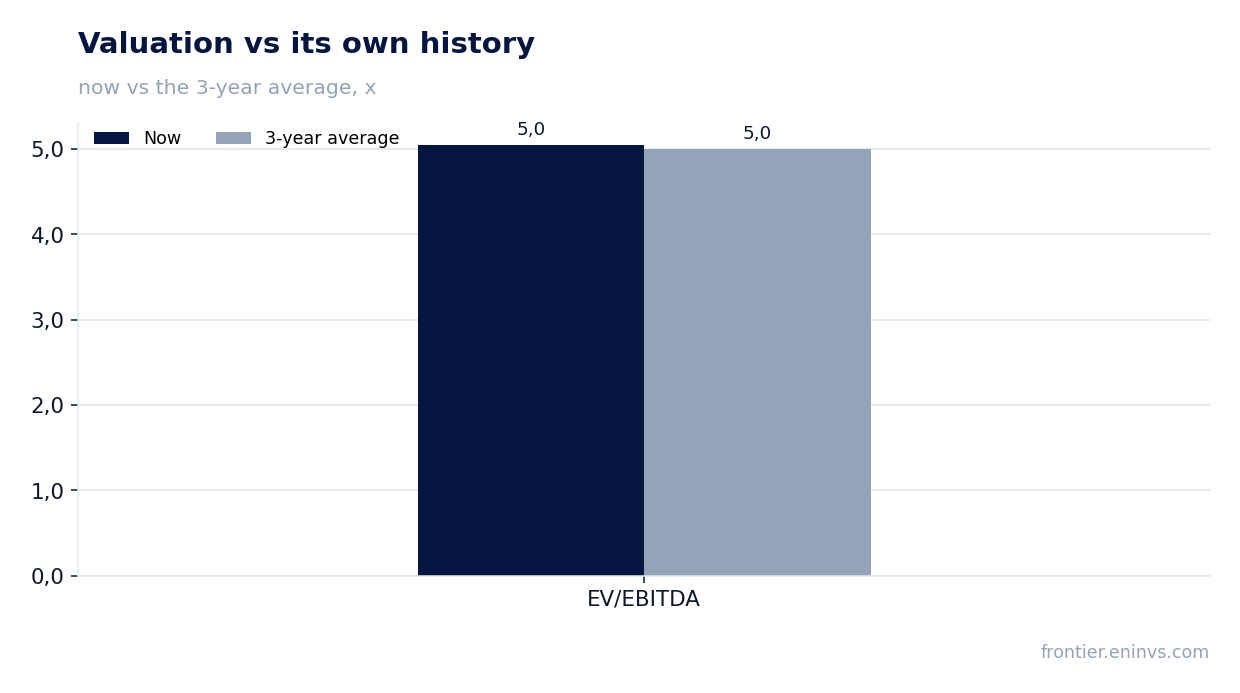
On August 5, Permian Resources Corporation reported second-quarter 2026 results. Revenue jumped 55.1% year on year to $1,858.0 million, EBITDA rose 78.7% to $1,428.3 million, and net profit surged 282.6% to $792.5 million. The EBITDA margin reached 76.9% versus 66.7% a year earlier, but the leap was largely driven by a realised oil price of $97.81 per barrel and one-off items rather than a durable improvement in the business. With an EV/EBITDA of 5.05 against its own three-year average of 5.00 and a dividend yield of 2.62%, the stock is fairly valued but not cheap – a neutral verdict.
Key takeaways
— Revenue rose 55.1% year on year, with almost all the gain coming from oil at $97.81 per barrel
— EBITDA margin climbed to 76.9% on high oil prices and curtailment of loss-making gas production
— Net profit grew 3.8-fold, but $139.1 million of it was a non-cash derivative revaluation
— Free cash flow reached $751 million even as capital expenditure rose to $521 million
— Debt is falling: the company redeemed $550 million of notes, and net debt to EBITDA stands at 0.84
— Dividend yield of 2.62% on a quarterly payout of $0.16 per share – a payout ratio below 40% of profit
— EV/EBITDA of 5.05 is virtually in line with the three-year average of 5.00, leaving no room for multiple expansion
Attractiveness
Key figures, USD bn
| Metric | Q2 2025 | Q2 2026 | Change |
|---|---|---|---|
| Revenue | 1.20 | 1.86 | +55.1% |
| EBITDA | 0.80 | 1.43 | +78.7% |
| Operating profit | 0.30 | 0.93 | +212.0% |
| Net profit | 0.21 | 0.79 | +282.6% |
| Operating cash flow | 1.04 | 1.51 | +45.0% |
| Capex | 0.51 | 0.33 | -35.2% |
| EBITDA margin | 66.7% | 76.9% | +10.2 pp |
| Net margin | 17.3% | 42.7% | +25.4 pp |
Revenue rose 55.1% year on year, with almost all the gain coming from oil at $97.81 per barrel
Revenue in the second quarter of 2026 was $1,858.0 million, up 55.1% year on year. The jump is primarily explained by price: the average realised oil price reached $97.81 per barrel versus $62.71 in the second quarter of 2025. Oil sales brought in $1,762.9 million, or 95% of total revenue.
Oil production rose 12% to 198,071 barrels per day, while gas and NGL output declined. The company deliberately curtailed high-GOR gas production because gas prices at the Waha hub were negative: averaging minus $3.14 per Mcf. That decision supported revenue, as gas was being sold at a loss.
Total production in oil-equivalent terms even fell to 376,409 barrels per day from 385,118 a year earlier. So revenue growth of 55% on a 2% decline in physical volumes is purely a price and mix effect. Sustaining this dynamic requires consistently high oil prices.
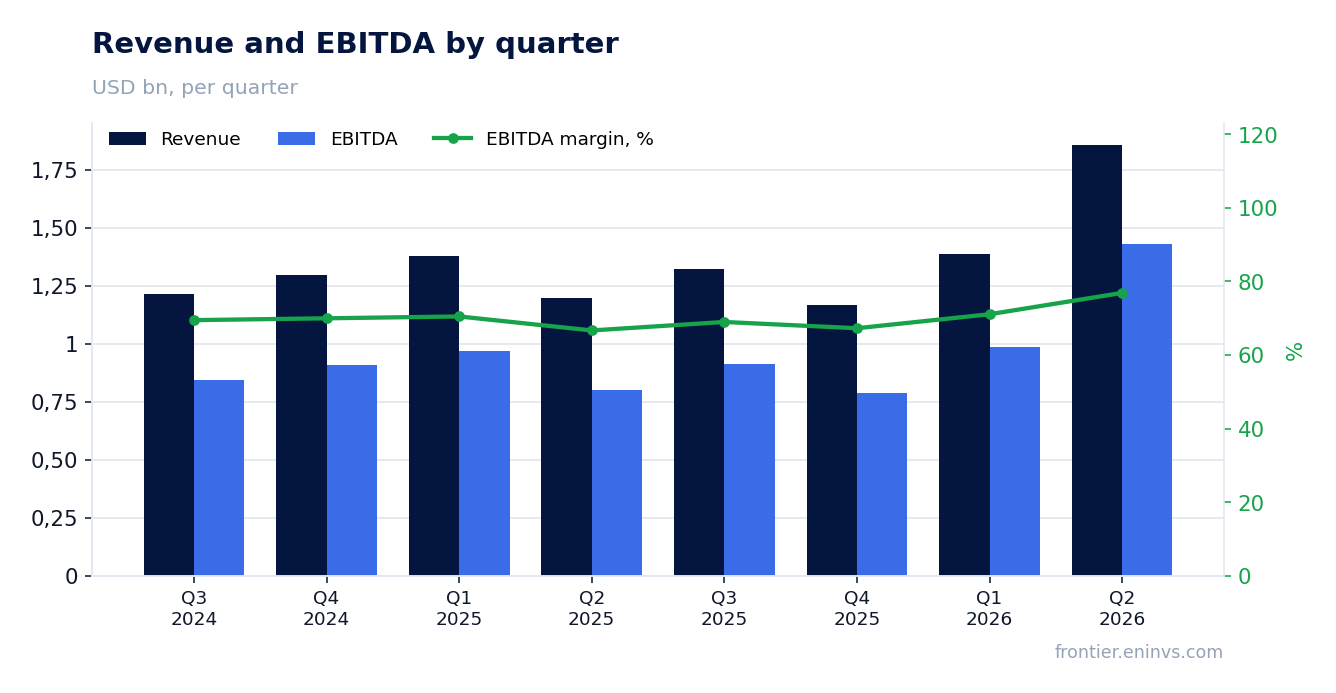
EBITDA margin climbed to 76.9% on high oil prices and curtailment of loss-making gas production
EBITDA in the second quarter was $1,428.3 million, with the margin reaching 76.9% versus 66.7% a year earlier. Such a margin level is unusual even for the oil and gas sector and reflects a combination of record oil prices and low unit costs.
Total controllable cash costs were $7.49 per barrel of oil equivalent, including lease operating expenses of $5.55, gathering, processing and transportation of $1.07, and cash G&A of $0.87. The company notes that cost reduction was achieved through optimisation of power supply and compression equipment.
However, the margin expansion is partly driven by one-off factors: curtailment of negative-margin gas production and high oil prices. If oil prices return to around $70, the EBITDA margin could fall to 60–65%, still above average but no longer delivering the same profit boost.
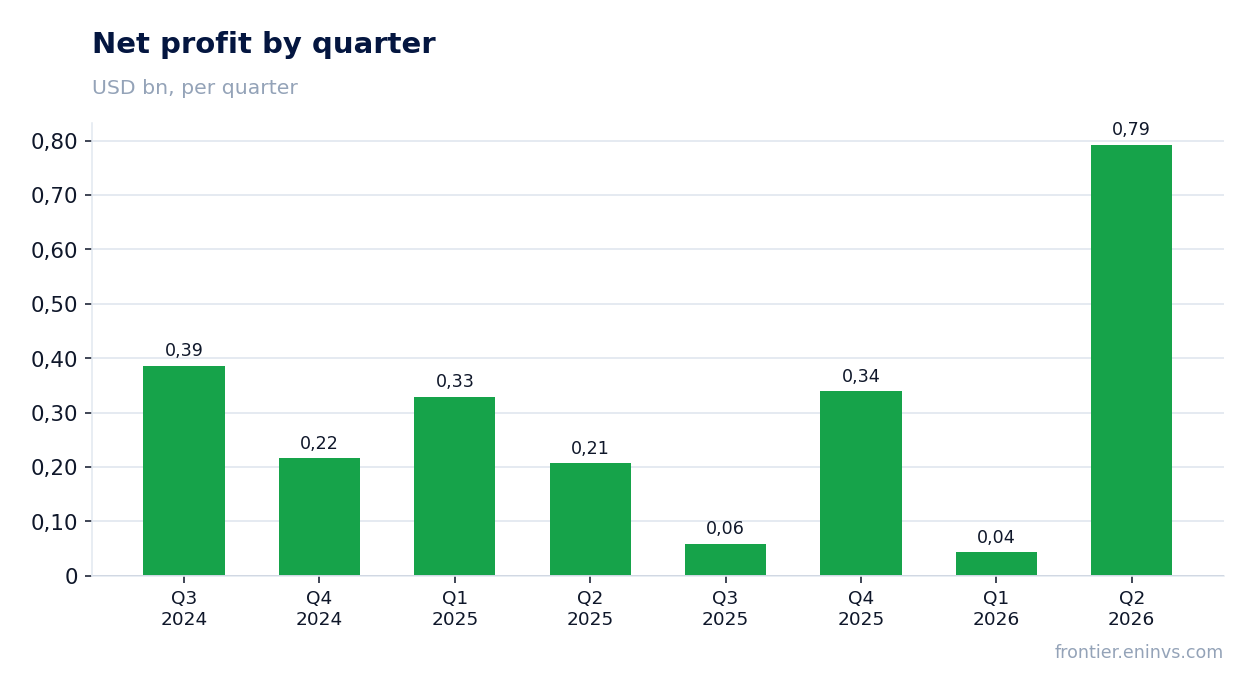
Net profit grew 3.8-fold, but $139.1 million of it was a non-cash derivative revaluation
Net profit in the second quarter of 2026 was $792.5 million versus $207.1 million a year earlier – growth of 282.6%. However, the profit includes an item unrelated to operations: a net gain on derivative instruments of $139.1 million. This is a non-cash revaluation of hedges that could reverse in the next quarter.
Operating profit rose to $928.2 million from $297.5 million a year earlier, reflecting high oil prices and lower unit costs. Depreciation, depletion and amortisation remained almost flat at $500.2 million, indicating a stable asset base.
Excluding the one-off derivative revaluation, net profit would have been around $653 million, still significantly above last year's level. But it is important to understand that the sustainability of this profit level depends on high oil prices persisting.
Free cash flow reached $751 million even as capital expenditure rose to $521 million
Operating cash flow for the quarter was $1,506 million, and adjusted free cash flow was $751 million. This funded capital expenditure of $521 million and allowed funds to be directed to debt repayment and dividends.
Capital expenditure rose versus initial plans as the company increased investment in high-return projects such as workovers. At the same time, drilling and completion costs per lateral foot remain in line with the annual plan. The company drilled its first four-mile laterals, which could reduce unit costs in the future.
Free cash flow of $751 million is a substantial sum that covers dividends (about $134 million for the quarter) and leaves room for debt reduction. However, if oil prices fall, free cash flow could shrink as capital expenditure remains high.
Debt is falling: the company redeemed $550 million of notes, and net debt to EBITDA stands at 0.84
During the quarter, Permian Resources redeemed $550 million of principal of legacy Earthstone 8.000% notes due 2027. A further $325 million of Earthstone 9.875% notes were redeemed on July 15, 2026. This reduces annual cash interest expense by approximately $75 million.
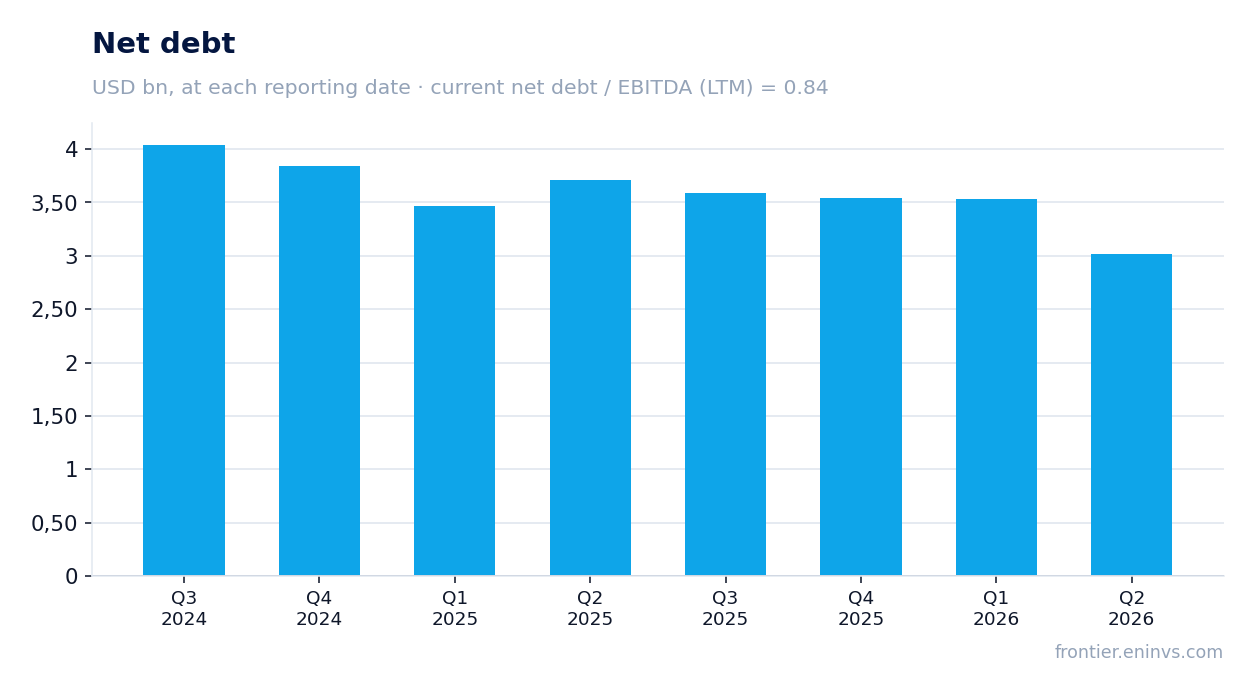
Net debt at the end of the quarter was $3,019.1 million, and the ratio of net debt to trailing twelve-month EBITDA was 0.84. This is a low leverage level that gives the company financial flexibility. Since the start of 2025, total debt has been reduced by about 35% – from $4.2 billion to $2.7 billion.
Interest expense for the quarter was $59.6 million versus $72.8 million a year earlier, reflecting debt reduction and refinancing at lower rates. The company expects its year-end 2026 net debt to EBITDA ratio to remain around 0.5x.
Dividend yield of 2.62% on a quarterly payout of $0.16 per share – a payout ratio below 40% of profit
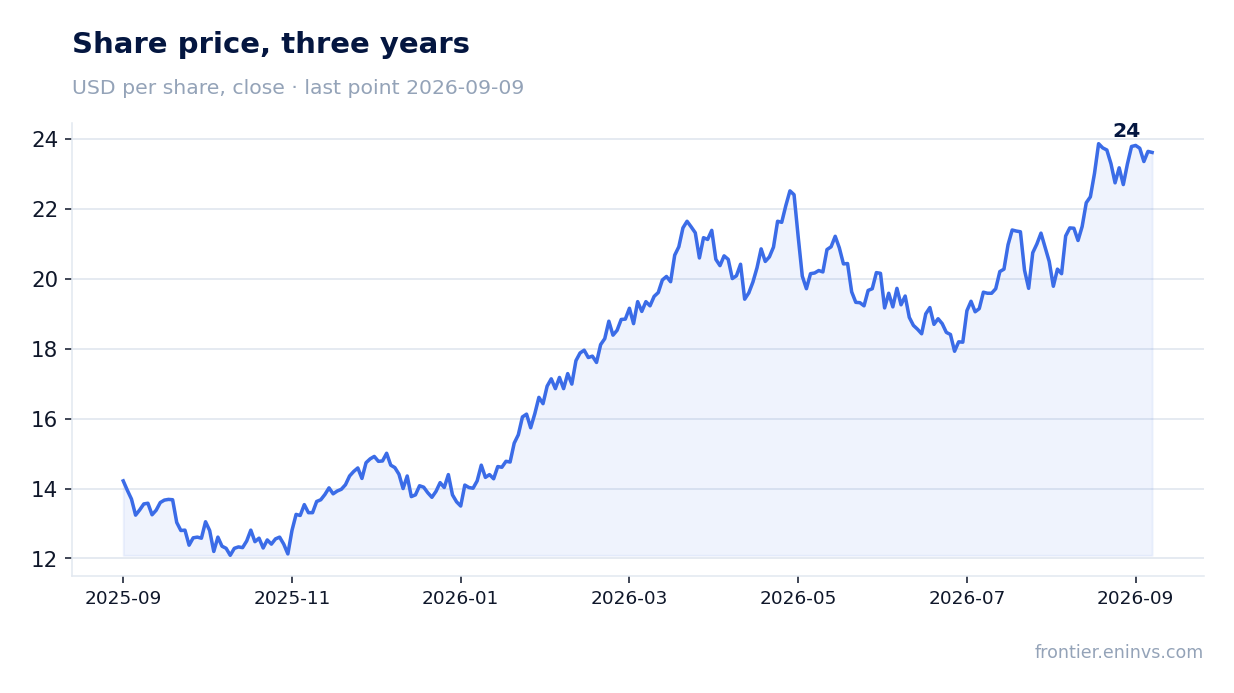
The board declared a quarterly dividend of $0.16 per Class A share, equivalent to $0.64 annualised. At a share price of around $20.5 before the release, the trailing twelve-month dividend yield is 2.62%. This is a moderate level, below the current key rate but above the sector average.
The company follows a sustainable base dividend policy, and the current payout is less than 40% of trailing twelve-month net profit. If high oil prices and current free cash flow levels persist, the dividend could be increased. However, if oil prices fall, the payout ratio could rise, limiting room for increases.
The dividend is paid quarterly, providing regular income. The 2.62% yield is not a record for the company, but given low leverage and strong free cash flow, it looks sustainable. The main risk is a decline in oil prices, which could lead to a dividend cut.
EV/EBITDA of 5.05 is virtually in line with the three-year average of 5.00, leaving no room for multiple expansion
The current EV/EBITDA multiple is 5.05, virtually in line with the three-year average of 5.00. This means the market values the company roughly as it has on average over the past three years, despite record profits. There is almost no room for multiple expansion.
The trailing twelve-month P/E is 14.38, which also does not look cheap for an oil and gas company. However, given low leverage and strong free cash flow, the current valuation may be justified. ROE is 27.2%, indicating efficient use of capital.
Comparison with its own history shows the stock is trading at its average levels. For the share price to rise, either sustained profit growth or an improvement in industry conditions is needed. Otherwise, the stock may remain range-bound.
Valuation on the latest reported figures
| Metric | Value |
|---|---|
| Market cap | 17.8 bn USD |
| P/E (LTM) | 14.4 |
| EV/EBITDA (LTM) | 5.0 |
| P/B | 1.73 |
| Net debt / EBITDA (LTM) | 0.84 |
| Operating cash flow (LTM) | 3.60 bn |
| ROE | 27.2% |
| Dividend yield (12m) | 2.6% |
| EV/EBITDA, 3-year average | 5.0 |
Bottom line
The quarter was exceptionally strong in absolute terms: revenue rose 55%, EBITDA 79%, and net profit nearly quadrupled. However, a significant part of this growth is due to record oil prices and a one-off derivative revaluation, rather than a durable improvement in operating efficiency. Leverage is falling, free cash flow covers dividends, but the EV/EBITDA multiple is already at its three-year average, leaving no room for valuation expansion. For a shareholder, the key question now is whether the company can sustain this profit level at lower oil prices.
Open the company's financial profile PR →
See also: market overview · valuation map · stock screeners