QUALCOMM INC/DE: revenue declines, but automotive grows 61% — and that doesn't save the stock from overvaluation

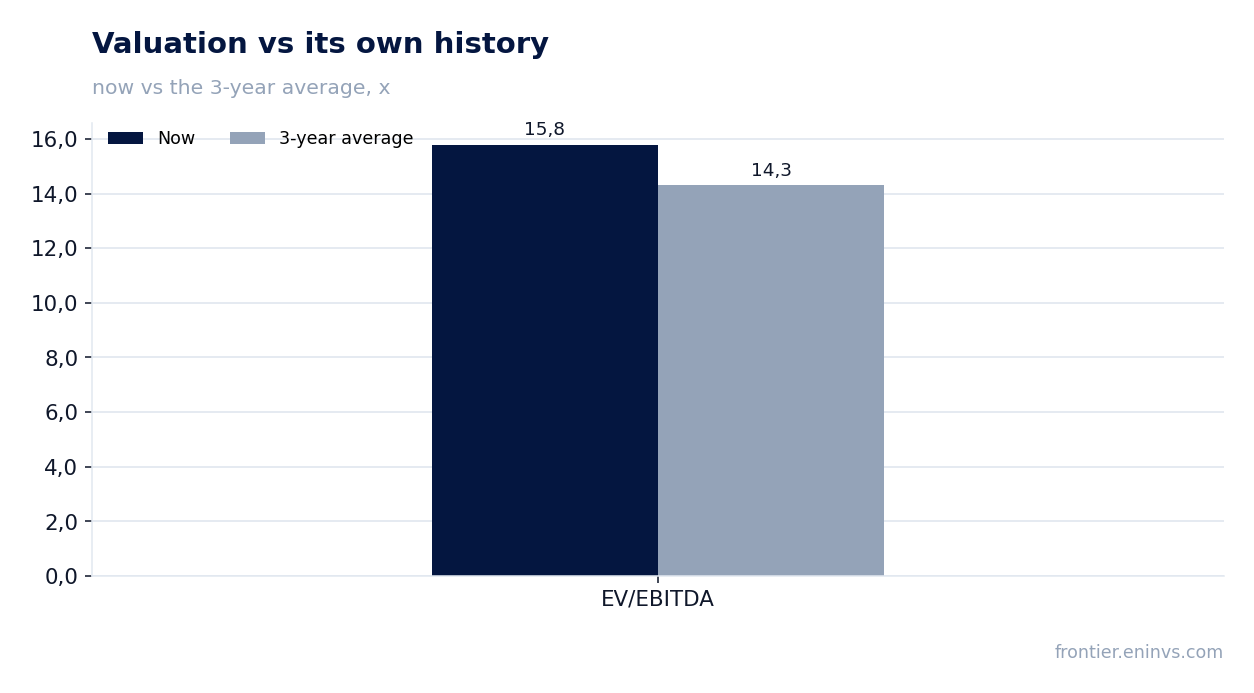
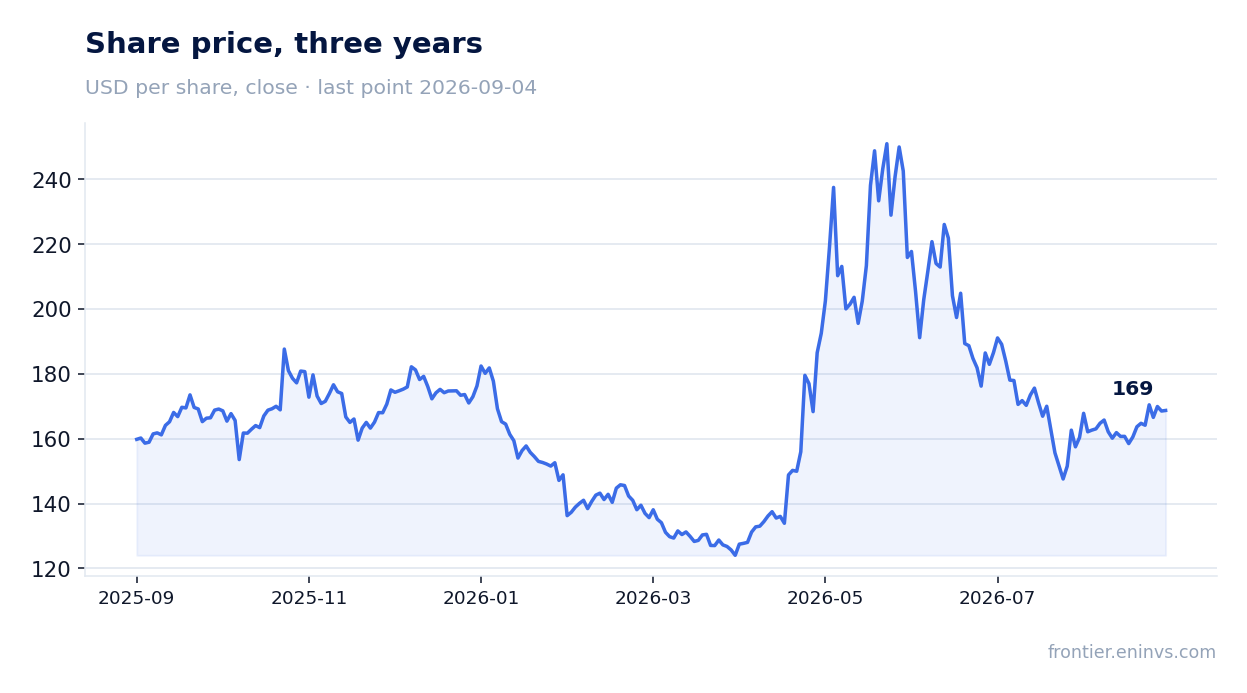
29 июля QUALCOMM INC/DE раскрыла результаты за третий квартал 2026 финансового года: выручка снизилась на 4,0% год к году до 9 947 млн долл., EBITDA упала на 36,0% до 2 022 млн долл., чистая прибыль сократилась на 24,9% до 2 002 млн долл.. На фоне слабого отчёта акции в день публикации потеряли 4,4%, но к 4 сентября отыграли 3,6%. По нашей оценке, бумага выглядит непривлекательно: мультипликатор EV/EBITDA в 15,8 раза выше собственного трёхлетнего среднего (14,3 раза), а модель портала указывает на потенциал снижения на 47%.
Key takeaways
— Revenue has been falling for four consecutive quarters, and this is not seasonality but a structural decline in the handset segment
— EBITDA plunged 36% due to rising cost of sales and operating expenses, not just revenue
— Net profit includes one-off tax benefits, without which the decline would have been deeper
— The automotive segment grows 61% and only partially offsets handset losses
— Operating cash flow fell to $991 million — the lowest in eight quarters
— Leverage remains moderate: net debt is 0.84 times EBITDA over the last twelve months
— Dividends and buybacks continue, but funded by debt rather than free cash flow
Attractiveness
Key figures, USD bn
| Metric | Q3 2025 | Q3 2026 | Change |
|---|---|---|---|
| Revenue | 10.4 | 9.95 | -4.0% |
| EBITDA | 3.16 | 2.02 | -36.0% |
| Operating profit | 2.76 | 1.63 | -41.1% |
| Net profit | 2.67 | 2.00 | -24.9% |
| Operating cash flow | 2.88 | 0.99 | -65.5% |
| Capex | 0.29 | 0.50 | +68.7% |
| EBITDA margin | 30.5% | 20.3% | -10.2 pp |
| Net margin | 25.7% | 20.1% | -5.6 pp |
Revenue has been falling for four consecutive quarters, and this is not seasonality but a structural decline in the handset segment
In the third quarter of fiscal 2026, QUALCOMM INC/DE revenue was $9,947 million, down 4.0% year-over-year. This is the fourth consecutive quarterly decline: after growth of 16.9% in Q2 2025, growth slowed to +10.3% in Q3, +10.0% in Q4, +5.0% in Q1 2026, then turned to declines of 3.5% in Q2 and 4.0% in Q3 2026.
The main reason is the handset segment, which brought in $5,086 million, down 20% year-over-year. This decline is not offset by growth elsewhere: QCT revenue fell 5% to $8,504 million, and the licensing business QTL lost 3% to $1,278 million. The company cites a challenging memory and supply environment, but the structural decline in the key segment is evident.
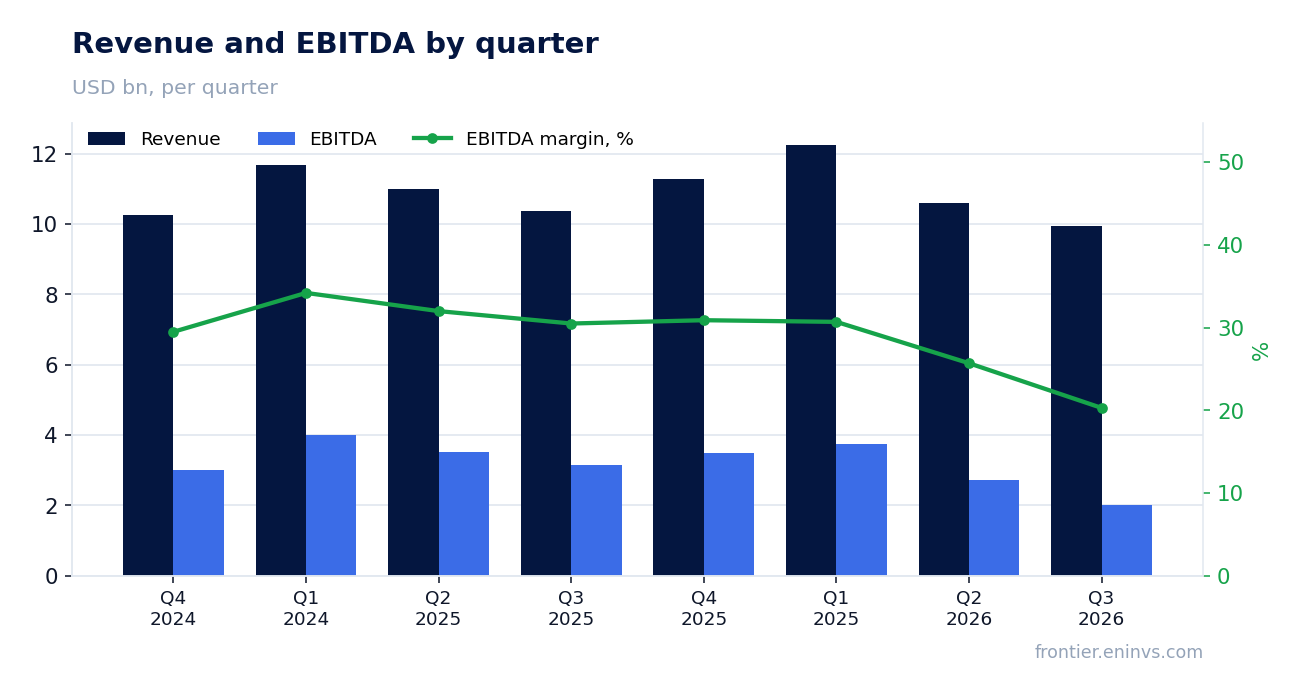
EBITDA plunged 36% due to rising cost of sales and operating expenses, not just revenue
EBITDA in the reported quarter was $2,022 million, down 36.0% year-over-year. EBITDA margin fell from 30.5% to 20.3%. The 4% revenue decline explains only part of this drop: the main pressure came from cost of sales and operating expenses.
Cost of sales rose from $4,606 million to $4,670 million, while R&D expenses jumped from $2,226 million to $2,607 million — up 17%. The company notes that the industry is experiencing broad-based increases in input costs across wafers, assembly, test, memory and materials, and that it is taking actions to raise prices, but the effect will be gradual. Operating income fell from $2,762 million to $1,626 million, a 41% decline.
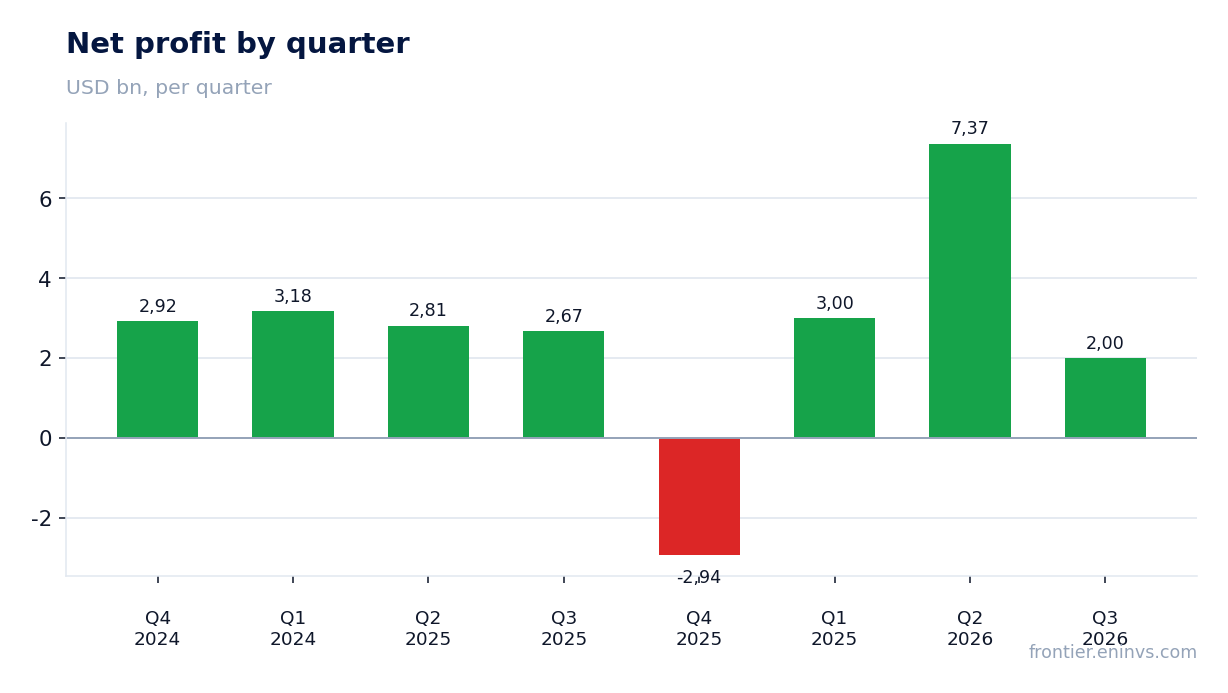
Net profit includes one-off tax benefits, without which the decline would have been deeper
Net profit for the quarter was $2,002 million, down 24.9% year-over-year. However, this figure includes significant one-off items: investment and other income rose from $358 million to $1,014 million, driven by revaluation of marketable securities and other investments. Without these items, the decline would have been much deeper.
Moreover, the nine-month report shows a large tax effect: income tax benefit of $4,136 million versus an expense of $1,034 million a year earlier. This is related to changes in the valuation of deferred tax assets and liabilities. Net profit for nine months rose to $12,377 million from $8,658 million, but this growth is largely due to one-off factors rather than operational dynamics.
The automotive segment grows 61% and only partially offsets handset losses
QCT automotive revenue was $1,588 million, up 61% year-over-year. This is the 23rd consecutive quarter of double-digit growth. IoT segment also grew 9% to $1,830 million. Combined QCT Automotive and IoT revenues grew 28% year-over-year.
However, these fast-growing segments cannot yet offset the handset decline: the absolute drop in Handsets revenue was $1,242 million, while the combined increase in Automotive and IoT was only $753 million. The company expects non-handset revenue growth to accelerate to over 60% in fiscal 2027, but that is only a forecast for now.
Operating cash flow fell to $991 million — the lowest in eight quarters
Operating cash flow in Q3 2026 was only $991 million — the lowest in eight quarters. For comparison, a year earlier it was $2,875 million, and in the previous quarter $2,449 million. The decline is due to higher inventories (up $1,798 million over nine months) and increased accounts receivable.
Capital expenditures rose to $496 million from $294 million a year ago, reflecting investments in capacity expansion. Free cash flow thus fell to $495 million — significantly less than the $973 million in dividends paid during the quarter. The company covers the gap with debt and securities sales.
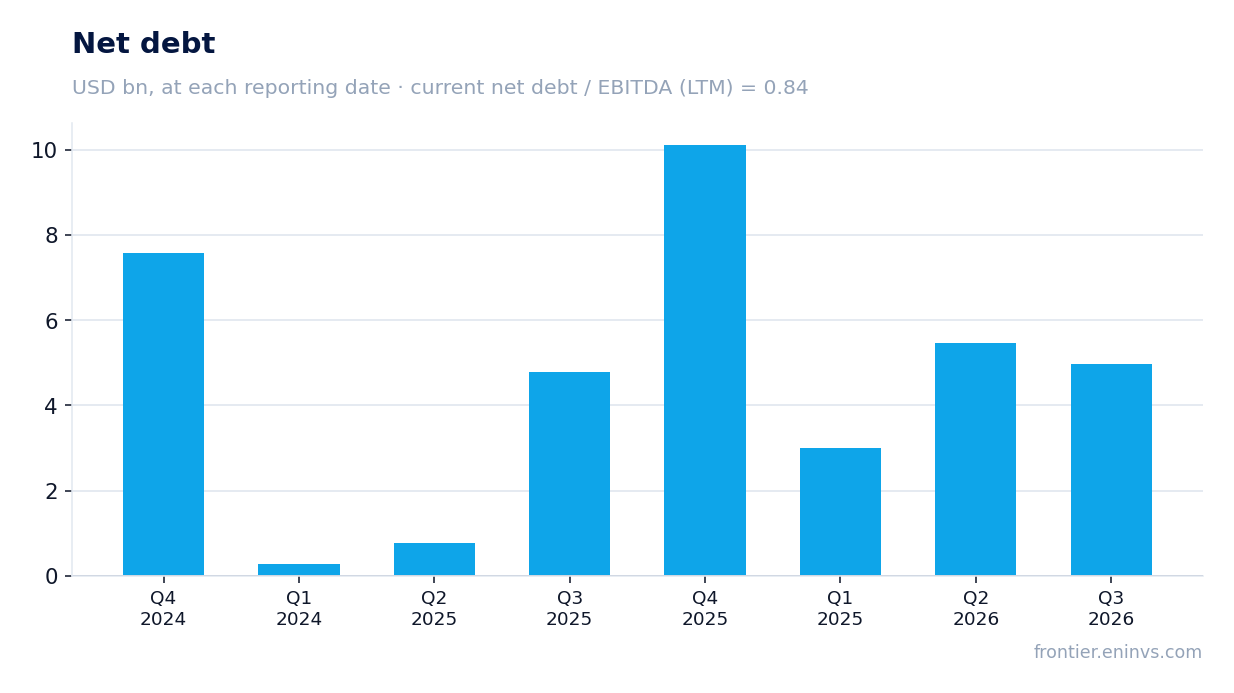
Leverage remains moderate: net debt is 0.84 times EBITDA over the last twelve months
At the end of the quarter, QUALCOMM INC/DE net debt was $10,123 million, corresponding to 0.84 times EBITDA over the last twelve months. This is a moderate level, although net debt increased by $0.2 billion over the year (in ruble terms). The company increased short-term debt to $2,489 million, partially financing share buybacks.
During the quarter, the company returned $2.3 billion to shareholders, including $973 million in dividends and $1.4 billion to repurchase 8 million shares. This exceeds free cash flow, so leverage is likely to continue rising if operating cash flow does not recover.
Dividends and buybacks continue, but funded by debt rather than free cash flow
Dividend yield over the last twelve months is 2.07%, below the average for technology companies with excess cash flow. The company continues to pay dividends and buy back shares, but in Q3 these payments exceeded free cash flow almost fivefold.
Over nine months, the company spent $2,868 million on dividends and $6,806 million on buybacks, while operating cash flow was $8,405 million and capital expenditures were $1,578 million. Thus, free cash flow covered only 76% of shareholder payments. The rest was funded by debt and sales of marketable securities.
Valuation on the latest reported figures
| Metric | Value |
|---|---|
| Market cap | 181 bn USD |
| P/E (LTM) | 19.6 |
| EV/EBITDA (LTM) | 15.8 |
| P/B | 8.55 |
| Net debt / EBITDA (LTM) | 0.84 |
| Operating cash flow (LTM) | 14.0 bn |
| ROE | 9.7% |
| Dividend yield (12m) | 2.1% |
| EV/EBITDA, 3-year average | 14.3 |
Bottom line
QUALCOMM INC/DE's Q3 2026 report showed continued negative dynamics: revenue has been declining for four consecutive quarters, EBITDA fell 36%, and operating cash flow hit a two-year low. The 61% growth in the automotive segment is a bright spot, but it does not offset the handset decline. Net profit includes one-off tax benefits, so earnings quality is lower than it appears. Meanwhile, the stock trades at an EV/EBITDA multiple of 15.8 times — above its own three-year average (14.3 times), and the portal's model indicates 47% downside. Until sustainable revenue growth and cash flow recovery emerge, the share remains unattractive.
Open the company's financial profile QCOM →
See also: market overview · valuation map · stock screeners