RAMBUS INC: record revenue and margin, yet shares fall 11% after earnings

27 июля RAMBUS INC раскрыла результаты за второй квартал 2026 года: выручка выросла на 20,4% до 207,4 млн долл., EBITDA — на 38,1% до 84,1 млн долл., чистая прибыль — на 16,7% до 67,6 млн долл.. Несмотря на сильные цифры, акции после отчёта подешевели на 11%, и при текущей оценке мы видим бумагу скорее привлекательной: рост ускорился, маржа расширилась, а мультипликатор EV/EBITDA ниже собственного трёхлетнего среднего.
Key takeaways
— Выручка ускорилась до +20,4% благодаря рекордным продажам продуктов
— Маржа EBITDA выросла на 5,7 п.п. до 44,0% на фоне операционного рычага
— Чистая прибыль выросла на 16,7%, но медленнее выручки из-за роста расходов
— Операционный денежный поток во втором квартале упал до 61,2 млн долл. с 94,4 млн год назад
— Компания дала оптимистичный прогноз на третий квартал: выручка 210–216 млн долл.
— Акции после отчёта снизились на 11%, несмотря на сильные результаты
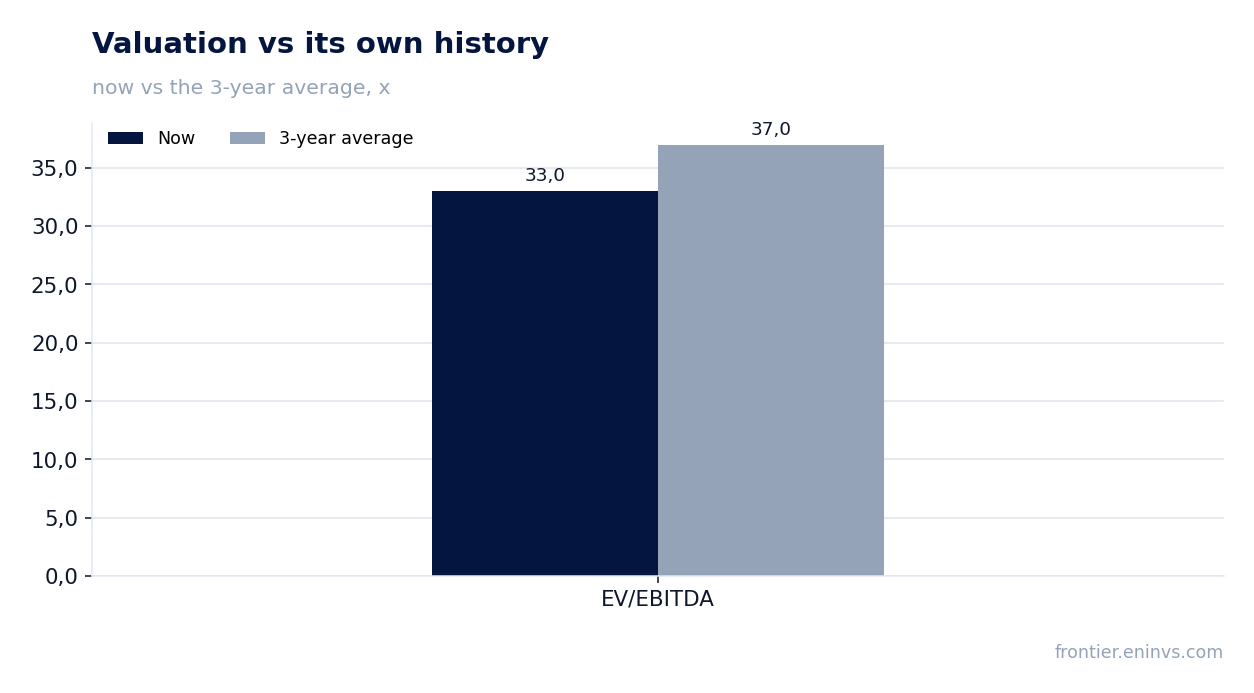
— Оценка: EV/EBITDA 33,0 против среднего 37,0 за три года
Attractiveness
Key figures, USD bn
| Metric | Q2 2025 | Q2 2026 | Change |
|---|---|---|---|
| Revenue | 0.17 | 0.21 | +20.4% |
| EBITDA | 0.07 | 0.09 | +38.1% |
| Operating profit | 0.06 | 0.07 | +15.4% |
| Net profit | 0.06 | 0.07 | +16.7% |
| Operating cash flow | 0.09 | 0.06 | -35.1% |
| Capex | 0.01 | 0.01 | +39.4% |
| EBITDA margin | 38.3% | 44.0% | +5.7 pp |
| Net margin | 33.6% | 32.6% | -1.0 pp |
Revenue accelerated to +20.4% on record product sales
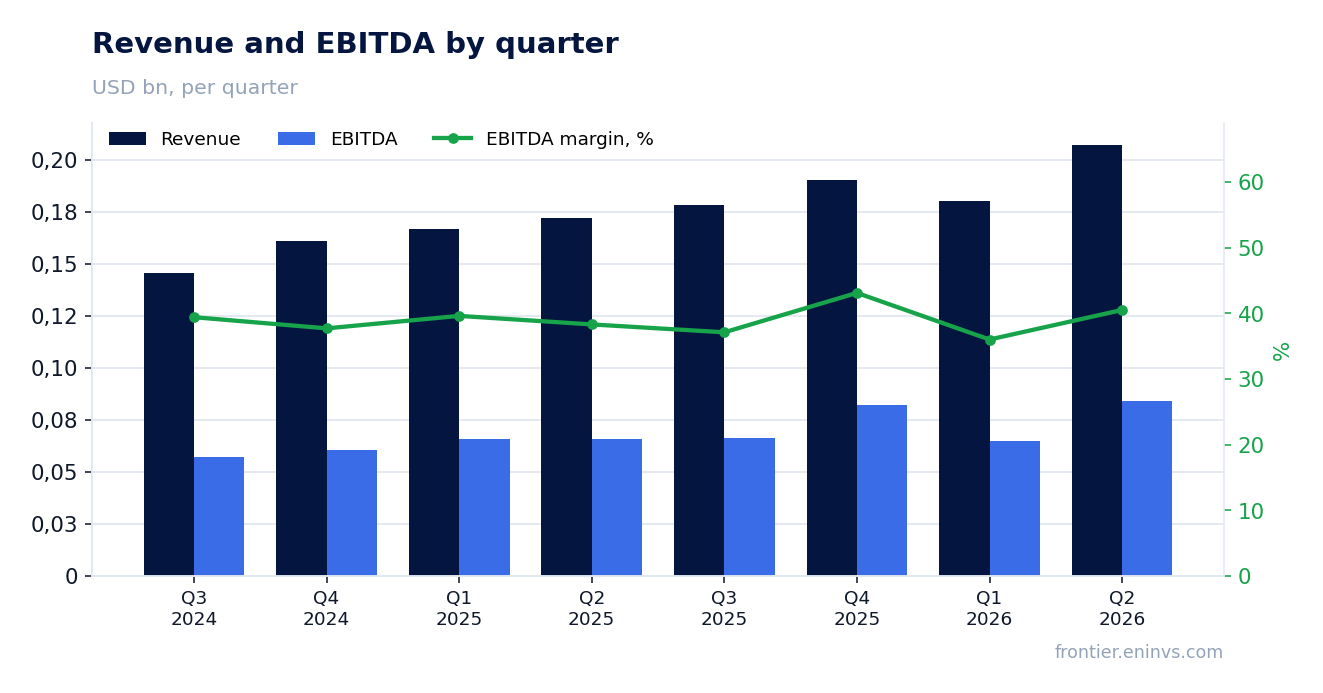
In Q2 2026, RAMBUS INC revenue reached $207.4 million, up 20.4% year over year, exceeding the company's guidance of $192–198 million and setting an all-time high. The main driver was product revenue, which grew 22% year over year to $99.2 million, also a record. Royalties contributed $84.2 million (+22.8%), and contract and other revenue $24.0 million (+7.6%).
The acceleration is also visible in the trend: in the prior quarter, revenue grew only 8.1% year over year, now 20.4%. The company attributes this to strong demand for data-center and AI infrastructure solutions, including chipsets for DDR5 9600 memory modules and PCIe 7 Switch IP.
EBITDA margin expanded 5.7 p.p. to 44.0% on operating leverage
EBITDA in Q2 grew 38.1% year over year to $84.1 million, with EBITDA margin reaching 44.0% versus 38.3% a year earlier. The margin expansion came from operating leverage: revenue grew faster than operating expenses. GAAP operating expenses rose 24.5% to $92.7 million, but included one-off items — $3.3 million in restructuring charges and $1.6 million in amortization of acquired intangibles.
Excluding these items, non-GAAP operating income rose 18.5% to $93.7 million, and non-GAAP operating margin was 45% versus 46% a year ago. The decline in non-GAAP margin reflects increased R&D investment: research and development expenses grew 10.3% to $51.1 million.
Net profit rose 16.7%, but slower than revenue due to higher expenses
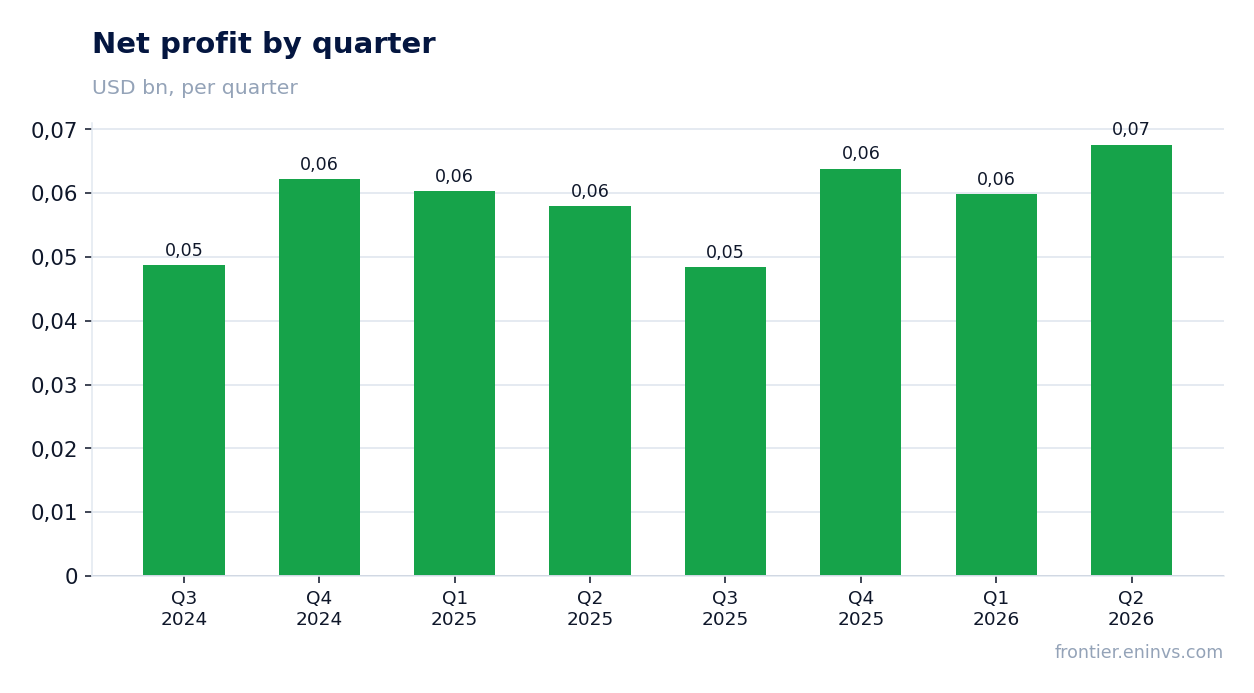
Net profit in Q2 was $67.6 million, up 16.7% year over year. Profit growth lagged revenue because operating expenses rose faster — partly due to one-off items. Excluding them, non-GAAP net profit grew 25.7% to $84.4 million, and non-GAAP EPS rose to $0.77 from $0.62.
Net margin declined slightly to 32.6% from 33.6%, as net profit growth trailed revenue. In absolute terms, profit remains high, and the company generates steady cash flow.
Operating cash flow in Q2 fell to $61.2 million from $94.4 million a year earlier
Operating cash flow in Q2 2026 was $61.2 million versus $94.4 million a year earlier. The 35% decline came despite higher profit — likely due to inventory buildup: inventories on the balance sheet rose from $44.1 million at end-2025 to $74.8 million by June 30, 2026. The company is building inventory ahead of expected sales growth.
Capital expenditures in Q2 were $9.1 million, up from $6.5 million a year ago. Free cash flow thus fell more sharply — to roughly $52 million from $88 million. However, over the trailing twelve months, operating cash flow remains strong at $360.0 million.
Company guides optimistic Q3: revenue $210–216 million
RAMBUS INC expects Q3 2026 revenue in the range of $210–216 million, implying continued growth of roughly 18–21% year over year. The company also guides record product revenue of $110–116 million, up 11–17% from Q2 levels. Royalties, in contrast, are expected lower at $69–75 million versus $84.2 million in Q2.
Non-GAAP EPS is guided at $0.75–0.82, above the actual $0.77 in Q2. The guidance looks confident and confirms sustained demand for AI-infrastructure products.
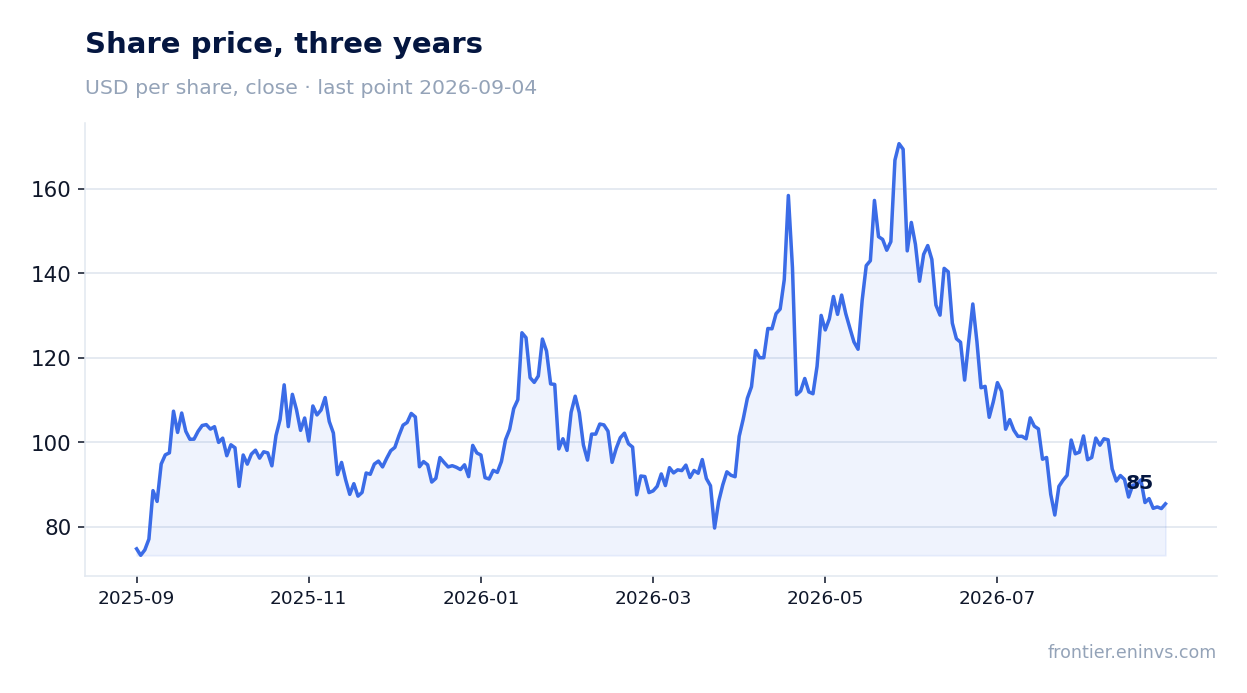
Shares fell 11% after earnings despite strong results
RAMBUS INC shares closed at $96.01 before the release, rose 0.4% on the day, but fell 11% by September 4. Thus, the market reacted negatively over several weeks, despite revenue and profit beats.
A possible reason is profit-taking after a strong run: over the last twelve months, shares trade at a P/E of 40.1, notably above the market average. However, the company continues to grow at double-digit rates, and the pullback may have created a more attractive entry point.
Valuation: EV/EBITDA 33.0 versus 3-year average 37.0
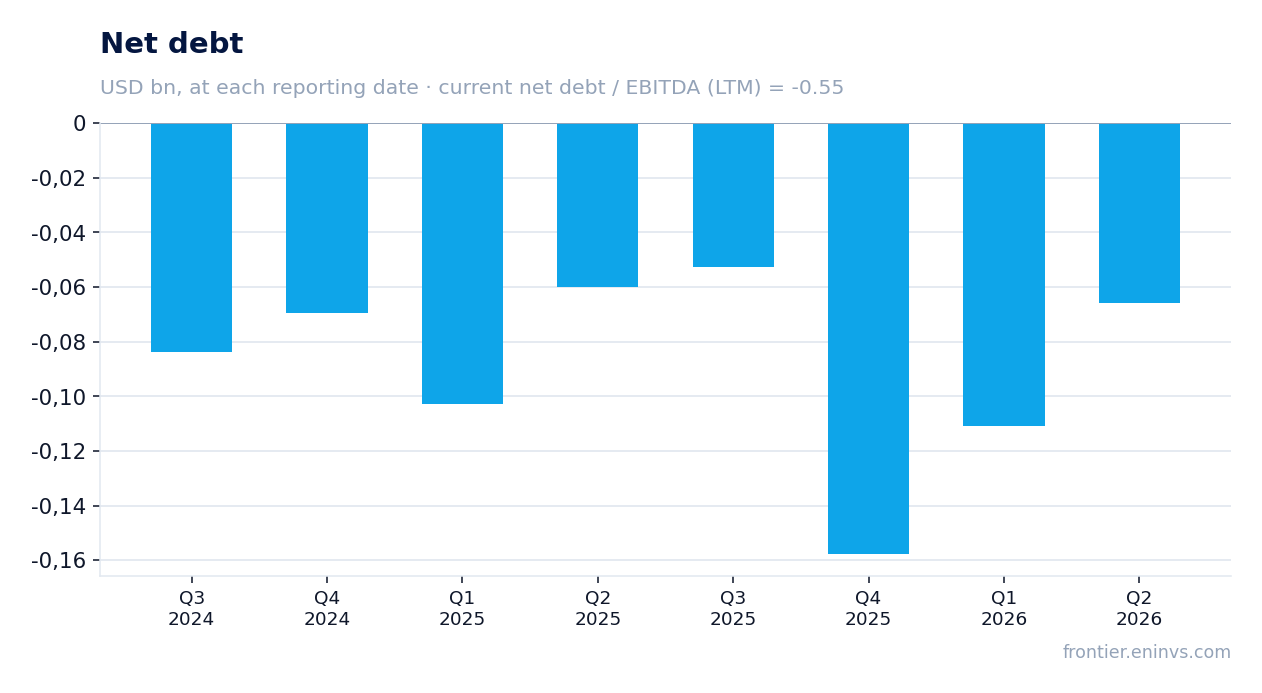
The current EV/EBITDA multiple is 33.0 — below the company's own three-year average of 37.0. P/E over the trailing twelve months is 40.1, reflecting high growth expectations. The company holds a net cash position: net debt is –$157.8 million, and net debt/EBITDA is –0.55.
On the portal's model, the share's upside to fair value is +13%. This is our own calculation based on EBITDA growth and a target multiple. Given accelerating growth and margin expansion, the valuation looks moderate, though not cheap.
Valuation on the latest reported figures
| Metric | Value |
|---|---|
| Market cap | 9.62 bn USD |
| P/E (LTM) | 40.1 |
| EV/EBITDA (LTM) | 33.0 |
| P/B | 7.05 |
| Net debt / EBITDA (LTM) | -0.55 |
| Operating cash flow (LTM) | 0.36 bn |
| ROE | 18.9% |
| EV/EBITDA, 3-year average | 37.0 |
Bottom line
RAMBUS INC's Q2 2026 report is strong: revenue and EBITDA hit records, growth accelerated to 20.4%, and margin expanded to 44.0%. The company beat its own guidance and gave a confident outlook for Q3. However, operating cash flow declined notably due to inventory buildup, and shares fell 11% after the report — the market apparently considered the valuation stretched. Yet the EV/EBITDA multiple (33.0) is below the three-year average (37.0), and the portal's model implies 13% upside. We view the share as rather attractive: strong business and moderate valuation outweigh cash-flow concerns.
Open the company's financial profile RMBS →
See also: market overview · valuation map · stock screeners