Range Resources Corporation: revenue fell 11.3%, but trailing-twelve-month profit holds near last year's level
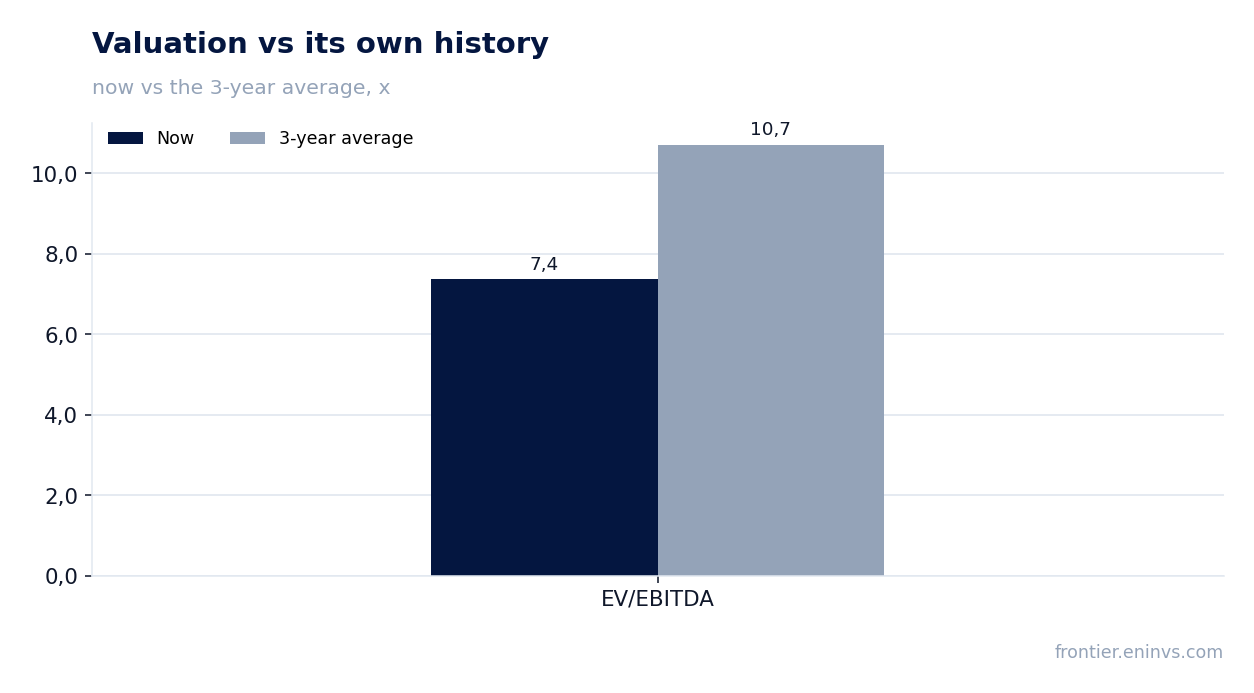
On August 25, Range Resources Corporation reported second-quarter 2026 results. Revenue fell 11.3% year on year to $759.6 million, EBITDA declined 25.2% to $294.5 million, and net income dropped 17.8% to $195.3 million. The EBITDA margin compressed to 38.8% from 46.0% a year earlier. Over the trailing twelve months, however, the company earned $860.3 million in net income with a return on equity of 16.8%, and net debt to EBITDA stands at 0.78. The stock trades at 11.4 times earnings and 7.4 times EBITDA – below its own three-year average EV/EBITDA of 10.7 – but the portal's model points to 40% downside to fair value. Given the weak quarter and limited dividend growth, the share looks rather unattractive at current levels.
Key takeaways
— Revenue in Q2 2026 fell 11.3% year on year to $759.6 million, after a 49.8% increase in the prior quarter
— EBITDA contracted by a quarter, and the margin compressed to 38.8% from 46.0% a year earlier – pressure on costs or realised prices
— Trailing-twelve-month net income was $860.3 million with a return on equity of 16.8%, but the quarterly figure fell 17.8%
— Operating cash flow for the quarter was $235.0 million, capital expenditure $181.5 million, leaving little free cash
— Net debt stands at $676.5 million, and the net debt to EBITDA LTM ratio is 0.78, indicating moderate leverage
— Trailing-twelve-month dividend yield is 0.91%, below the yield available on many alternative instruments
— EV/EBITDA LTM is 7.4, below the three-year average of 10.7, but the portal's model implies 40% downside
Attractiveness
Key figures, USD bn
| Metric | Q2 2025 | Q2 2026 | Change |
|---|---|---|---|
| Revenue | 0.86 | 0.76 | -11.3% |
| EBITDA | 0.39 | 0.29 | -25.2% |
| Operating profit | 0.30 | 0.20 | -33.3% |
| Net profit | 0.24 | 0.20 | -17.8% |
| Operating cash flow | 0.34 | 0.24 | -30.1% |
| Capex | 0.15 | 0.18 | +23.2% |
| EBITDA margin | 46.0% | 38.8% | -7.2 pp |
| Net margin | 27.7% | 25.7% | -2.0 pp |
Revenue in Q2 2026 fell 11.3% year on year to $759.6 million, after a 49.8% increase in the prior quarter
In the second quarter of 2026, Range Resources' revenue was $759.6 million, down 11.3% from the same quarter last year. This is a sharp deceleration after growth of 49.8% in Q1 2026 and 61.5% in Q2 2025. The year-on-year decline could reflect falling realised hydrocarbon prices or lower production volumes, but the provided facts do not specify the causes.
The sequential dynamics are also negative: revenue fell 26.6% from $1,034.2 million in Q1 2026 to $759.6 million. This points to a possible deterioration in market conditions or one-off factors that supported the previous quarter. Without additional data on prices and volumes, it is difficult to isolate the main driver, but the 11.3% year-on-year revenue decline is a significant negative signal.
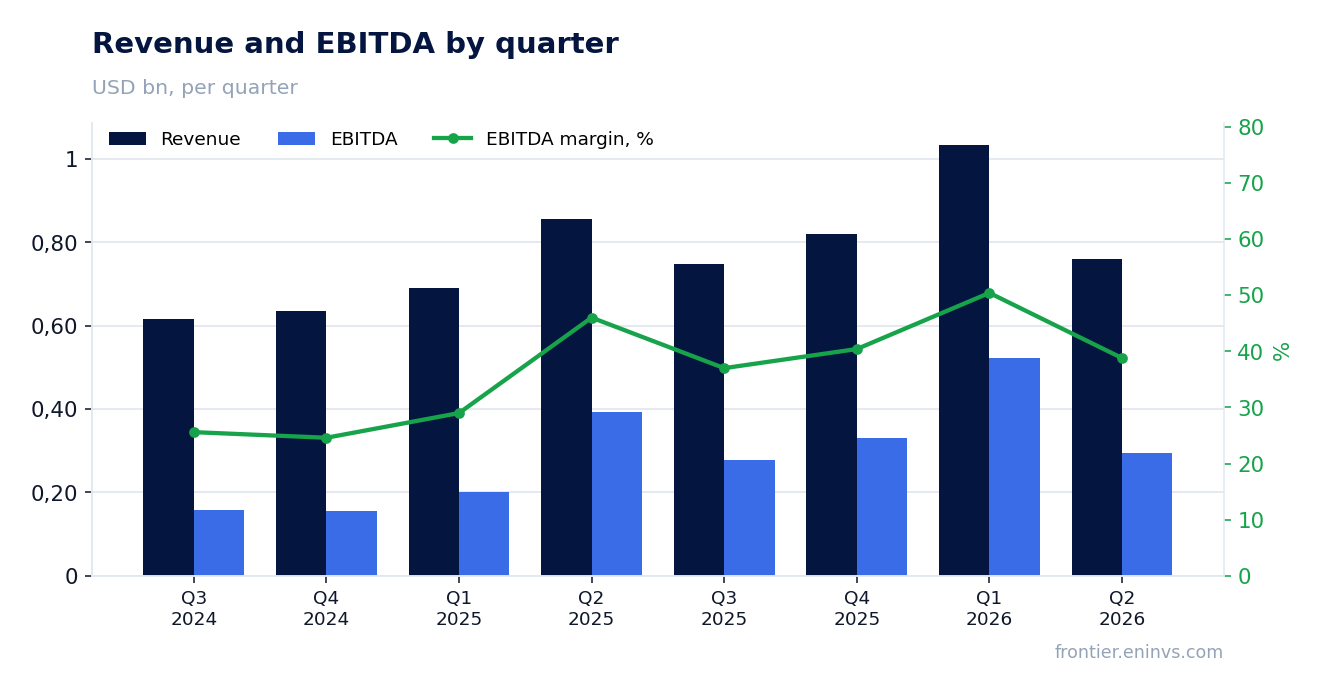
EBITDA contracted by a quarter, and the margin compressed to 38.8% from 46.0% a year earlier – pressure on costs or realised prices
EBITDA in Q2 2026 was $294.5 million, down 25.2% from a year earlier. The EBITDA margin fell to 38.8% from 46.0% in Q2 2025. This margin compression, alongside the revenue decline, suggests the company could not proportionally cut costs or that realised prices fell faster than costs.
Operating profit for the quarter was $201.4 million, down 33.3% from $302.0 million a year earlier. This decline is deeper than the revenue drop, confirming either faster cost growth or negative operating leverage. Overall, the EBITDA and margin dynamics point to a deterioration in operating efficiency during the reporting period.
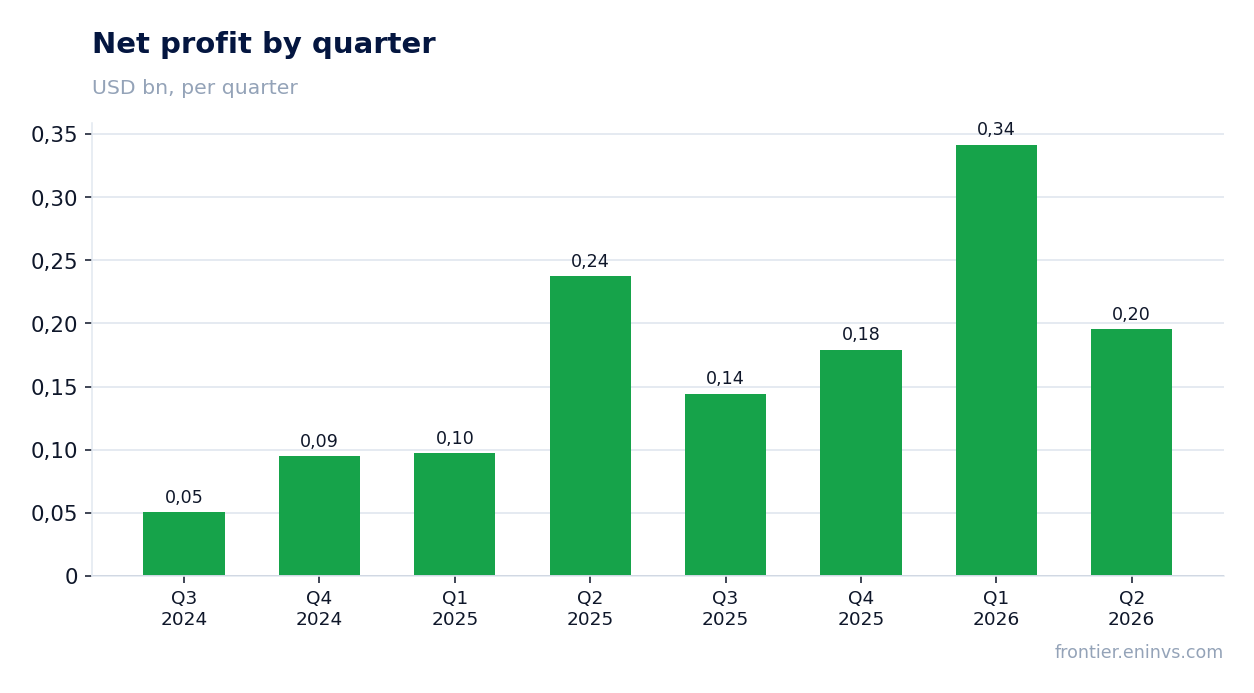
Trailing-twelve-month net income was $860.3 million with a return on equity of 16.8%, but the quarterly figure fell 17.8%
Trailing-twelve-month (LTM) net income was $860.3 million. This is an aggregate for four quarters and should not be interpreted as the result of the reporting period. The LTM return on equity (ROE) is 16.8%, indicating fairly efficient use of capital.
However, in the standalone second quarter of 2026, net income was $195.3 million, down 17.8% from $237.6 million in Q2 2025. The quarterly profit decline is consistent with the drop in revenue and EBITDA. The net margin in Q2 2026 was 25.7% versus 27.7% a year earlier, a decrease of 2 percentage points.
Operating cash flow for the quarter was $235.0 million, capital expenditure $181.5 million, leaving little free cash
In Q2 2026, operating cash flow was $235.0 million, down 30.1% from $336.2 million in Q2 2025. Capital expenditure for the quarter was $181.5 million, up 23.2% from $147.3 million a year earlier. As a result, free cash flow (operating cash flow minus capex) was only $53.5 million, significantly below the prior-year level of $188.9 million.
Rising capex against falling operating cash flow puts pressure on liquidity. The company is investing more, possibly to sustain production, but this leaves less for dividends or debt reduction. Over the trailing twelve months, operating cash flow was $1,200.0 million, which covers capital expenditure, but free cash flow remains constrained.
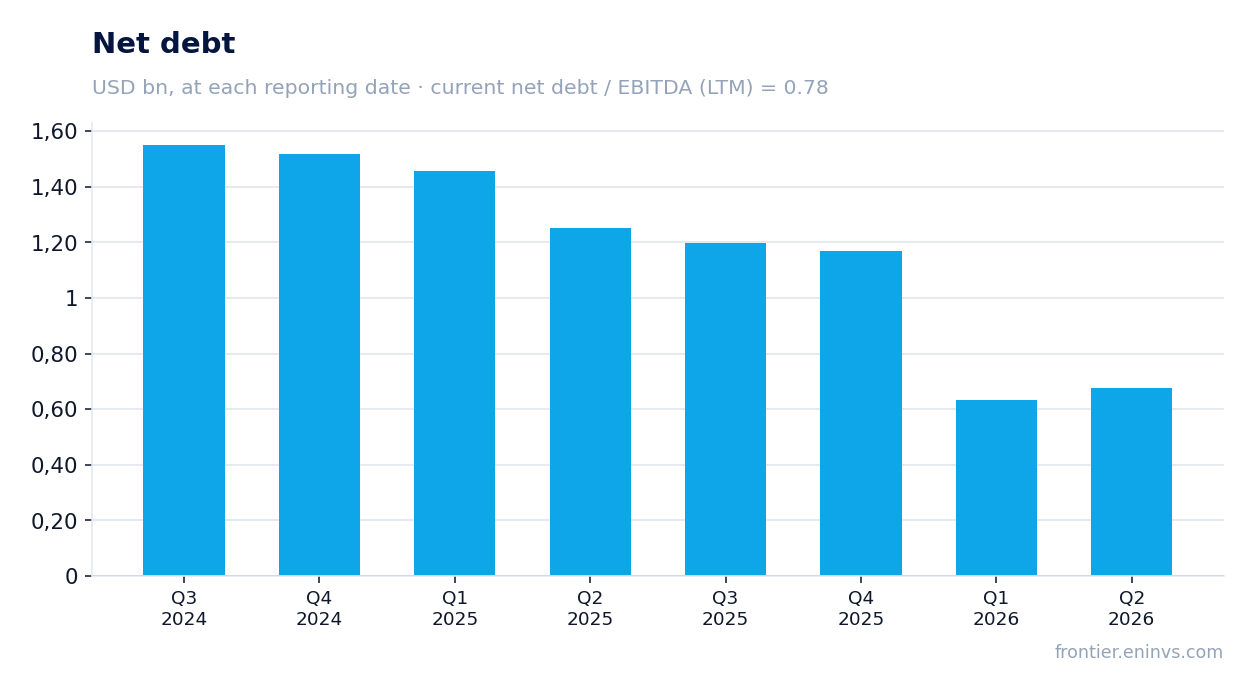
Net debt stands at $676.5 million, and the net debt to EBITDA LTM ratio is 0.78, indicating moderate leverage
As of the end of Q2 2026, Range Resources' net debt was $676.5 million. This is $0.6 billion lower than twelve months ago and marginally below the previous reporting date. The net debt to EBITDA ratio for the trailing twelve months is 0.78, a comfortable level that raises no concerns.
The reduction in absolute debt is a positive fact, but the direction of the leverage ratio is not disclosed because the prior value is absent from the facts. Moderate leverage gives the company flexibility, but with falling EBITDA this ratio could rise in the future if operating results do not recover.
Trailing-twelve-month dividend yield is 0.91%, below the yield available on many alternative instruments
Range Resources' trailing-twelve-month dividend yield is 0.91%. This is a low level, significantly below the yield on government bonds and deposits. The company is not a classic dividend story, and its payout is likely constrained by the need to fund capital expenditure.
Based on the payout ratio implied by LTM earnings, dividend payments represent a small share of net income. In the current environment, with quarterly free cash flow at only $53.5 million, the likelihood of a significant dividend increase is low. A 0.91% yield does not compensate for the risks associated with energy price volatility.
EV/EBITDA LTM is 7.4, below the three-year average of 10.7, but the portal's model implies 40% downside
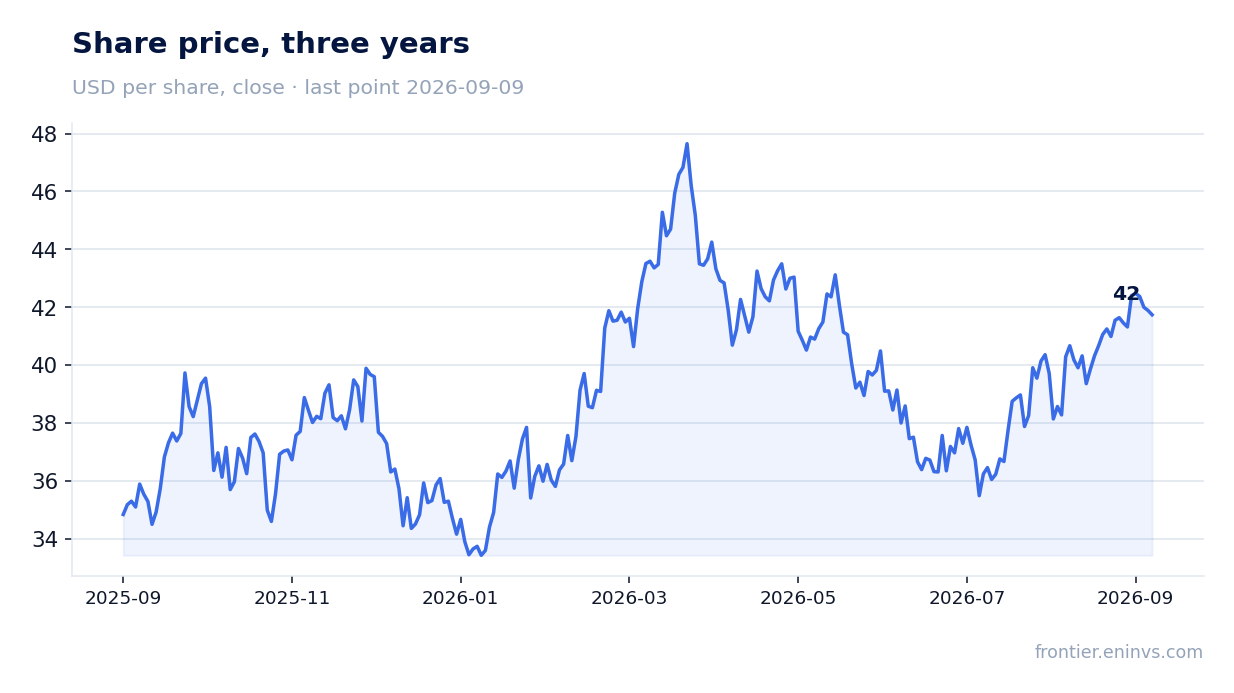
The trailing-twelve-month EV/EBITDA multiple is 7.4, below the company's three-year average of 10.7. This means the stock is cheaper compared to its own history. However, the LTM P/E is 11.4, and at the current price the market capitalisation is $9,828.0 million.
The portal's model, which re-prices EBITDA at current commodity prices against a target EV/EBITDA, points to 40% downside to fair value. This is the portal's own calculation, not a market consensus. Thus, despite a relatively low multiple versus its own history, the fundamental valuation suggests the stock is overvalued.
Valuation on the latest reported figures
| Metric | Value |
|---|---|
| Market cap | 9.83 bn USD |
| P/E (LTM) | 11.4 |
| EV/EBITDA (LTM) | 7.4 |
| P/B | 2.28 |
| Net debt / EBITDA (LTM) | 0.78 |
| Operating cash flow (LTM) | 1.20 bn |
| ROE | 16.8% |
| Dividend yield (12m) | 0.9% |
| EV/EBITDA, 3-year average | 10.7 |
Bottom line
Bottom line: in Q2 2026, Range Resources reported weak results – revenue fell 11.3%, EBITDA dropped 25.2%, and net income declined 17.8%. The EBITDA margin compressed to 38.8%. Over the trailing twelve months, the company remains profitable ($860.3 million net income, ROE 16.8%) with moderate leverage (0.78 times EBITDA), but quarterly free cash flow was only $53.5 million. The EV/EBITDA multiple is below its own three-year average, yet the portal's model implies 40% downside. A dividend yield of 0.91% is not attractive. The key question for a holder now is whether the company can restore revenue and margin amid volatile energy prices.
Open the company's financial profile RRC →
See also: market overview · valuation map · stock screeners