Schwab: record revenue and earnings, but organic asset growth slowed
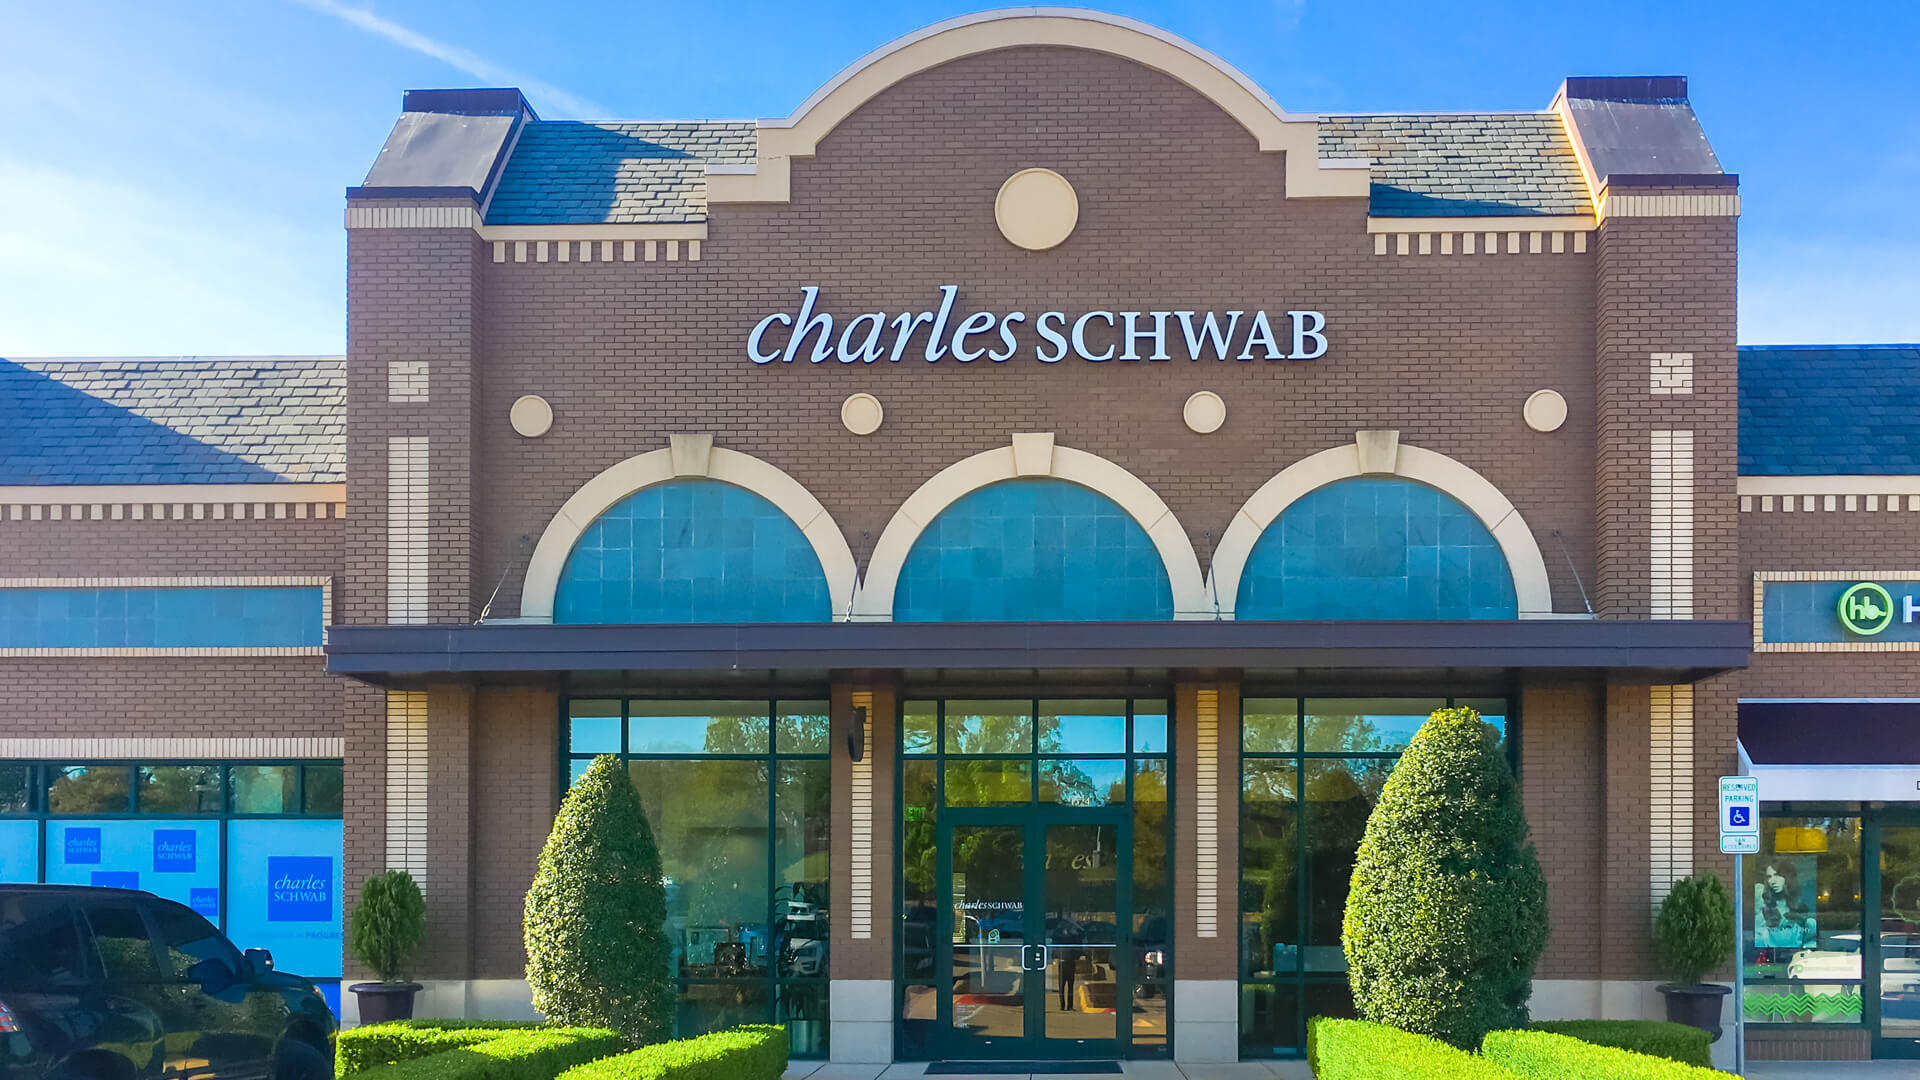
On July 21, Charles Schwab reported second-quarter 2026 results: revenue rose 20.9% year over year to a record $7,072 million, and net profit increased 31.7% to $2,800 million. The shares look attractive: the business is generating strong organic growth, margins are expanding, and capital remains excess.
Key takeaways
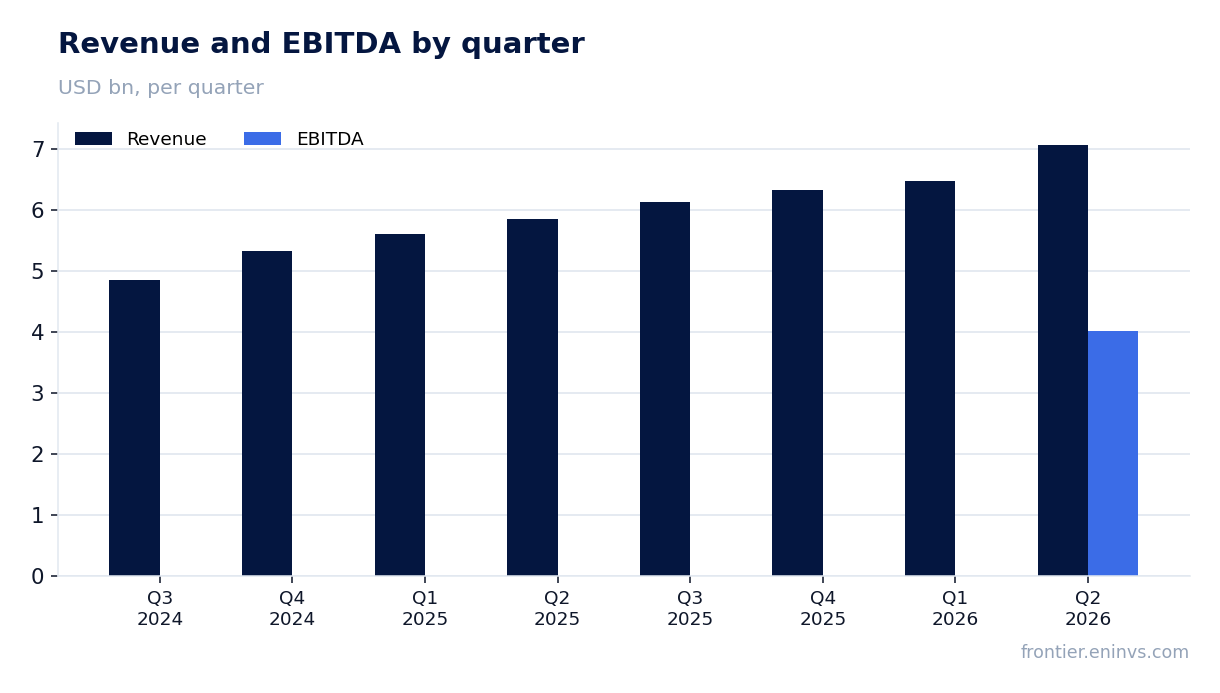
— Revenue rose 21% to a record $7.1 billion, driven by higher interest income and fees
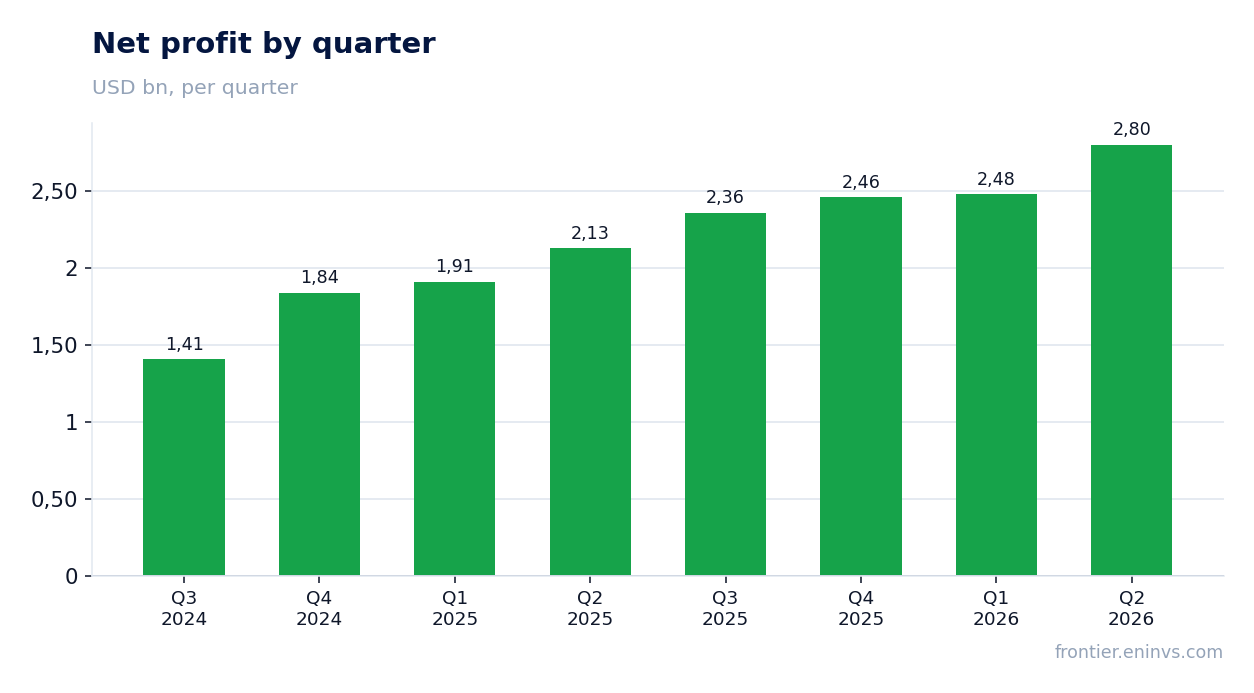
— Net profit jumped 32% to $2.8 billion, with margin expanding to 39.6%
— New asset inflows slowed: $119.8 billion versus $158.2 billion in the prior quarter
— Operating cash flow over the last twelve months was $9.3 billion, but quarterly swings are significant
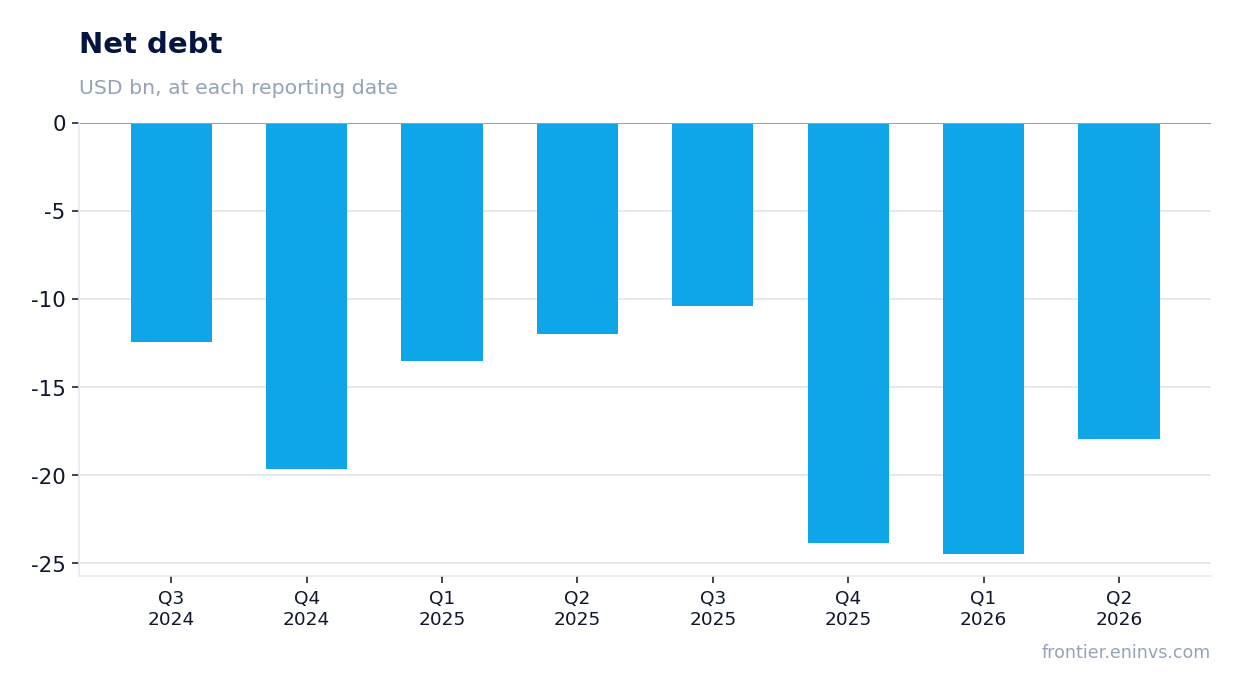
— Net debt is negative: the company remains a net creditor, supporting capital and dividends
Attractiveness
Key figures, USD bn
| Metric | Q2 2025 | Q2 2026 | Change |
|---|---|---|---|
| Revenue | 5.85 | 7.07 | +20.9% |
| EBITDA | — | 4.01 | — |
| Operating profit | — | 3.67 | — |
| Net profit | 2.13 | 2.80 | +31.7% |
| Operating cash flow | 3.18 | 4.30 | +35.3% |
| Capex | 0.13 | 0.18 | +44.5% |
| EBITDA margin | — | 56.7% | — |
| Net margin | 36.3% | 39.6% | +3.3 pp |
Revenue rose 21% to a record $7.1 billion, driven by higher interest income and fees
In the second quarter of 2026, Charles Schwab's revenue reached $7,072 million, up 20.9% year over year. The main driver was net interest income, which rose 19% to $3,357 million, helped by a 5% increase in average interest-earning assets to $445 billion and an expansion of net interest margin to 3.00% from 2.66% a year earlier.
Fee income also contributed: asset management and administration fees rose 16% to $1,825 million, and trading revenue increased 28% to $1,215 million, reflecting record client activity: daily average trades reached 11.9 million, up 57% from the prior year.
Net profit jumped 32% to $2.8 billion, with margin expanding to 39.6%
Net profit for the second quarter of 2026 was $2,800 million, up 31.7% year over year. Net margin expanded to 39.6% from 36.3% a year earlier. Operating profit rose 31% to $3,669 million, and pre-tax margin reached 51.9% versus 47.9% a year ago.
Expenses grew slower than revenue: total expenses excluding interest increased 12% to $3,403 million, with the largest item – compensation and benefits – up 17% to $1,790 million. Expenses included one-off acquisition and integration costs and amortization of acquired intangibles of $170 million; excluding these, adjusted EPS was $1.62 versus $1.54 on a GAAP basis.
New asset inflows slowed: $119.8 billion versus $158.2 billion in the prior quarter
In the second quarter of 2026, net new assets totaled $118.7 billion, up 61% year over year but down 15% from the first quarter of 2026 ($139.9 billion). The prior quarter saw a record inflow of $158.2 billion. The slowdown partly reflects seasonality and market volatility: in June, net new assets were $62.1 billion, and core net new assets were $62.7 billion.
Nevertheless, total client assets rose 22% year over year to $13.08 trillion, helped by market gains of $1,198 billion during the quarter. New brokerage accounts opened totaled 1.4 million, bringing total accounts to 48.0 million. Growth has slowed but remains strong, supporting future fee income.
Operating cash flow over the last twelve months was $9.3 billion, but quarterly swings are significant
Over the last twelve months (LTM), Charles Schwab's operating cash flow totaled $9,300 million. However, quarterly figures are highly volatile: in Q2 2026 OCF was positive at $4,300 million, while in Q4 2025 it was negative at -$763 million. These swings reflect movements in client balances and margin loans, typical for a brokerage business.
Capital expenditures for the quarter were $185 million, insignificant relative to the scale of the business. Free cash flow thus remains positive, but its magnitude depends heavily on the quarter's phase. The company continues to return capital to shareholders: it repurchased 11.2 million shares for $1.0 billion during the quarter, and dividends rose to $0.32 per share.
Net debt is negative: the company remains a net creditor, supporting capital and dividends
At the end of Q2 2026, Charles Schwab's net debt was -$17,931 million, meaning cash and liquid assets exceed debt. A year earlier the figure was also negative at -$11,987 million, and in Q4 2025 it reached -$23,831 million. The company retains the ability to fund growth and return capital without increasing leverage.
Return on equity (ROE) over the last twelve months was 22.5%, above the average for the financial sector. A strong capital position allows the company to continue paying dividends and buying back shares, which we factor into our attractiveness assessment.
Valuation on the latest reported figures
| Metric | Value |
|---|---|
| Operating cash flow (LTM) | 9.30 bn |
| ROE | 22.5% |
Bottom line
Charles Schwab reported a strong quarter: revenue and profit are record, margins are expanding, and capital remains excess. Growth was driven by both interest income and fees, indicating business diversification. However, new asset inflows slowed from the prior quarter, and that is the key question for future growth. At the current valuation, the shares look attractive: strong fundamentals and negative net debt support shareholder returns.
Open the company's financial profile SCHW →
See also: market overview · valuation map · stock screeners