Seagate Technology Holdings plc: quarterly revenue fell 11.8%, but net profit rose 2.6x – driven by one-offs and record margins

On July 28, 2026, Seagate Technology Holdings plc reported results for the fourth quarter of fiscal 2026 (ended July 3, 2026). Revenue fell 11.8% year over year to $3,629 million, but net profit rose 165.2% to $1,294 million, driven by one-off tax effects and record gross margin. At the current price, the share looks rather unattractive: multiples are well above their own historical averages, and the portal's model implies 15% downside.
Key takeaways
— Fourth-quarter revenue fell 11.8% after growing 44.1% a quarter earlier – cloud orders shifted
— Net profit rose 2.6x, but nearly half of the increase is a one-off tax effect
— Gross margin reached 52.3% – a record level amid a structural shift toward HAMR
— Debt fell by $1.1 billion in the quarter to $1,861 million – the company is actively repaying liabilities
— Free cash flow for the quarter was $1,118 million – a record level, but capital expenditures are rising
— EV/EBITDA and P/E multiples are more than double their own three-year averages
— The portal's model implies 15% downside from the current price
Attractiveness
Key figures, USD bn
| Metric | Q4 2025 | Q4 2026 | Change |
|---|---|---|---|
| Revenue | 2.44 | 2.15 | -11.8% |
| EBITDA | 0.63 | 1.63 | +159.0% |
| Operating profit | 0.58 | 0.41 | -29.1% |
| Net profit | 0.49 | 1.29 | +165.2% |
| Operating cash flow | 0.51 | 0.41 | -19.3% |
| Capex | 0.08 | 0.19 | +125.3% |
| EBITDA margin | 25.7% | 75.6% | +49.9 pp |
| Net margin | 20.0% | 60.0% | +40.0 pp |
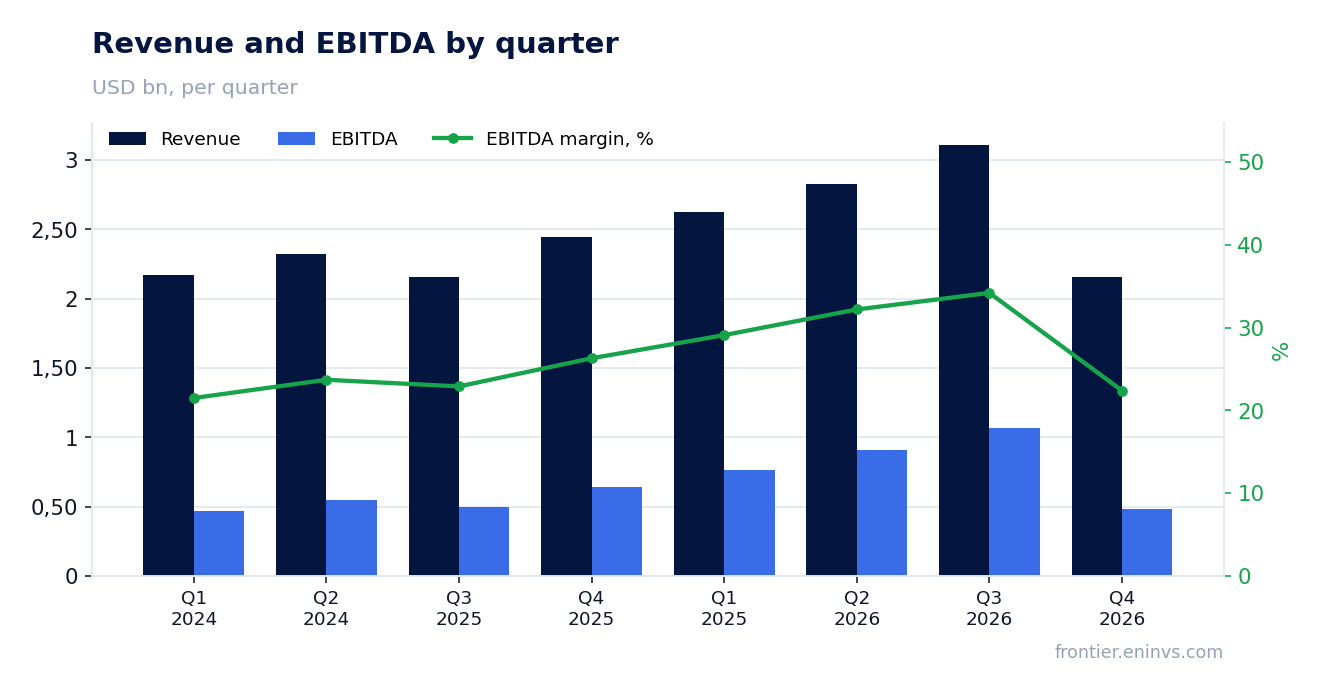
Fourth-quarter revenue fell 11.8% after growing 44.1% a quarter earlier – cloud orders shifted
In the fourth quarter of fiscal 2026 (ended July 3, 2026), Seagate's revenue was $3,629 million, 11.8% below the same quarter a year earlier. This is a sharp reversal after 44.1% growth in the third quarter – the dynamics point to a shift in cloud provider orders, not deteriorating demand: the company's report cites 'robust cloud data center demand' and expects momentum to continue in 2027.
For the full fiscal 2026, revenue grew 34% to $12,195 million, confirming that the quarter's decline is volatility in order timing, not a trend reversal. Still, for an investor it matters that after two quarters of acceleration (21.3% and 44.1%), the company showed negative dynamics – this may signal normalization after the frenzy of demand for HAMR drives.
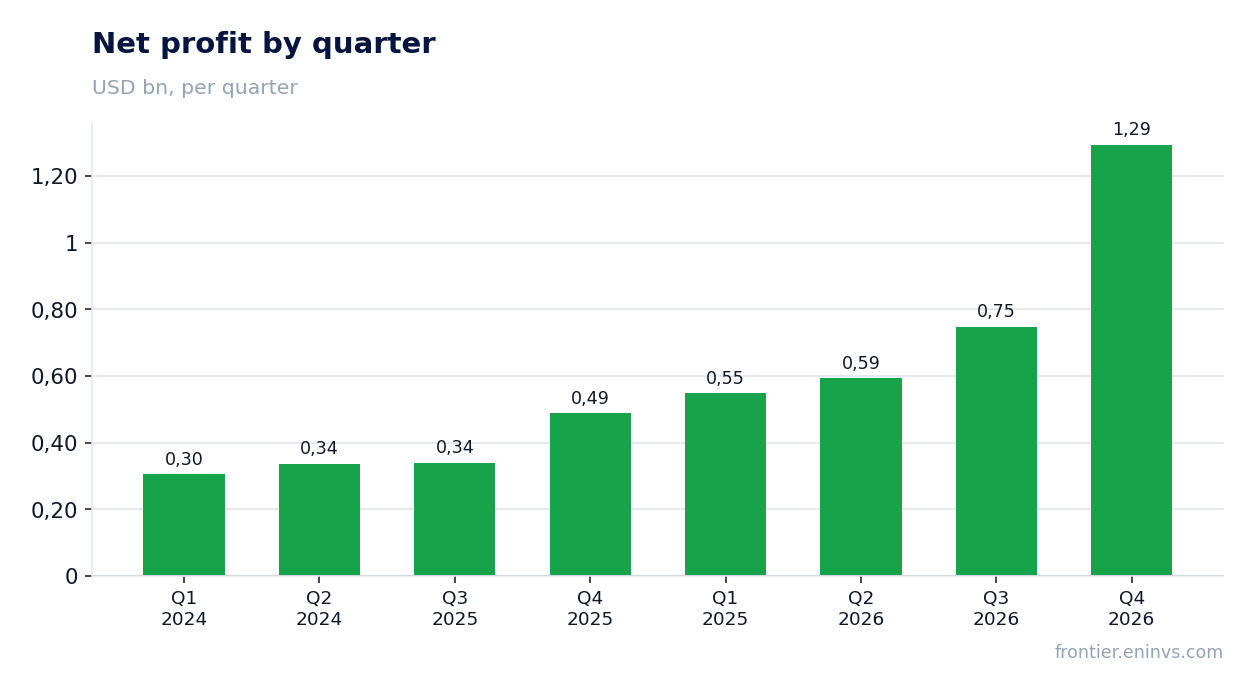
Net profit rose 2.6x, but nearly half of the increase is a one-off tax effect
Net profit for the quarter was $1,294 million versus $488 million a year earlier – growth of 165.2%. However, this jump only partially reflects operational dynamics: the report shows a one-off tax effect – the income tax expense for the quarter was only $211 million on pre-tax income of $1,505 million, implying an effective rate of about 14% versus a typical 20–25%.
Without this effect, net profit would have been noticeably lower. Operating profit rose 174% to $1,559 million, but this also includes one-off items – in particular, $10 million of net loss from debt transactions. Investors should look at adjusted figures: non-GAAP net profit was $1,319 million, which is closer to real profit generation.
Gross margin reached 52.3% – a record level amid a structural shift toward HAMR
Gross margin for the quarter was 52.3% on a GAAP basis (52.7% non-GAAP) versus 37.4% a year earlier. This is a record level, reflecting not only higher prices for mass-capacity drives but also a structural shift in product mix toward the Mozaic platform based on HAMR technology – the company directly attributes this to its 'differentiated HAMR technology roadmap'.
Operating margin rose to 43.0% from 23.2% a year earlier. R&D and marketing expenses grew only slightly – by 5% and 5%, respectively – so almost all of the revenue and margin growth flowed through to operating profit. The question is how sustainable this level is: if revenue continues to decline as in the fourth quarter, the high share of fixed costs will quickly compress margins.
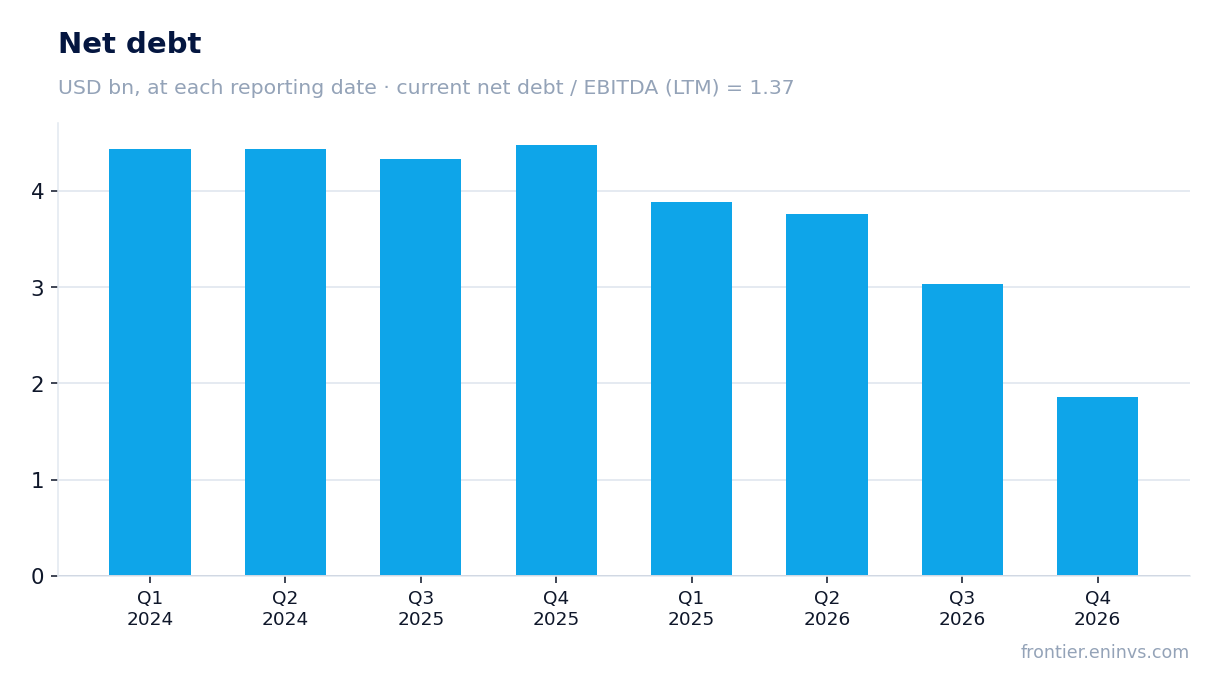
Debt fell by $1.1 billion in the quarter to $1,861 million – the company is actively repaying liabilities
Net debt at the end of the quarter was $1,861 million, down $1.1 billion from the previous reporting date ($3,032 million at the end of the third quarter). Over the last 12 months, debt fell by $2.6 billion – the company used strong cash flow to repay liabilities, including $302 million of debt repurchases in the fourth quarter.
The net debt to EBITDA ratio over the last twelve months is 1.37 – a moderate level, although it does not reflect the recent debt reduction in the fourth quarter (LTM EBITDA includes the weak quarter). The company exited the fiscal year with total debt of $3.6 billion and cash of $1.7 billion, providing a cushion for continued repayment.
Free cash flow for the quarter was $1,118 million – a record level, but capital expenditures are rising
Operating cash flow for the fourth quarter was $1,305 million, and free cash flow was $1,118 million (after capital expenditures of $187 million). This is a record quarterly level, driven by high margins and collections of receivables.
However, capital expenditures are rising: $187 million for the quarter is more than double the average of the previous three quarters ($116–161 million). The company is increasing investments to expand HAMR drive production, which may limit free cash flow in the coming quarters even if revenue recovers. For the full fiscal year, free cash flow was $3,105 million – a record, but part of that flow has already been directed to debt repayment and dividends.
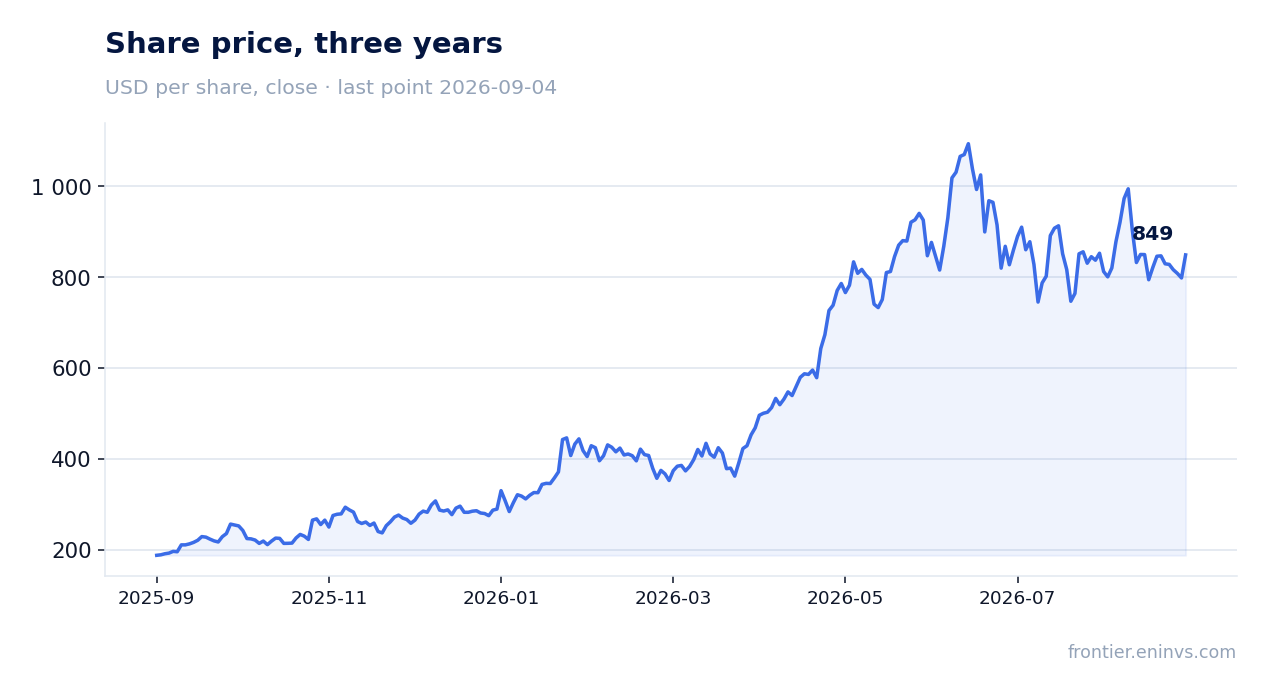
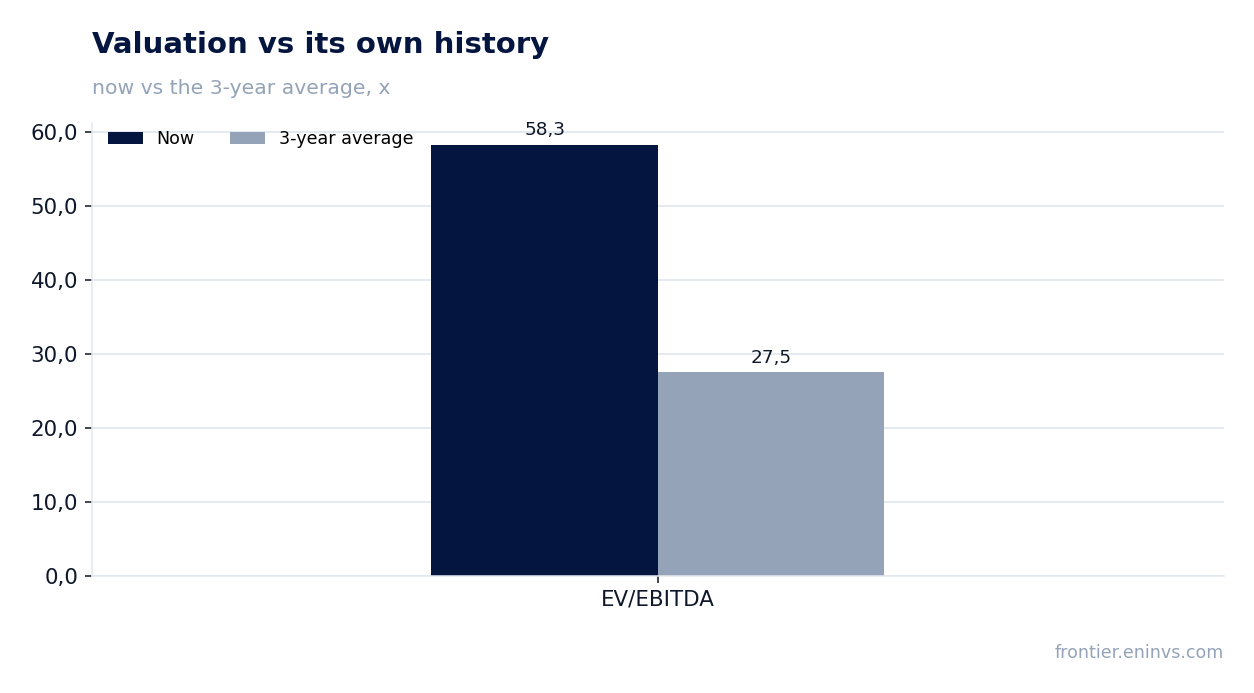
EV/EBITDA and P/E multiples are more than double their own three-year averages
The current EV/EBITDA multiple is 58.3 – more than double its own three-year average of 27.5. P/E LTM is 58.4 – also at an extreme level. The market capitalization reached $185,992 million, implying that investors are pricing in continued record margins and a recovery in revenue growth.
Even with a strong fiscal year (34% revenue growth, record EBITDA), the current valuation looks stretched: to justify such a multiple, the company needs not only to sustain margins above 50% but also to return to double-digit revenue growth. The dividend yield over the last twelve months is only 0.33% – the stock is clearly trading as a growth story, not as an income source.
The portal's model implies 15% downside from the current price
Our fundamental value-creation model, based on EBITDA growth times the target multiple, shows that the share trades 15% above its model fair value. This means the market has already priced in not only current record results but also significant optimism about future growth.
After the release, the share fell 8.5% on the day of publication but then recovered 4.0% by September 4, 2026. Nevertheless, even after the correction, the valuation remains high, and the portal's model sees no margin of safety for buying at current levels.
Valuation on the latest reported figures
| Metric | Value |
|---|---|
| Market cap | 186 bn USD |
| P/E (LTM) | 58.4 |
| EV/EBITDA (LTM) | 58.3 |
| Net debt / EBITDA (LTM) | 1.37 |
| Operating cash flow (LTM) | 2.80 bn |
| ROE | 128.4% |
| Dividend yield (12m) | 0.3% |
| EV/EBITDA, 3-year average | 27.5 |
Bottom line
The strengths of the report were record gross margin (52.3%), strong free cash flow ($1,118 million for the quarter), and significant debt reduction ($1.1 billion in the quarter). However, the 165.2% increase in net profit was largely driven by a one-off tax effect, and the 11.8% revenue decline raises questions about the sustainability of operational momentum. At the current price, the share trades at multiples more than double its own historical averages, and the portal's model points to 15% downside. Until there is confirmation of a recovery in revenue growth and margin sustainability, the share looks rather unattractive.
Open the company's financial profile STX →
See also: market overview · valuation map · stock screeners