AT&T INC.: revenue up 2.3%, but operating income rose 8.3% — what's behind it?

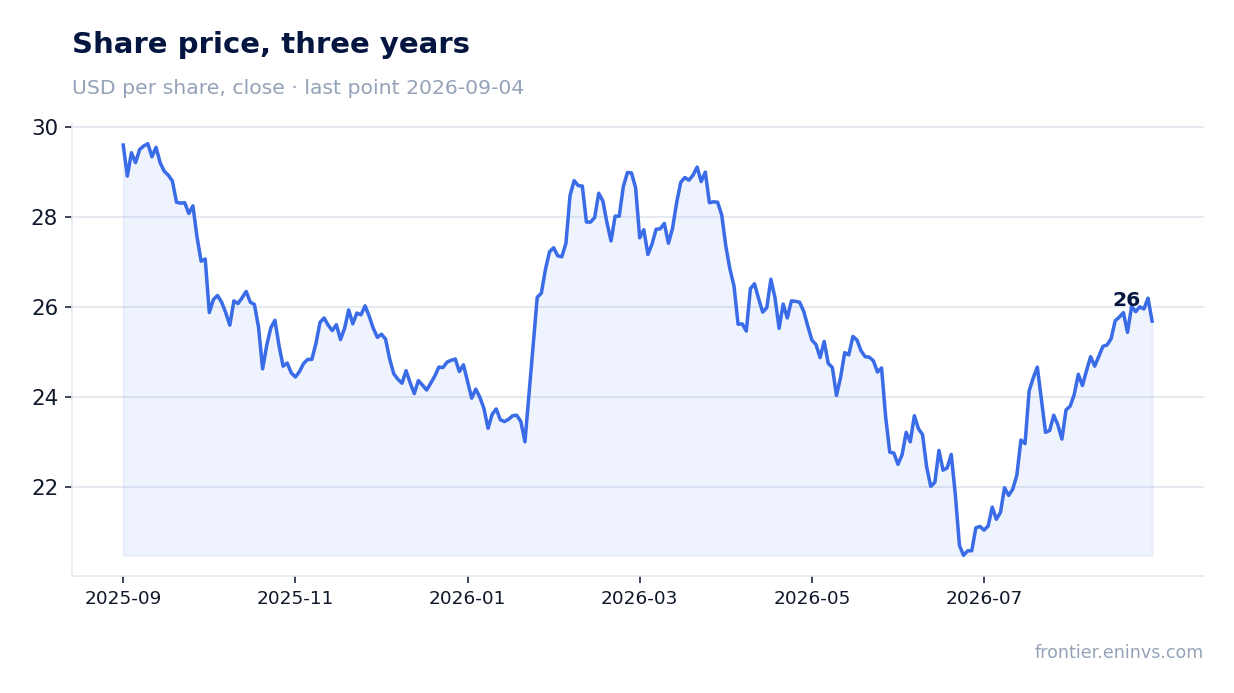
22 июля AT&T INC. раскрыла результаты за второй квартал 2026 года. Выручка выросла на 2,3% год к году до 31 558 млн долл., EBITDA — на 7,8% до 12 004 млн долл., чистая прибыль — на 2,8% до 4 627 млн долл. Акции на релизе прибавили 3,5%, а с момента публикации до 4 сентября — 15,4%. При текущей цене бумага выглядит привлекательно: мультипликатор EV/EBITDA 7,16 ниже собственного трёхлетнего среднего 7,25, а модель портала даёт upside +6%.
Key takeaways
— Revenue +2.3% — driven by services, not equipment
— EBITDA margin expanded by 2.1 pp to 40.2%
— Operating income +8.3% — faster than revenue thanks to lower depreciation
— Net income +2.8% — but with one-off items
— Leverage at 3.1x EBITDA, debt up $5.7bn over the year
— Capex up 16.4% to $5,700m, dividend maintained
— Valuation: EV/EBITDA below three-year average, portal model gives +6%
Attractiveness
Key figures, USD bn
| Metric | Q2 2025 | Q2 2026 | Change |
|---|---|---|---|
| Revenue | 30.8 | 31.6 | +2.3% |
| EBITDA | 11.8 | 12.7 | +7.8% |
| Operating profit | 6.50 | 7.04 | +8.3% |
| Net profit | 4.50 | 4.63 | +2.8% |
| Operating cash flow | 9.76 | 10.9 | +11.3% |
| Capex | 4.90 | 5.70 | +16.4% |
| EBITDA margin | 38.1% | 40.2% | +2.1 pp |
| Net margin | 14.6% | 14.7% | +0.1 pp |
Revenue +2.3% — driven by services, not equipment
In Q2 2026, AT&T INC. revenue reached $31,558m, up 2.3% year-on-year. The main contribution came from service revenues: they grew 2.7% to $25,977m, while equipment sales rose only 0.5% to $5,581m.
Within service revenue, the Advanced Connectivity segment led: wireless service revenue grew 3.3% to $17,413m, and advanced home internet revenue jumped 27.3% to $2,926m. Business fiber and advanced connectivity added 10% to $1,946m.
The Legacy segment continues to shrink: revenue fell 25.9% to $1,632m, reflecting the shift of customers from copper networks to modern technologies. Latin America grew 16.1% to $1,224m, but remains a small part of the business.
EBITDA margin expanded by 2.1 pp to 40.2%
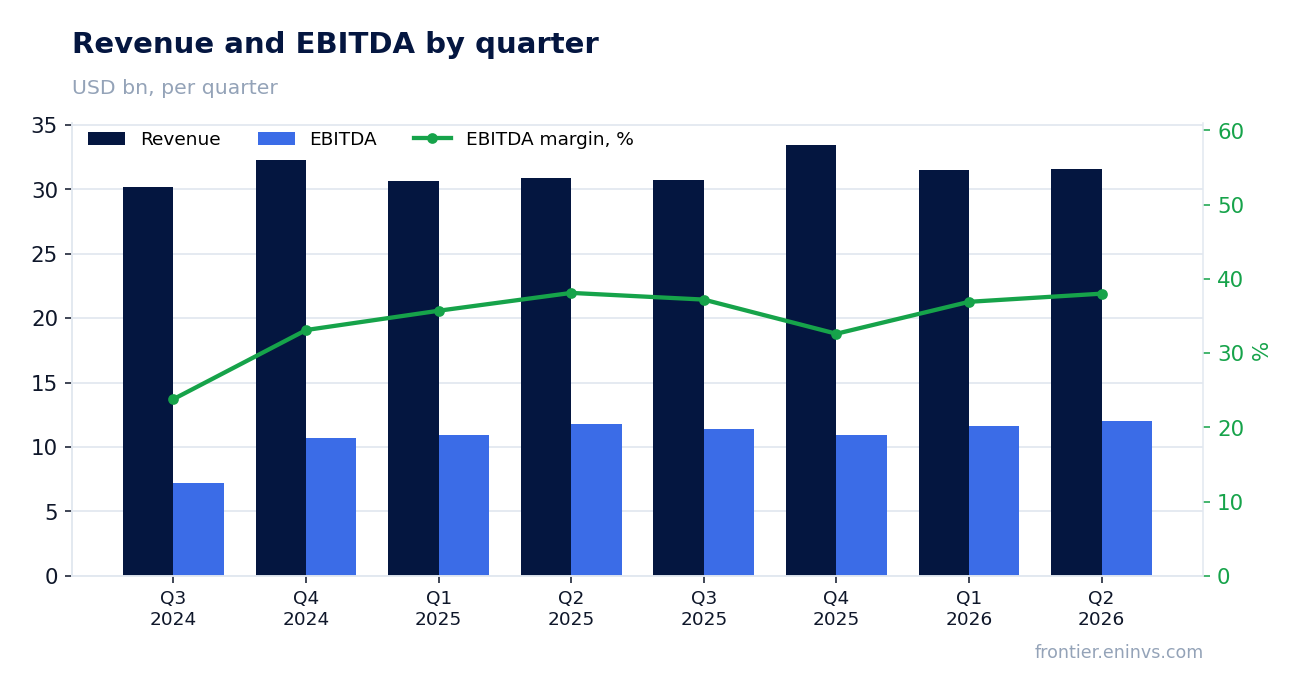
EBITDA in Q2 2026 grew 7.8% to $12,004m, and the EBITDA margin reached 40.2% versus 38.1% a year earlier. The margin expansion is a key positive signal: the company is growing not only through revenue but also through efficiency.
The main contributor to EBITDA growth was the Advanced Connectivity segment, where operating income jumped 20.3% to $7,345m, and the operating income margin expanded by 3.5 pp to 25.7%. In the Legacy segment, operating income fell 45.5% to $523m, but that is expected as copper infrastructure shrinks.
The margin improvement is partly explained by a 5.4% decline in depreciation to $4,966m, which directly boosted operating metrics.
Operating income +8.3% — faster than revenue thanks to lower depreciation
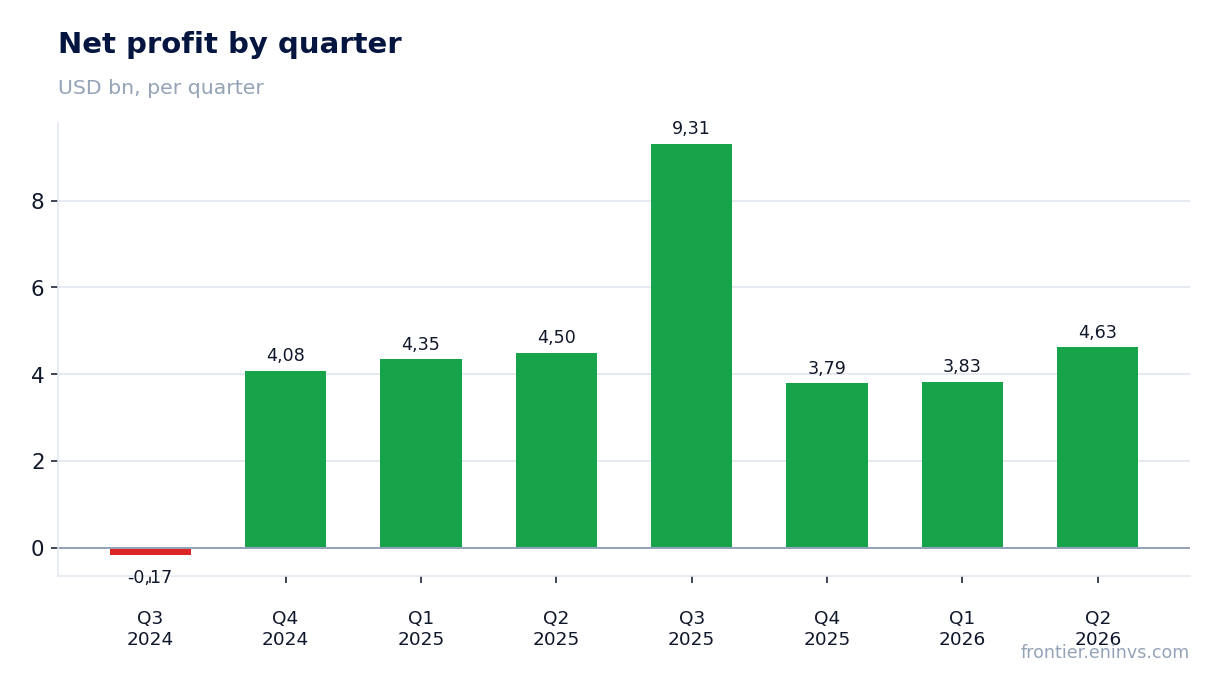
Operating income in Q2 2026 grew 8.3% to $7,038m, notably faster than revenue (+2.3%). Besides lower depreciation, a decline in other operating expenses helped: cost of revenues (excluding equipment and depreciation) fell 1.7% to $6,306m.
SG&A expenses rose 4% to $7,221m, partially offsetting the positive effect. The report also shows an 'asset impairments and restructuring' line of $286m, which was absent a year earlier.
As a result, the operating margin expanded from 21.1% to 22.3% — the second consecutive quarter of profitability improvement. If the trend continues, it will become an important argument for a re-rating.
Net income +2.8% — but with one-off items
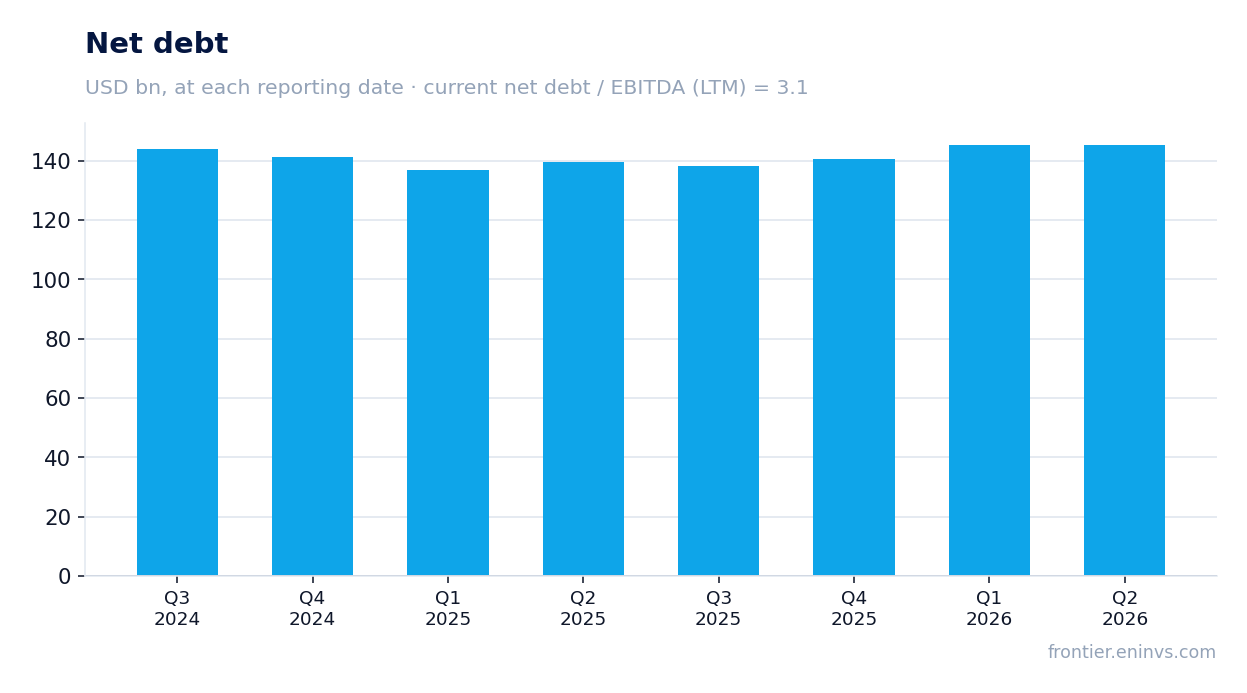
Net income attributable to AT&T INC. shareholders in Q2 2026 was $4,627m, up 2.8% year-on-year. However, one-off items affected the dynamics: equity income swung from +$485m to −$29m, and other income declined 9.3% to $696m.
The effective tax rate fell to 13.5% from 20.3% a year earlier, adding roughly $400m to net income. Without this effect, net income would have been below last year's level.
For the first half, net income declined 4.5% to $8,456m, reflecting a weak first quarter when profit fell 12% due to one-off investment losses.
Leverage at 3.1x EBITDA, debt up $5.7bn over the year
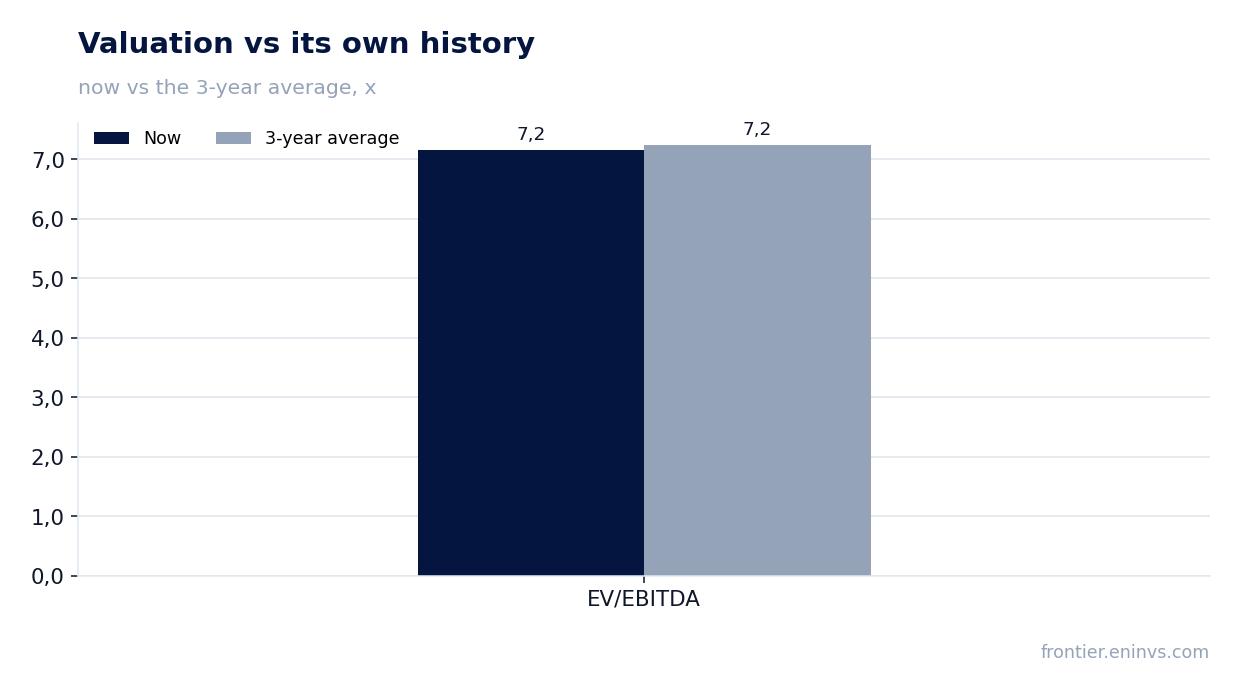
AT&T INC.'s net debt at the end of Q2 2026 was $140,390m, up $5.7bn from a year earlier. The net debt to EBITDA ratio for the trailing twelve months is 3.1.
The debt increase is linked to higher capital expenditures and acquisitions: in the first half, capex rose 15.3% to $10,577m, and acquisitions (including spectrum) totaled $2,725m versus $48m a year earlier.
Interest expense in Q2 rose 13.8% to $1,883m, reflecting a higher debt level and possibly higher rates. Nevertheless, the company retains an investment-grade rating and market access: it issued $14,037m of debt in the half.
Capex up 16.4% to $5,700m, dividend maintained
Capital expenditures in Q2 2026 were $5,700m, up 16.4% year-on-year. The company continues to invest heavily in 5G and fiber networks, visible in subscriber growth: 646k net internet additions in the quarter, including 367k new fiber lines.
Operating cash flow in the quarter rose 11.3% to $10,870m, covering capex and dividends without increasing debt on a quarterly basis: net debt was nearly flat versus the prior quarter (−$0.0bn in ruble terms).
The dividend was maintained at $0.2775 per share per quarter, implying a dividend yield of 4.33% over the trailing twelve months. The company also bought back shares: $4,669m spent on treasury stock in the half.
Valuation: EV/EBITDA below three-year average, portal model gives +6%
The current EV/EBITDA multiple is 7.16, below its own three-year average of 7.25. This suggests the stock trades at a slight discount to its history, despite the post-earnings rally.
P/E for the trailing twelve months is 8.54, also moderate for a company with growing EBITDA and stable cash flow. ROE stands at 14.7%.
According to the portal's model, based on EBITDA growth and a target multiple, the upside potential is +6% from the current price. This is a modest but positive signal, confirming the stock is not overvalued.
Valuation on the latest reported figures
| Metric | Value |
|---|---|
| Market cap | 184 bn USD |
| P/E (LTM) | 8.5 |
| EV/EBITDA (LTM) | 7.2 |
| P/B | 1.46 |
| Net debt / EBITDA (LTM) | 3.10 |
| Operating cash flow (LTM) | 40.3 bn |
| ROE | 14.7% |
| Dividend yield (12m) | 4.3% |
| EV/EBITDA, 3-year average | 7.2 |
Bottom line
The Q2 2026 report showed steady but moderate growth: revenue rose 2.3%, EBITDA 7.8%, and operating income 8.3% thanks to lower depreciation and cost control. The margin expansion to 40.2% is the main positive, confirming business efficiency. However, net income grew only 2.8% due to one-off items, and debt continues to rise. At the current price, the shares look attractive: the EV/EBITDA multiple is below its own three-year average, the 4.33% dividend yield provides support, and the portal's model implies +6% upside. The key question for holders is whether the company can sustain margins and cash flow amid rising capex and debt.
Open the company's financial profile T →
See also: market overview · valuation map · stock screeners