TJX COMPANIES INC /DE/: profit up 22%, but shares down 16% after the report — the market doubts margin sustainability

On August 19, 2026, TJX COMPANIES INC /DE/ reported results for the second quarter of fiscal 2027 (ended August 1, 2026). Revenue grew 5.4% to $15,180 million, net profit rose 22.3% to $1,520 million, yet shares fell 4.2% the next day and another 16.4% by September 9. Despite strong numbers, the market is wary: profit growth was largely driven by one-off tariff refunds, and comparable sales in the key Marmaxx segment rose only 1%. Verdict: shares look rather attractive — EV/EBITDA of 14.6 is below its own three-year average of 19.3, and the portal's model implies +26% upside.
Key takeaways
— Net profit rose 22.3% in Q2, but $219 million of that is one-off tariff refunds
— Comparable sales grew 4%, but Marmaxx added only 1%, with growth driven by HomeGoods and international segments
— EBITDA margin expanded to 15.5% from 13.6% a year ago, but without tariff refunds the increase would have been more modest
— The company returned $1.3 billion to shareholders in the quarter and raised its full-year margin and profit guidance
— Leverage is low: net debt is negative, and net debt/EBITDA stands at 0.72
— Shares fell 16% after the report despite strong results — the market is pricing in a slowdown
— Dividend yield of 1.44% over 12 months is modest, but payouts are growing along with profit
Attractiveness
Key figures, USD bn
| Metric | Q2 2025 | Q2 2026 | Change |
|---|---|---|---|
| Revenue | 14.4 | 15.2 | +5.4% |
| EBITDA | 1.96 | 2.36 | +20.6% |
| Operating profit | 1.65 | 2.02 | +22.5% |
| Net profit | 1.24 | 1.52 | +22.3% |
| Operating cash flow | 1.79 | 2.23 | +24.3% |
| Capex | 0.46 | 0.50 | +7.8% |
| EBITDA margin | 13.6% | 15.5% | +1.9 pp |
| Net margin | 8.6% | 10.0% | +1.4 pp |
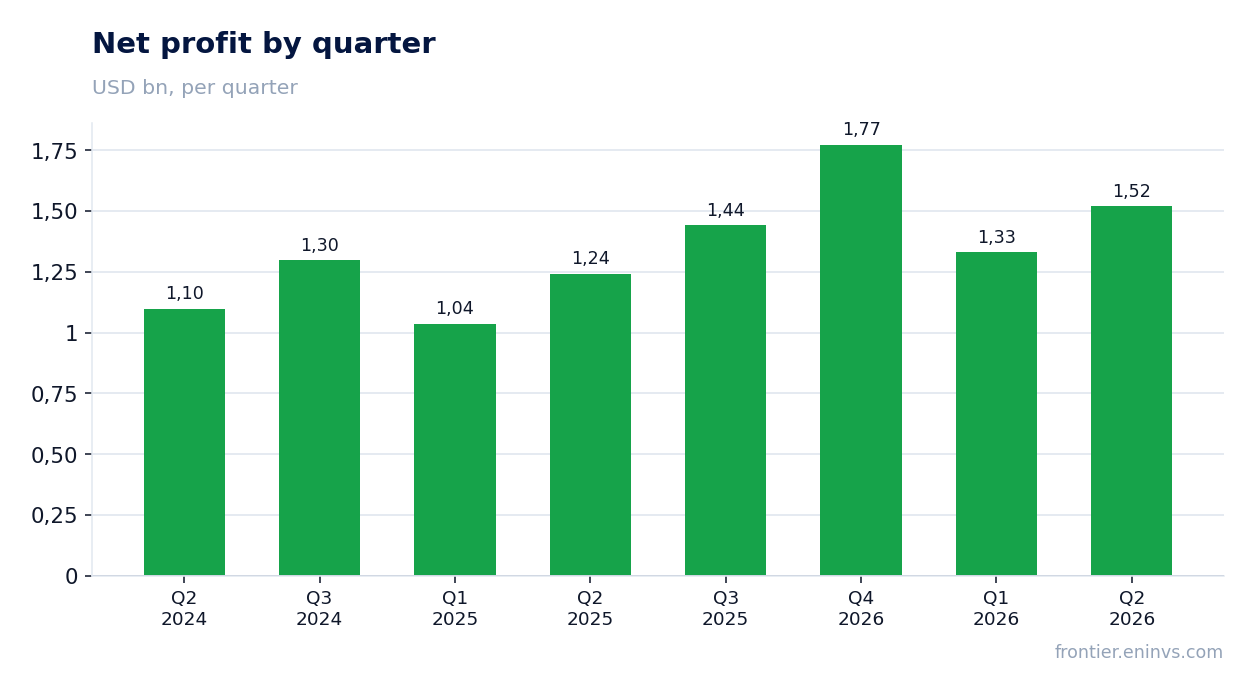
Net profit rose 22.3% in Q2, but $219 million of that is one-off tariff refunds
In the second quarter of fiscal 2027, net profit of TJX COMPANIES INC /DE/ was $1,520 million versus $1,243 million a year earlier. The 22.3% increase is the strongest in recent quarters: in the prior quarter profit grew 9.2%, and a year ago 6.9%.
However, a large part of the increase is one-off. The company received IEEPA tariff refunds of $331 million, partially offset by accruing $112 million in employee bonuses. The net effect is $219 million pretax, or about 14 cents per share. Excluding this, adjusted EPS would have risen 11%, not 24%.
Comparable sales grew 4%, but Marmaxx added only 1%, with growth driven by HomeGoods and international segments
Consolidated comparable sales rose 4% in Q2, above the company's plan. But the dynamics are uneven: Marmaxx, the largest division with revenue of $9,109 million, added only 1%. HomeGoods grew 7%, TJX Canada 6%, and TJX International 7%.
CEO Ernie Herrman acknowledged that Marmaxx sales came in below expectations but noted improvement early in Q3. The weakness in the key segment is likely what spooked investors: if the main brand is slowing, reliance on international markets and HomeGoods may not offset the US deceleration.
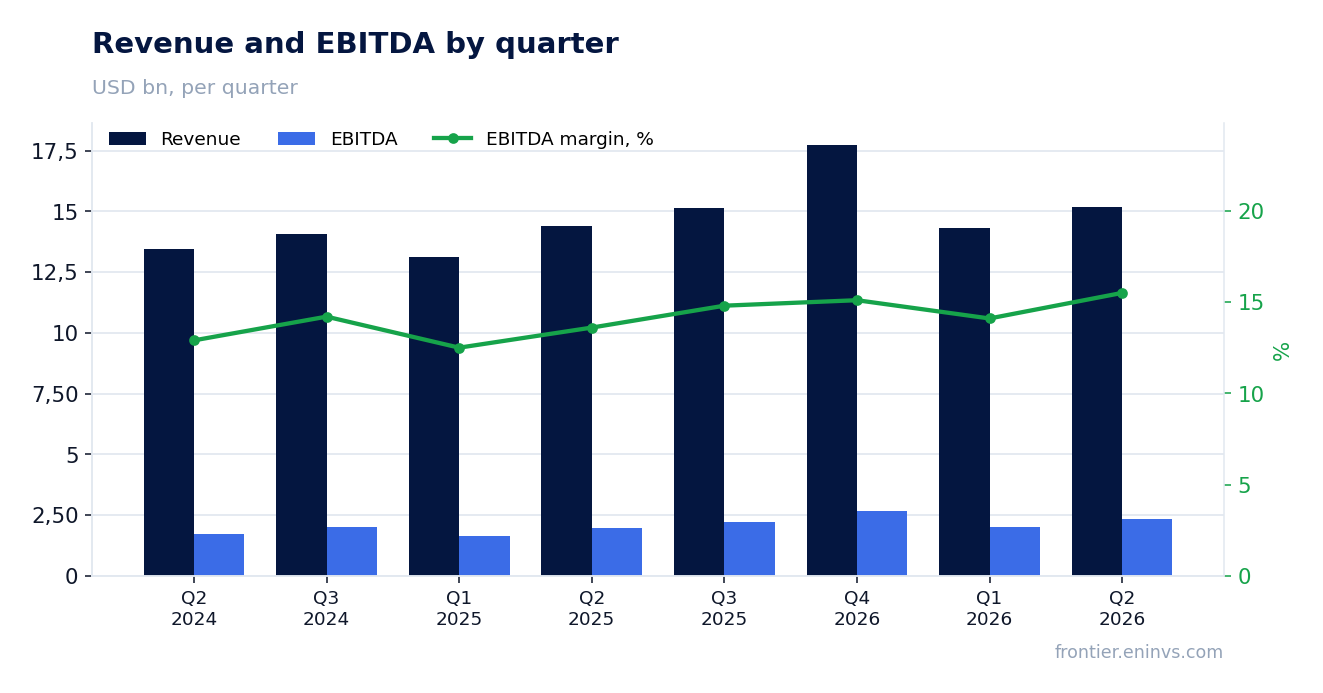
EBITDA margin expanded to 15.5% from 13.6% a year ago, but without tariff refunds the increase would have been more modest
EBITDA in Q2 rose 20.6% to $2,358 million, and the EBITDA margin reached 15.5% versus 13.6% a year earlier. Gross margin increased 2.7 percentage points to 33.4%, which the company attributes to higher merchandise margin.
But here too tariff refunds played a key role: without them, adjusted gross margin would have risen only 0.7 pp, and adjusted pretax margin 0.5 pp to 11.9%. Organic margin improvement exists but is much more modest than it appears at first glance.
The company returned $1.3 billion to shareholders in the quarter and raised its full-year margin and profit guidance
In Q2, TJX COMPANIES INC /DE/ returned $1.3 billion to shareholders, of which $798 million went to repurchase 5.1 million shares and $529 million to dividends. In the first half, total returns were $2.4 billion.
The company raised its full-year fiscal 2027 pretax margin guidance to 12.3–12.4% (including tariff refunds) and diluted EPS to $5.31–5.36. Excluding refunds, $5.15–5.20. TJX also plans to accelerate store openings to 4% annually starting in fiscal 2028 and increased its long-term store target to 7,500.
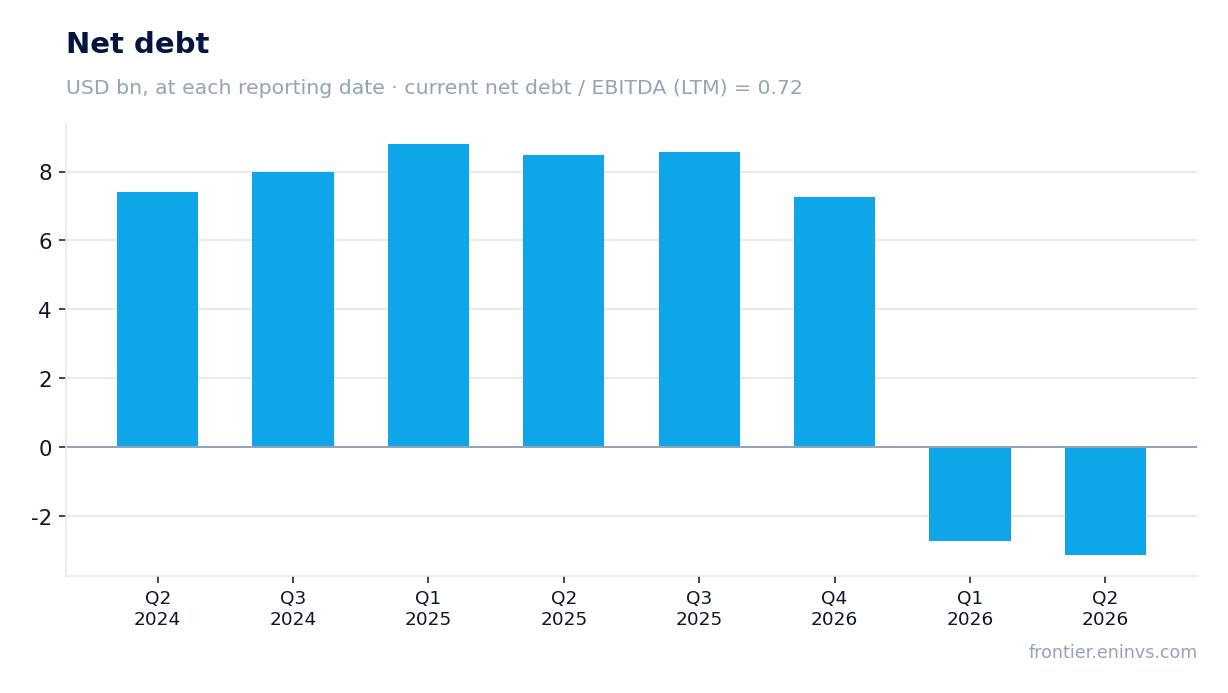
Leverage is low: net debt is negative, and net debt/EBITDA stands at 0.72
At the end of Q2, net debt was negative at -$3,133 million, meaning cash exceeds debt. Over the year, net debt decreased by $11.6 billion (in ruble equivalent), and by $0.4 billion over the quarter.
Net debt/EBITDA over the trailing twelve months is 0.72 — a low level that gives the company significant financial flexibility. Operating cash flow in Q2 was $2,226 million, comfortably covering capex of $497 million and dividends.
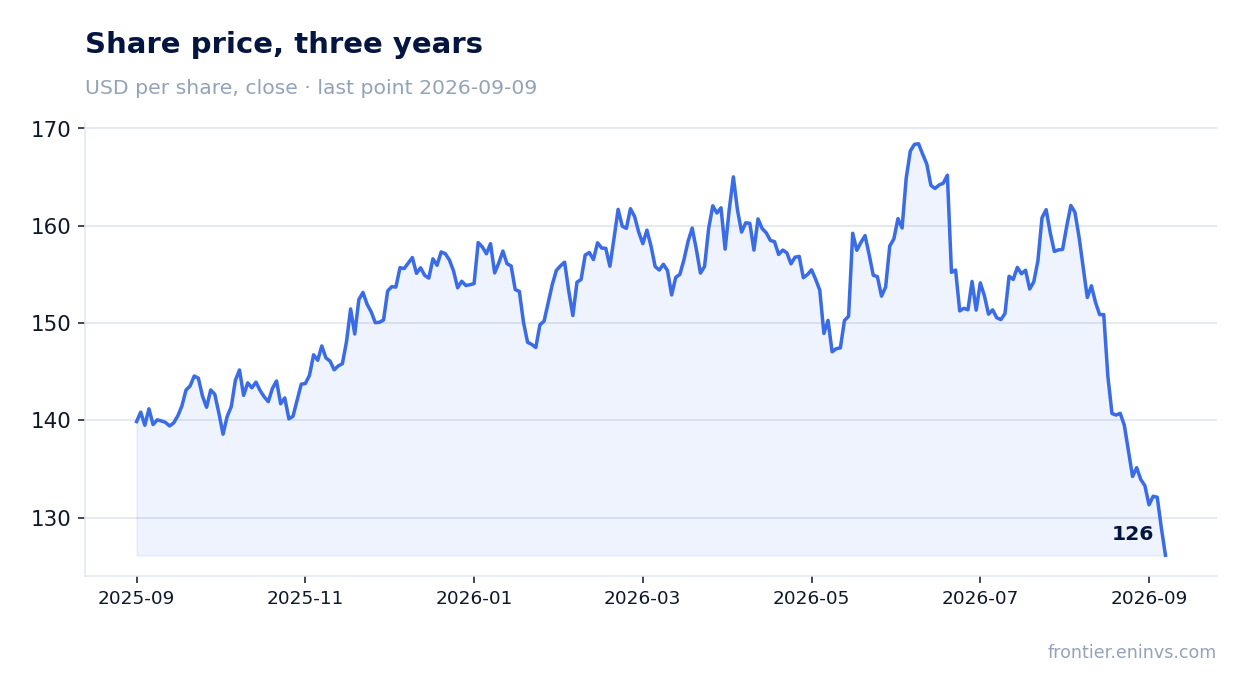
Shares fell 16% after the report despite strong results — the market is pricing in a slowdown
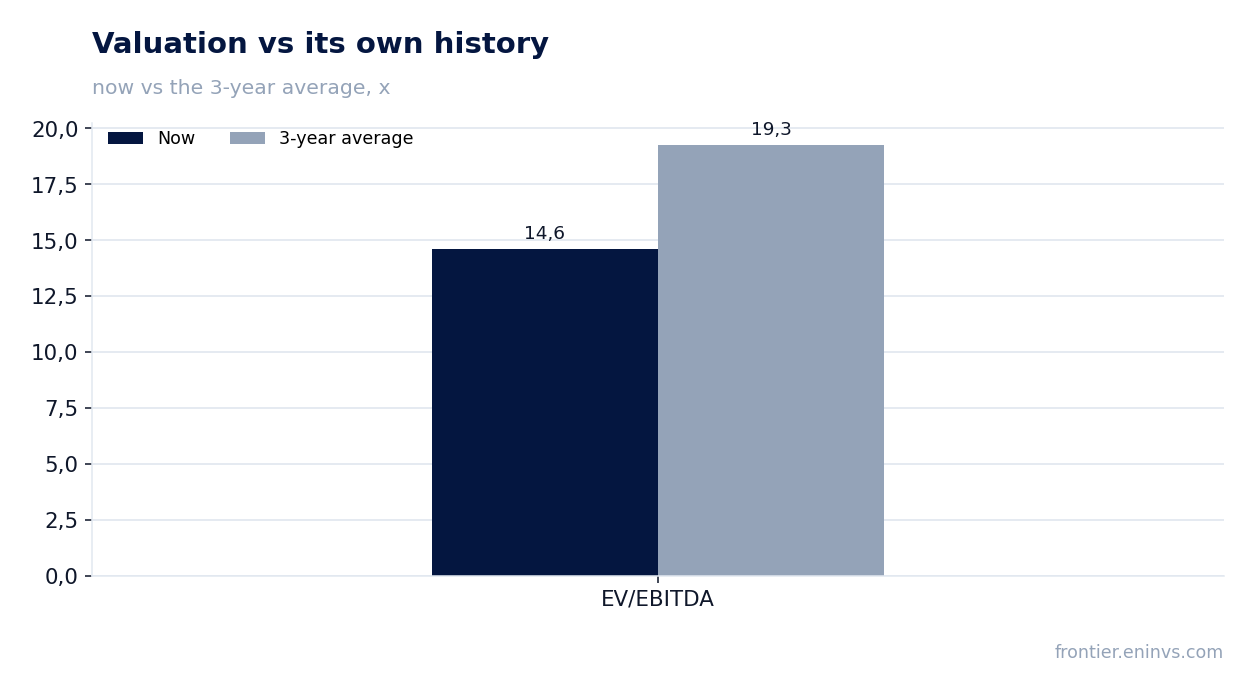
The share price before the release was $150.85; the next day it fell 4.2%, and by September 9, 2026, it was down 16.4% from the pre-release level. Such a reaction to strong quarterly numbers looks paradoxical but is explainable: the market saw Marmaxx weakness and profit dependence on one-offs.
As a result, EV/EBITDA over the trailing twelve months has dropped to 14.6 — well below the three-year average of 19.3. P/E LTM is 23.0. According to the portal's model, the upside to fair value is +26%.
Dividend yield of 1.44% over 12 months is modest, but payouts are growing along with profit
Over the trailing twelve months, the dividend yield of TJX COMPANIES INC /DE/ was 1.44%. In Q2, the company paid dividends of $0.48 per share, up 13% from $0.425 a year earlier. In the first half, payouts were $0.96 versus $0.85.
The company increases dividends along with profit: in the first half, $1.0 billion went to dividends against net profit of $2.9 billion, implying a payout ratio of about 35%. At the current price and expected EPS of $5.31–5.36 for the year, the dividend could be around $1.92, yielding about 1.5% — still modest but stable.
Valuation on the latest reported figures
| Metric | Value |
|---|---|
| Market cap | 140 bn USD |
| P/E (LTM) | 23.0 |
| EV/EBITDA (LTM) | 14.6 |
| P/B | 13.70 |
| Net debt / EBITDA (LTM) | 0.72 |
| Operating cash flow (LTM) | 6.90 bn |
| ROE | 57.8% |
| Dividend yield (12m) | 1.4% |
| EV/EBITDA, 3-year average | 19.3 |
Bottom line
TJX COMPANIES INC /DE/'s Q2 report is strong: revenue grew 5.4%, EBITDA margin expanded to 15.5%, and the company raised its full-year guidance. But a large part of the profit increase is one-off tariff refunds, and organic margin improvement is more modest than it appears. Marmaxx weakness is the main reason for caution, although management cites improvement early in Q3. Meanwhile, shares have fallen 16% after the report, and EV/EBITDA of 14.6 is now well below its own three-year average of 19.3, with the portal's model implying +26% upside. Verdict: shares are rather attractive — the market may have overestimated slowdown risks, and the current price already discounts much negativity.
Open the company's financial profile TJX →
See also: market overview · valuation map · stock screeners