T-Mobile US: EBITDA margin up to 41.8%, but net profit nearly flat on one-off costs

On July 23, T-Mobile US reported Q2 2026 results: revenue grew 7.9% YoY, EBITDA 14.1%, but net profit only 0.5% due to one-off costs related to UScellular integration and network restructuring. The stock fell 10.7% on the release, and the portal's model implies -6% upside to fair value, making the share rather unattractive at the current price.
Key takeaways
— Revenue grew 7.9% on postpaid services and acquisitions, but equipment sales declined
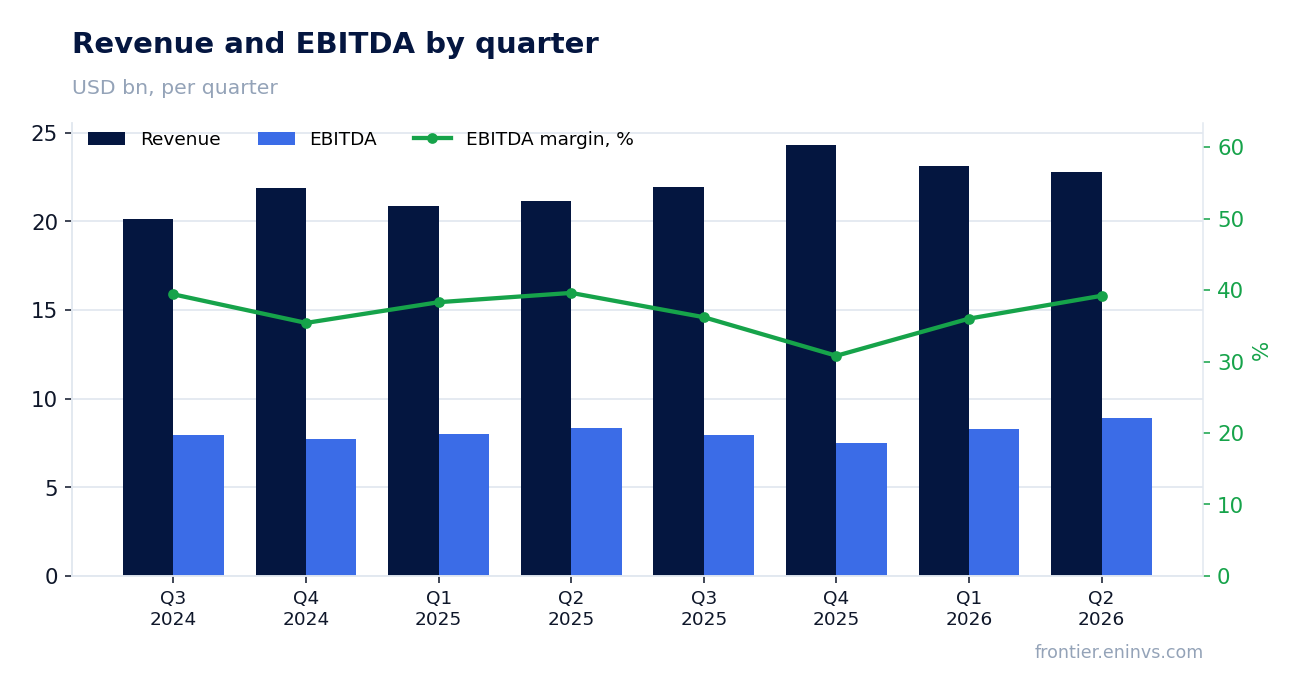
— EBITDA margin reached 41.8% vs 39.6% a year ago on operating leverage
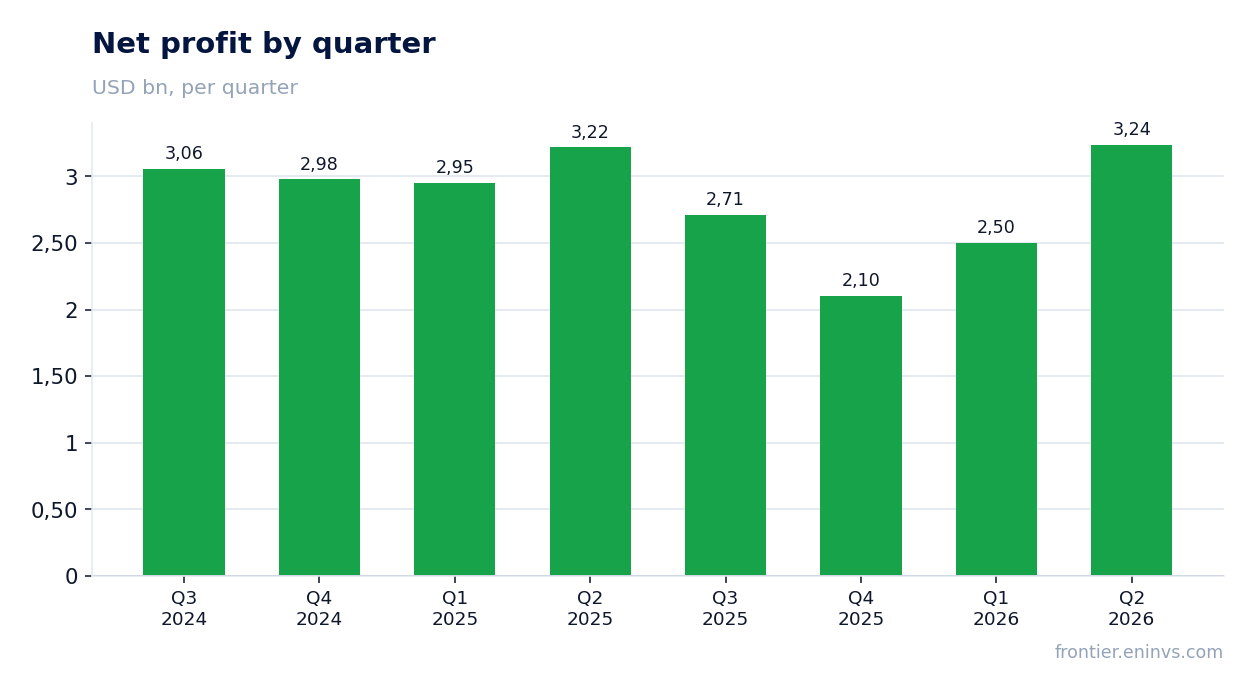
— Net profit barely grew: one-off costs ate the operating growth
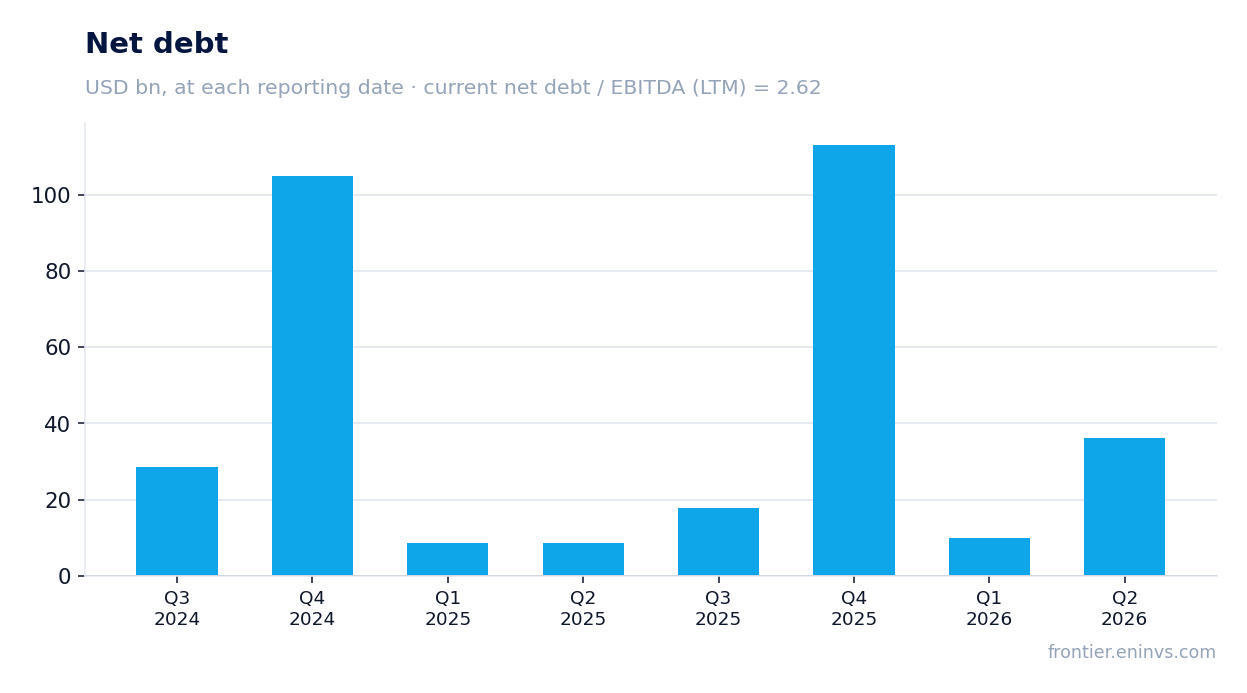
— Leverage of 2.62x EBITDA is moderate, but absolute debt increased
— Capex rose 13%, free cash flow only 4%
— Shares fell 10.7% after the report despite strong operating metrics
— Portal's model implies -6% upside from the current price
Attractiveness
Key figures, USD bn
| Metric | Q2 2025 | Q2 2026 | Change |
|---|---|---|---|
| Revenue | 21.1 | 22.8 | +7.9% |
| EBITDA | 8.36 | 9.54 | +14.1% |
| Operating profit | 5.21 | 5.49 | +5.3% |
| Net profit | 3.22 | 3.24 | +0.5% |
| Operating cash flow | 6.99 | 7.50 | +7.3% |
| Capex | 2.40 | 2.70 | +12.8% |
| EBITDA margin | 39.6% | 41.8% | +2.2 pp |
| Net margin | 15.2% | 14.2% | -1.0 pp |
Revenue grew 7.9% on postpaid services and acquisitions, but equipment sales declined
In Q2 2026, T-Mobile US revenue reached $22,791 million, up 7.9% YoY. The main driver was postpaid services, up 13% on higher account base, including UScellular and Metronet acquisitions, and ARPA growth of 2%.
Equipment revenue rose only 2%: the company sold fewer devices, but the average ticket increased on a richer mix. Sequentially, revenue declined 1.4% on a 12% drop in equipment sales.
EBITDA margin reached 41.8% vs 39.6% a year ago on operating leverage
EBITDA in Q2 grew 14.1% to $8,924 million, with margin expanding from 39.6% to 41.8%. The company cites service revenue growth, which requires little incremental cost, and expense discipline.
Operating profit rose 5.3% to $5,490 million, but slower than EBITDA due to accelerated depreciation from UScellular integration and network restructuring.
Net profit barely grew: one-off costs ate the operating growth
Net profit for the quarter was $3,239 million, only 0.5% above last year. One-off items included $146 million after tax for UScellular integration (accelerated depreciation) and $46 million for network restructuring.
A year ago, there was a one-off gain of $113 million from spectrum sale. Without these, net profit would have grown much faster, but in the report they offset the operating leverage.
Leverage of 2.62x EBITDA is moderate, but absolute debt increased
At quarter-end, net debt stood at $113,139 million, up $6.7 billion from the previous reporting date. Net debt to EBITDA for the last twelve months is 2.62x, moderate for a telecom.
The increase is tied to share buybacks: the company spent $2.2 billion in the quarter and $44.2 billion since the program started in 2022.
Capex rose 13%, free cash flow only 4%
Capex in Q2 rose 13% to $2,703 million on planned purchases and incremental spending after UScellular. Operating cash flow increased 7% to $7,500 million.
Free cash flow grew only 4% to $4,797 million, as higher capex ate part of the operating momentum. Quarterly dividends were $1.1 billion, or $1.02 per share.
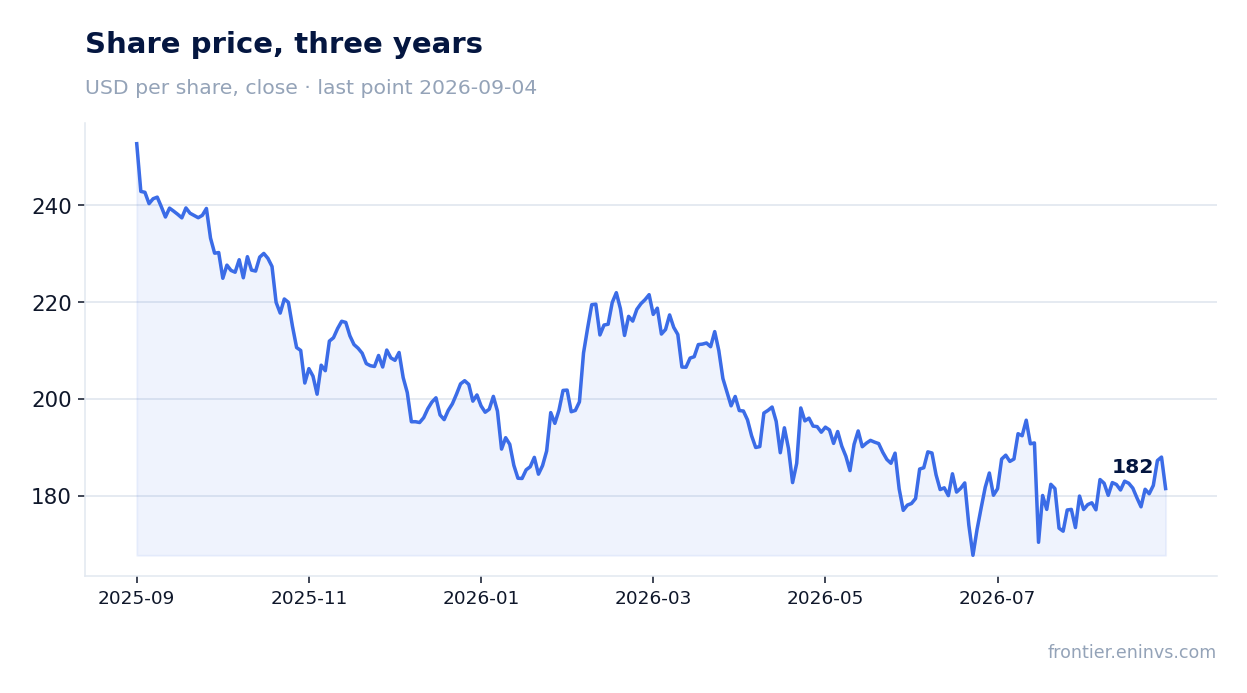
Shares fell 10.7% after the report despite strong operating metrics
The close before the report was $190.94; shares fell 10.7% on the release day and another 4.9% by September 4. The market likely reacted to weak net profit growth and revenue deceleration to 7.9% from 10.6% in the prior quarter.
Operating metrics remain strong: postpaid accounts grew by 277 thousand in the quarter, churn fell to 0.99%.
Portal's model implies -6% upside from the current price
According to the portal's model, the fundamental fair value is 6% below the current price. This suggests the market already prices in strong operating results and further growth, leaving little room for positive re-rating.
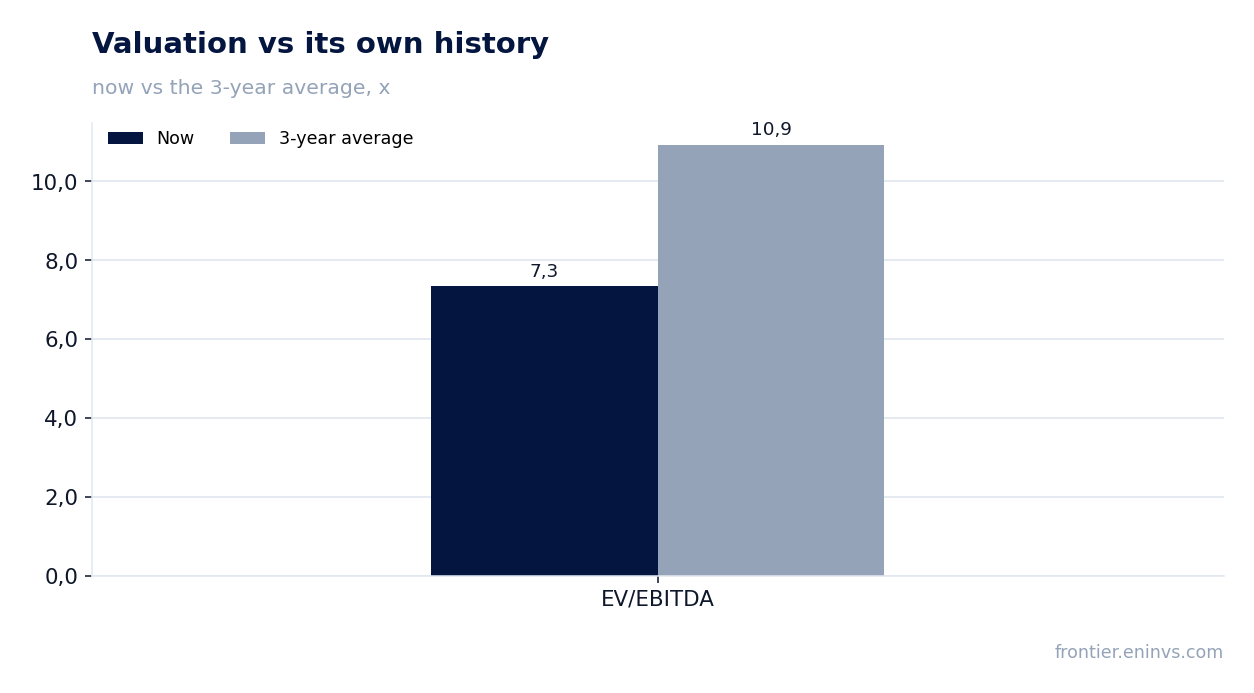
EV/EBITDA is 7.34x versus the three-year average of 10.93x, indicating a significant discount to its own history. However, P/E of 19.27x is not low for a company with nearly flat net profit growth.
Valuation on the latest reported figures
| Metric | Value |
|---|---|
| Market cap | 203 bn USD |
| P/E (LTM) | 19.3 |
| EV/EBITDA (LTM) | 7.3 |
| P/B | 3.44 |
| Net debt / EBITDA (LTM) | 2.62 |
| Operating cash flow (LTM) | 27.9 bn |
| ROE | 23.1% |
| Dividend yield (12m) | 2.3% |
| EV/EBITDA, 3-year average | 10.9 |
Bottom line
T-Mobile US delivered a strong operating quarter: EBITDA margin expanded to 41.8%, postpaid base is growing, churn is falling. However, net profit was nearly flat due to one-off costs, and free cash flow grows slowly on higher capex. Shares fell 10.7% after the report, and the portal's model sees another 6% downside. At EV/EBITDA of 7.34x versus the three-year average of 10.93x, the valuation is not stretched, but a return to double-digit net profit growth is needed. Until then, the share is rather unattractive.
Open the company's financial profile TMUS →
See also: market overview · valuation map · stock screeners