Tesla, Inc.: revenue up 25.5%, but profit falls — margin compresses to 3.9%

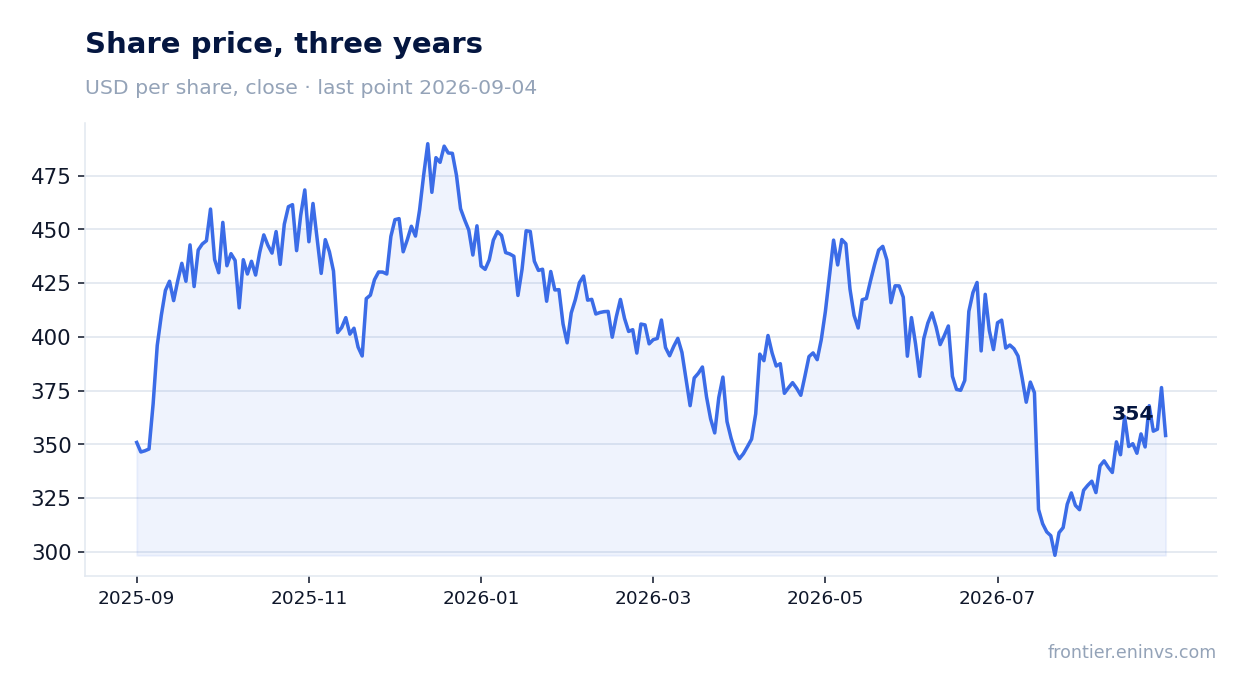
25 августа Tesla, Inc. раскрыла результаты за второй квартал 2026 года. Выручка выросла на 25,5% год к году, до 28 236 млн долл., EBITDA — на 57,9%, до 3 273 млн долл., однако чистая прибыль снизилась на 4,9%, до 1 114 млн долл., из-за падения операционной маржи. При текущей цене акция выглядит непривлекательно: мультипликатор EV/EBITDA почти вдвое выше собственного трёхлетнего среднего, а рентабельность остаётся под давлением.
Key takeaways
— Revenue in Q2 2026 grew 25.5% YoY to $28,236 million, after two quarters of decline
— EBITDA rose 57.9% YoY to $3,273 million, but operating profit fell to $398 million
— Net profit declined 4.9% YoY to $1,114 million, as taxes and other items ate the operating result
— EBITDA margin improved to 11.6% from 9.2% a year earlier, but net margin fell to 3.9% from 5.2%
— Capital expenditures in Q2 2026 nearly doubled to $5,796 million, exceeding operating cash flow
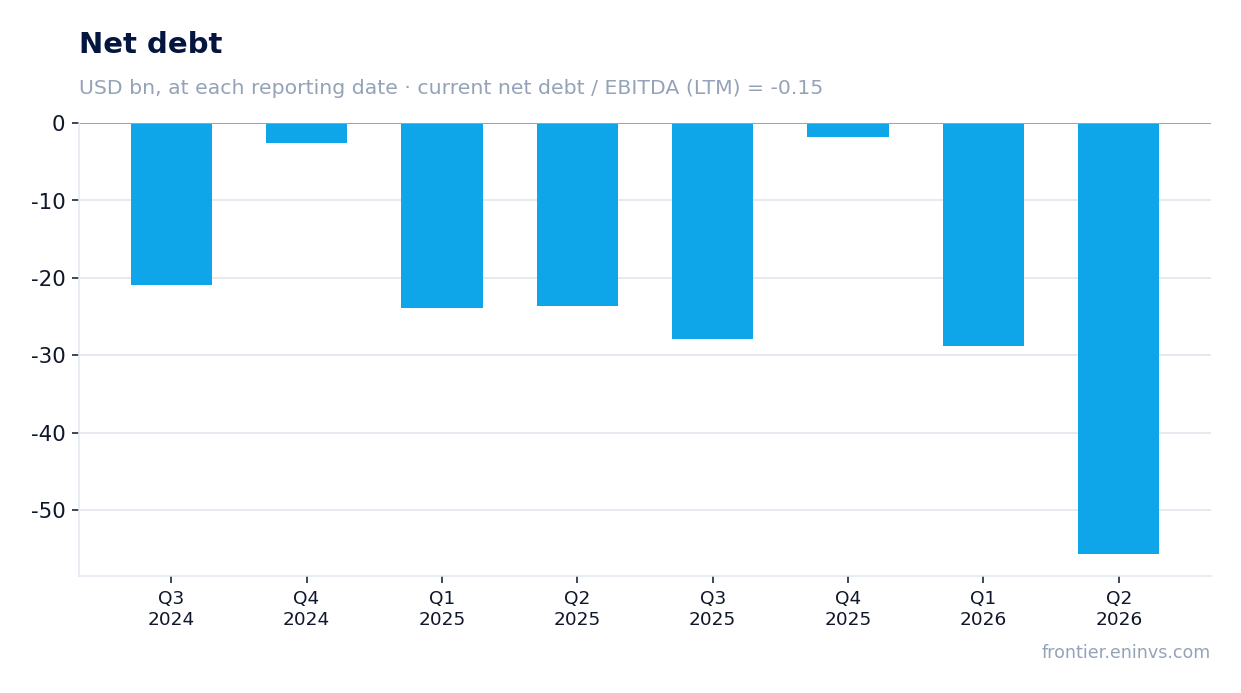
— Net debt is negative: minus $1,794 million, with net debt to EBITDA for the last twelve months at minus 0.15
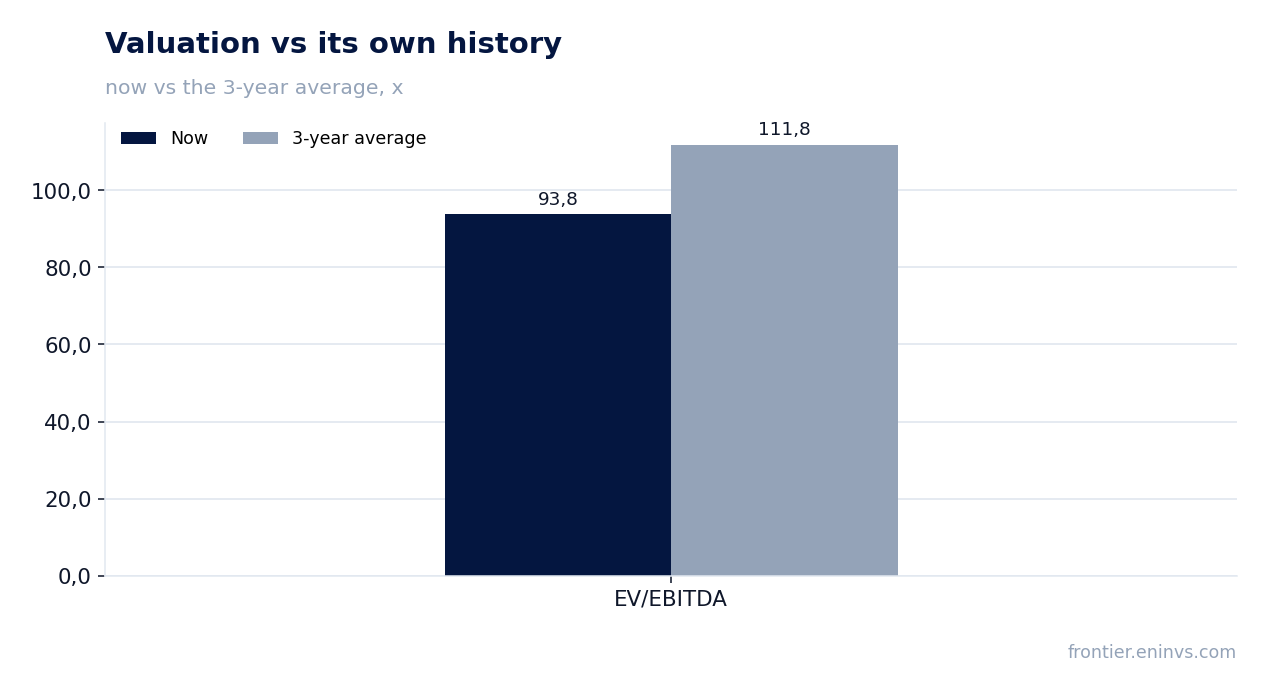
— Valuation remains high: P/E for the last twelve months is 300.2, EV/EBITDA is 93.8 versus the three-year average of 111.8
Attractiveness
Key figures, USD bn
| Metric | Q2 2025 | Q2 2026 | Change |
|---|---|---|---|
| Revenue | 22.5 | 28.2 | +25.5% |
| EBITDA | 2.07 | 3.27 | +57.9% |
| Operating profit | 0.92 | 0.40 | -56.9% |
| Net profit | 1.17 | 1.11 | -4.9% |
| Operating cash flow | 2.54 | 4.70 | +84.9% |
| Capex | 2.39 | 5.80 | +142.1% |
| EBITDA margin | 9.2% | 11.6% | +2.4 pp |
| Net margin | 5.2% | 3.9% | -1.3 pp |
Revenue in Q2 2026 grew 25.5% YoY to $28,236 million, after two quarters of decline
In Q2 2026, Tesla, Inc. revenue reached $28,236 million, up 25.5% year-on-year. This is an acceleration after two quarters of decline: in Q1 2025 revenue fell 9.2%, and in Q2 2025 it fell 11.8%. Growth resumed in Q3 2025 (+11.6%), but turned negative again in Q4 2025 (–3.1%).
Q1 2026 showed growth of 15.8%, and Q2 2026 reached 25.5%. Thus, the dynamics are improving, but the comparison base was low: a year ago revenue was falling. It is too early to call a trend reversal, but the direction is positive.
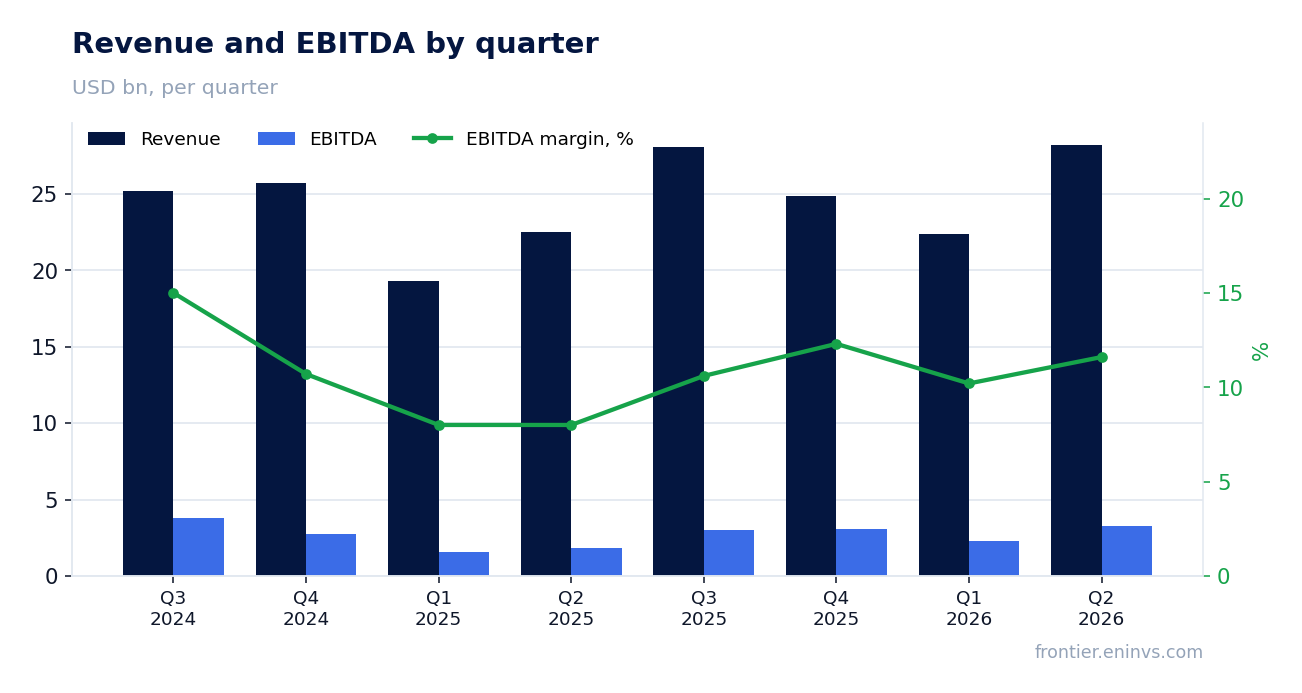
EBITDA rose 57.9% YoY to $3,273 million, but operating profit fell to $398 million
EBITDA in Q2 2026 grew 57.9% year-on-year to $3,273 million, significantly outpacing revenue growth. However, operating profit was only $398 million — the lowest level in recent quarters. For comparison, a year earlier operating profit was $923 million, and in Q3 2025 it was $1,624 million.
The gap between EBITDA and operating profit points to rising depreciation and possibly other operating expenses. This means operating efficiency is declining despite revenue growth. Investors should watch the cost structure in the next report.
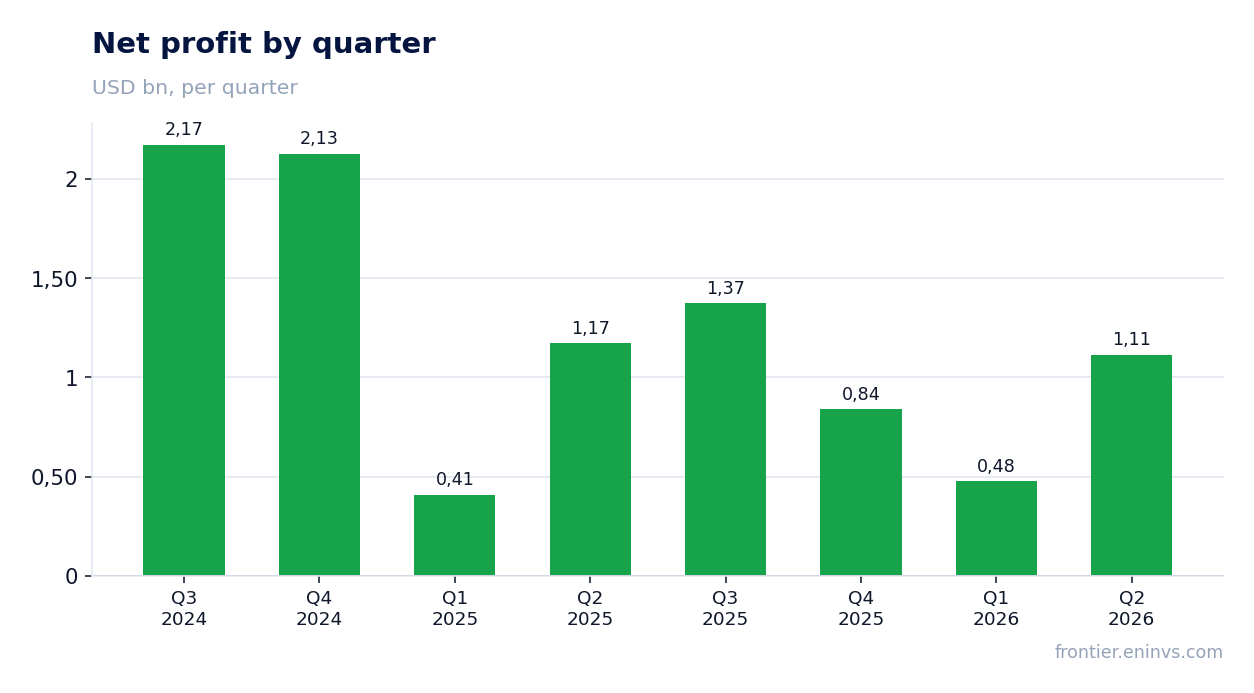
Net profit declined 4.9% YoY to $1,114 million, as taxes and other items ate the operating result
Net profit for Q2 2026 was $1,114 million, down 4.9% year-on-year from $1,172 million. Operating profit fell more than half, but net profit declined less sharply — likely due to one-off gains or a lower tax burden.
In previous quarters, net profit was also volatile: from $409 million in Q1 2025 to $2,173 million in Q3 2024. In Q2 2026, operating profit was low, but net profit was higher than in Q1 2026 ($477 million), indicating volatility in other items.
EBITDA margin improved to 11.6% from 9.2% a year earlier, but net margin fell to 3.9% from 5.2%
EBITDA margin in Q2 2026 was 11.6% versus 9.2% a year earlier. This improvement is due to EBITDA growing faster than revenue. However, net margin fell to 3.9% from 5.2% a year earlier, reflecting higher depreciation and other expenses.
Thus, operating efficiency in terms of EBITDA improved, but at the net profit level the company became less profitable. This is typical for periods of intensive investment, when depreciation grows faster than revenue.
Capital expenditures in Q2 2026 nearly doubled to $5,796 million, exceeding operating cash flow
Capital expenditures in Q2 2026 were $5,796 million, significantly higher than in previous quarters (e.g., $2,493 million in Q1 2026 and $2,394 million a year earlier). Operating cash flow for the quarter was $4,697 million, meaning the company spent more on investments than it generated from operations.
This led to negative free cash flow for the quarter. However, over the last twelve months, operating cash flow was $14,700 million, covering capital expenditures for the same period (totaling about $12,930 million over four quarters). Nevertheless, if investment pace continues, the company may need to take on debt.
Net debt is negative: minus $1,794 million, with net debt to EBITDA for the last twelve months at minus 0.15
At the end of Q2 2026, Tesla, Inc.'s net debt was minus $1,794 million, meaning cash exceeds debt. The net debt to EBITDA ratio for the last twelve months is minus 0.15, indicating financial stability.
During the quarter, net debt decreased by RUB 26.9 billion (in ruble terms), and over the last twelve months by RUB 32.1 billion. However, these changes do not reflect the dynamics of the debt-to-EBITDA ratio, as the previous value of this metric is not available.
Valuation remains high: P/E for the last twelve months is 300.2, EV/EBITDA is 93.8 versus the three-year average of 111.8
Tesla, Inc.'s market capitalization is $1,141,819.48 million, which, with net profit of $3,804 million over the last twelve months, gives a P/E of about 300.2. This is an extremely high valuation, even for a fast-growing company.
EV/EBITDA for the last twelve months is 93.8, below the three-year average of 111.8, but still very high. According to the portal's model, the upside to fair value is +12%, which does not justify the current premium. For comparison, return on equity (ROE) is only 5.2%, making such a valuation even more demanding.
Valuation on the latest reported figures
| Metric | Value |
|---|---|
| Market cap | 1 142 bn USD |
| P/E (LTM) | 300.2 |
| EV/EBITDA (LTM) | 93.8 |
| P/B | 13.90 |
| Net debt / EBITDA (LTM) | -0.15 |
| Operating cash flow (LTM) | 14.7 bn |
| ROE | 5.2% |
| EV/EBITDA, 3-year average | 111.8 |
Bottom line
Tesla, Inc. showed strong revenue and EBITDA growth in Q2 2026, but operating profit fell to a minimum and net margin compressed. Capital expenditures nearly doubled, exceeding operating cash flow, leading to negative free cash flow. Valuation remains extremely high: P/E of 300.2 and EV/EBITDA of 93.8, though the latter is below its own three-year average. According to the portal's model, upside is only +12%, which does not compensate for the risks. The share looks unattractive at the current price unless the company restores operating profitability and slows investment pace.
Open the company's financial profile TSLA →
See also: market overview · valuation map · stock screeners