TEXAS INSTRUMENTS INC: revenue accelerated to +22.8%, yet shares lost 11.3% after the report

22 июля TEXAS INSTRUMENTS INC раскрыла результаты за второй квартал 2026 года: выручка выросла на 22,8% год к году, до 5 463 млн долл., EBITDA – на 45,7%, чистая прибыль – на 52,9%. Маржа EBITDA достигла 53,9% против 45,5% годом ранее. Несмотря на сильные цифры, акции после публикации подешевели на 11,3% – рынок, видимо, счёл оценку чрезмерной: бумага торгуется на уровне 38,7 прибыли за последние 12 месяцев, что заметно выше собственного трёхлетнего среднего мультипликатора EV/EBITDA. При текущей цене акция выглядит скорее привлекательной, но лишь при условии сохранения двузначных темпов роста и маржинальности.
Key takeaways
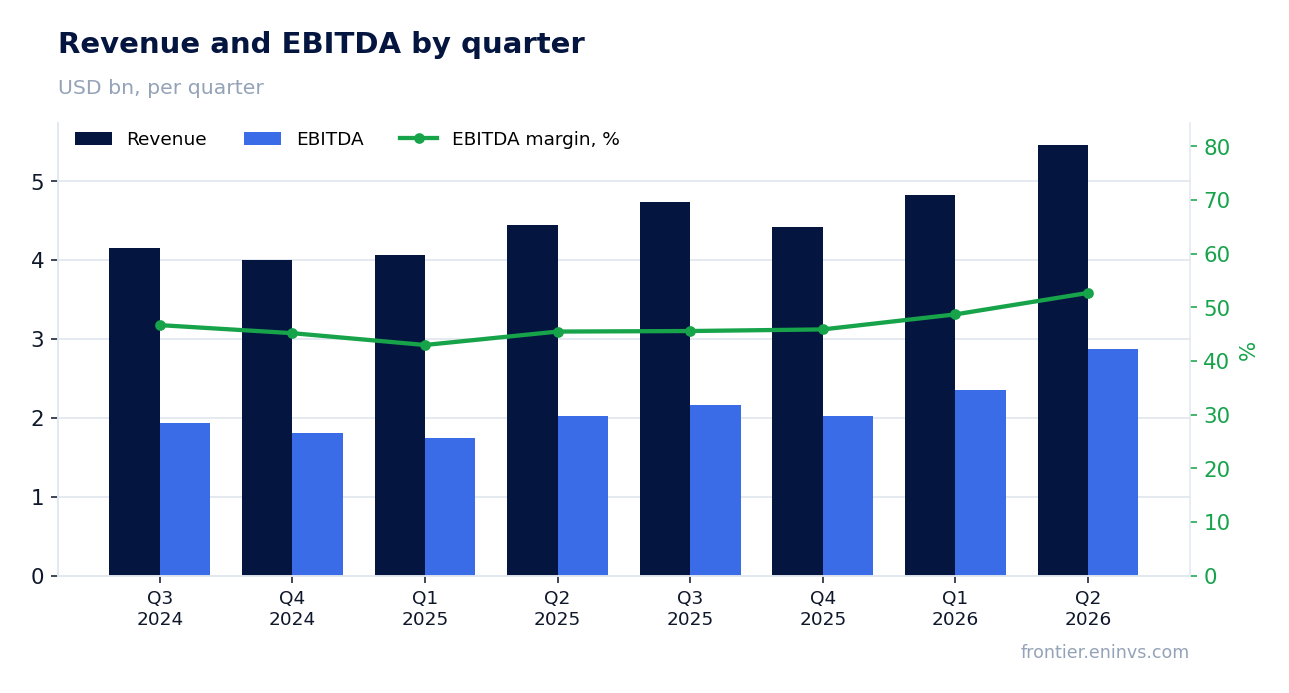
— Q2 2026 revenue grew 22.8% – the fastest in the last five quarters
— EBITDA margin reached 53.9% – 8.4 pp higher than a year ago, driven by revenue growth and operating leverage
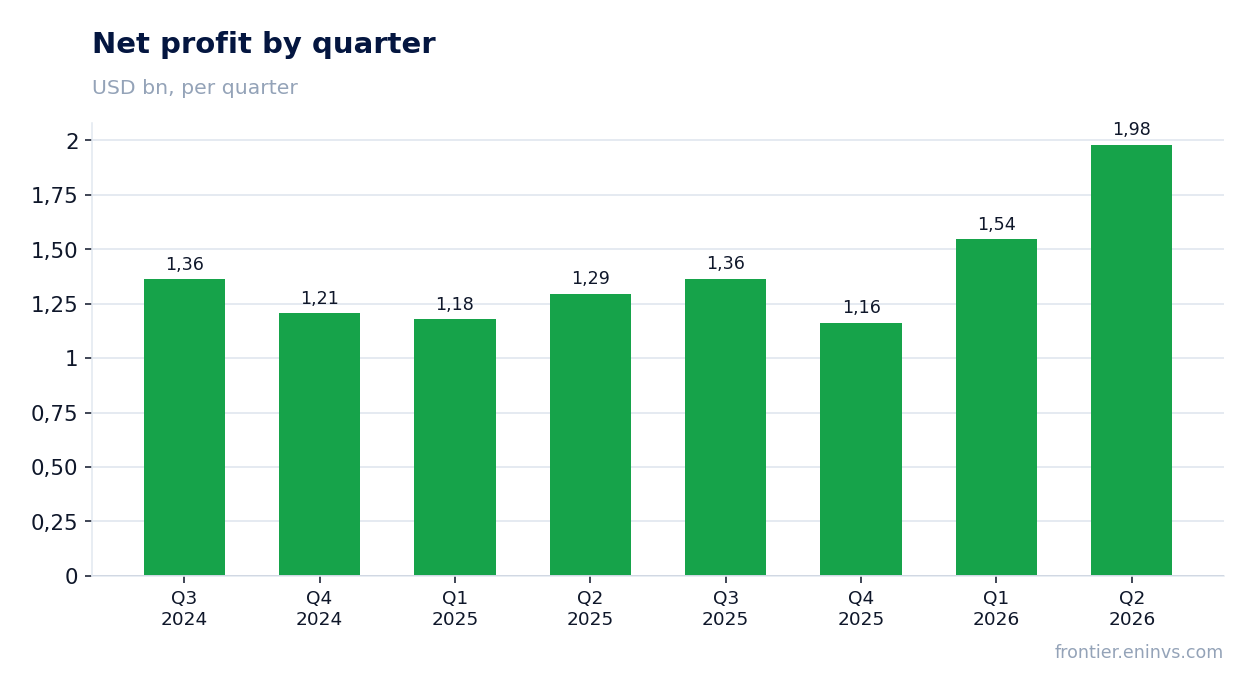
— Net profit rose 52.9% – faster than revenue, as operating profit jumped 48%
— Quarterly operating cash flow was $2,703 million, capex only $514 million – free cash flow reached $2,738 million
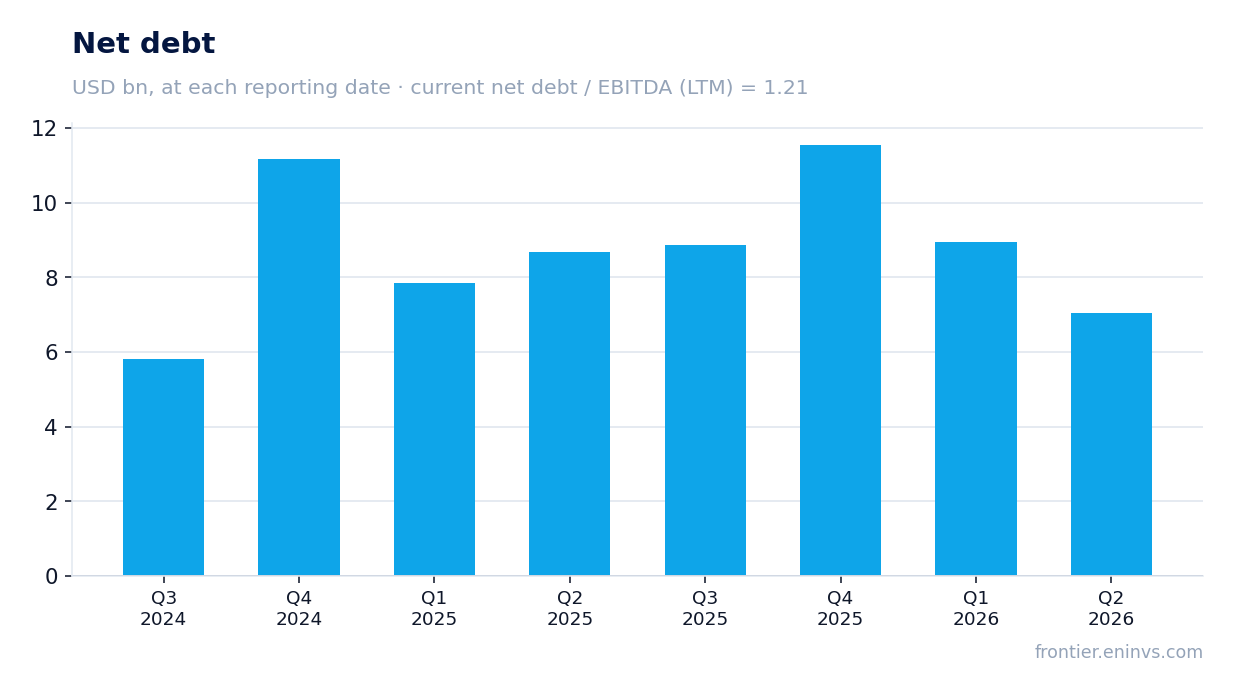
— Net debt fell to $7,051 million – the company generates enough cash to reduce debt and pay dividends
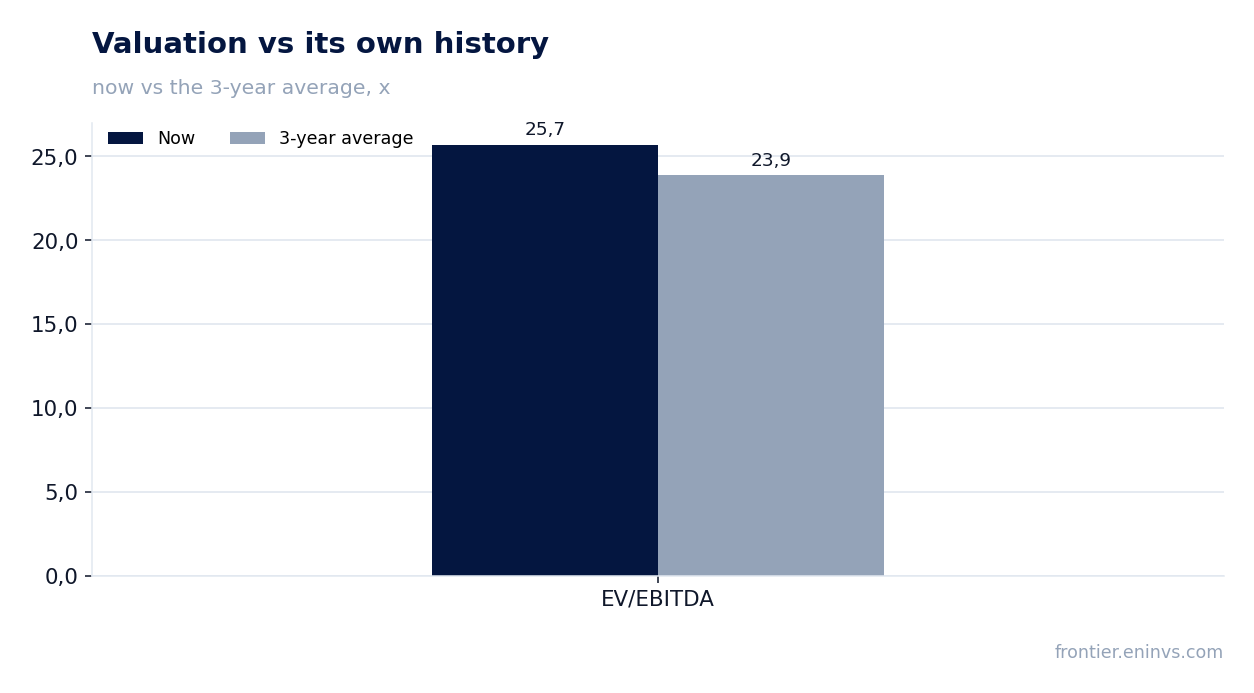
— Shares fell 11.3% after the report – the market is concerned about valuation: P/E LTM 38.7 vs. 3-year average EV/EBITDA of 23.9
— The portal's model sees +24% upside – above the current price, making the stock attractive
Attractiveness
Key figures, USD bn
| Metric | Q2 2025 | Q2 2026 | Change |
|---|---|---|---|
| Revenue | 4.45 | 5.46 | +22.8% |
| EBITDA | 2.02 | 2.95 | +45.7% |
| Operating profit | 1.56 | 2.31 | +47.8% |
| Net profit | 1.29 | 1.98 | +52.9% |
| Operating cash flow | 1.86 | 2.70 | +45.3% |
| Capex | 1.30 | 0.51 | -60.6% |
| EBITDA margin | 45.5% | 53.9% | +8.4 pp |
| Net margin | 29.1% | 36.2% | +7.1 pp |
Q2 2026 revenue grew 22.8% – the fastest in the last five quarters
In Q2 2026, TEXAS INSTRUMENTS INC revenue reached $5,463 million, up 22.8% year-over-year. This is an acceleration from previous quarters: Q1 2026 growth was 18.6%, Q4 2025 – 10.4%. The company attributes the momentum to broad demand growth, led by industrial, data center, and automotive.
Sequential dynamics are also impressive: revenue rose 13% from $4,825 million in Q1 to $5,463 million in Q2. This is the highest quarterly level in the period under review, confirming the sustainability of the upward trend.
EBITDA margin reached 53.9% – 8.4 pp higher than a year ago, driven by revenue growth and operating leverage
EBITDA for Q2 2026 was $2,878 million, up 45.7% year-over-year. EBITDA margin reached 53.9% versus 45.5% in Q2 2025. The margin expansion is explained by revenue growing faster than operating costs: cost of revenue rose only 12.7% (from $1,873 to $2,111 million), while revenue grew 22.8%.
Operating profit rose 48% to $2,310 million, also reflecting operating leverage. The report mentions acquisition charges of $17 million, which slightly reduced operating profit but did not change the overall picture.
Net profit rose 52.9% – faster than revenue, as operating profit jumped 48%
Net profit for Q2 2026 was $1,980 million, up 52.9% year-over-year. Growth was even faster than operating profit, thanks to a positive balance of other income and expenses: Other income (expense), net was $69 million versus $48 million a year ago.
The effective tax rate declined: provision for income taxes was $258 million versus $183 million a year ago, but as a percentage of pre-tax income it was 11.5% versus 12.4%. The report notes discrete tax benefits of $51 million, which supported net profit.
Quarterly operating cash flow was $2,703 million, capex only $514 million – free cash flow reached $2,738 million
In Q2 2026, operating cash flow was $2,703 million, up 45% year-over-year ($1,860 million). Capital expenditures more than halved – from $1,305 to $514 million, reflecting the completion of major investment projects. As a result, free cash flow (operating cash flow minus capex plus CHIPS Act proceeds) reached $2,738 million – almost ten times higher than a year ago.
Over the trailing twelve months, free cash flow was $6,534 million, or 33.6% of revenue. This is a high figure that allows the company to fund dividends and reduce debt. In the quarter, the company paid dividends of $1,295 million and spent only $27 million on share repurchases – the main shareholder return is through dividends.
Net debt fell to $7,051 million – the company generates enough cash to reduce debt and pay dividends
At the end of Q2 2026, TEXAS INSTRUMENTS INC net debt was $7,051 million, down $1.9 billion from the previous reporting date ($8,947 million). Over the last 12 months, debt decreased by $1.6 billion. The net debt to EBITDA ratio over the trailing twelve months is 1.21 – a moderate level for a company with a stable cash flow.
Debt reduction is happening against the backdrop of strong operating generation: over the trailing twelve months, operating cash flow was $7,200 million (per LTM data), which comfortably covers dividends and capital expenditures. The company also received $549 million under the CHIPS Act program in the quarter, further supporting liquidity.
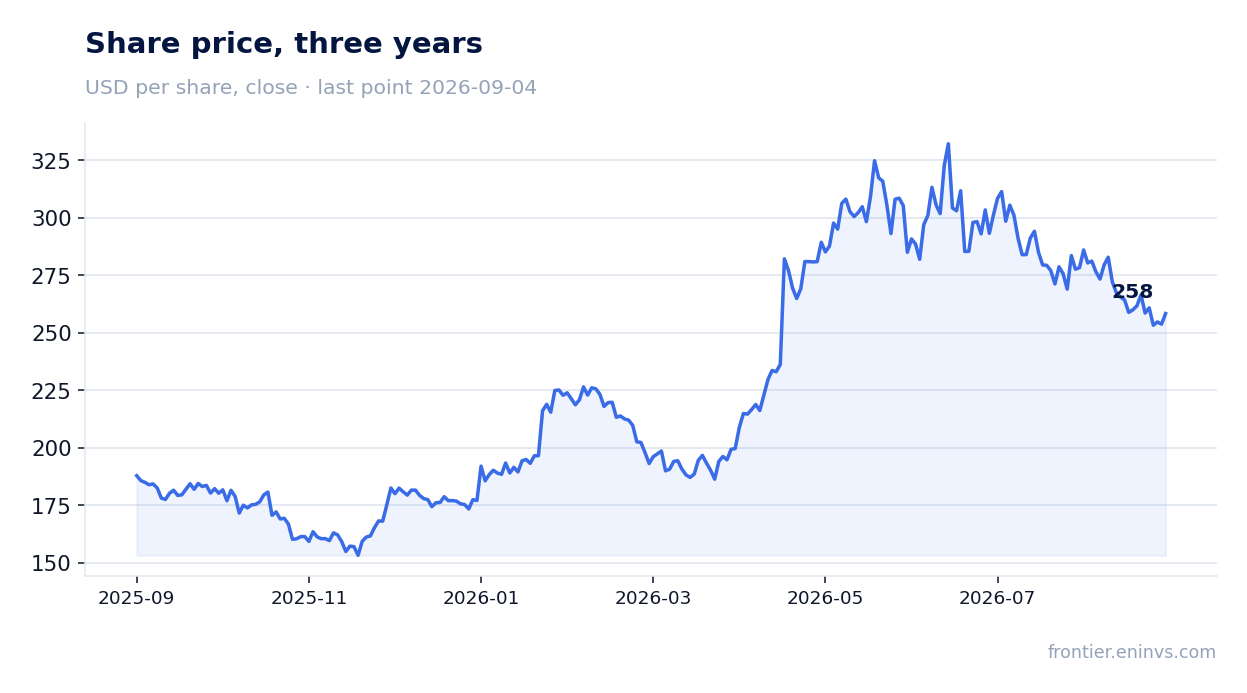
Shares fell 11.3% after the report – the market is concerned about valuation: P/E LTM 38.7 vs. 3-year average EV/EBITDA of 23.9
The share price before the release was $291.30; on the release day the stock rose 1%, but from the release to September 4, 2026, it fell 11.3%. Such a reaction looks paradoxical given the strong results, but is explained by the high valuation: P/E LTM is 38.7, and EV/EBITDA LTM is 25.7.
For comparison, the three-year average EV/EBITDA is 23.9. The current multiple is 7.6% above its own history, making the stock vulnerable to a correction even if operating metrics remain strong. The market is likely pricing in expectations of slowing growth or margin contraction in the future.
The portal's model sees +24% upside – above the current price, making the stock attractive
According to the portal's model, based on EBITDA growth and a target multiple, the upside potential of TEXAS INSTRUMENTS INC shares is +24% to the current market price. This means the model values the fair price above current quotes, despite high market multiples.
The model takes into account not only current profitability but also expected EBITDA growth, which accelerated to 45.7% year-over-year in Q2 2026. If the company maintains such growth rates, the current valuation may prove justified, and the shares have room to rise.
Valuation on the latest reported figures
| Metric | Value |
|---|---|
| Market cap | 234 bn USD |
| P/E (LTM) | 38.7 |
| EV/EBITDA (LTM) | 25.7 |
| P/B | 14.40 |
| Net debt / EBITDA (LTM) | 1.21 |
| Operating cash flow (LTM) | 7.20 bn |
| ROE | 45.5% |
| Dividend yield (12m) | 2.2% |
| EV/EBITDA, 3-year average | 23.9 |
Bottom line
TEXAS INSTRUMENTS INC's Q2 2026 report was strong across all operating metrics: revenue accelerated to +22.8%, EBITDA margin reached 53.9%, and free cash flow grew almost tenfold thanks to a sharp reduction in capital expenditures. The company is reducing debt and increasing dividends, indicating financial stability. However, the market punished the stock with an 11.3% decline after the release, and this is understandable: multiples are above the company's own three-year history, and investors fear the growth peak has passed. According to the portal's model, the shares have +24% upside, making them rather attractive provided current growth rates and margins are maintained. The key question for a holder is whether the company can sustain double-digit growth in H2, when the comparison base becomes higher.
Open the company's financial profile TXN →
See also: market overview · valuation map · stock screeners