Uber Technologies, Inc: revenue growth slowed to 12.2%, but EBITDA margin rose to 14.6% — and this is not the limit
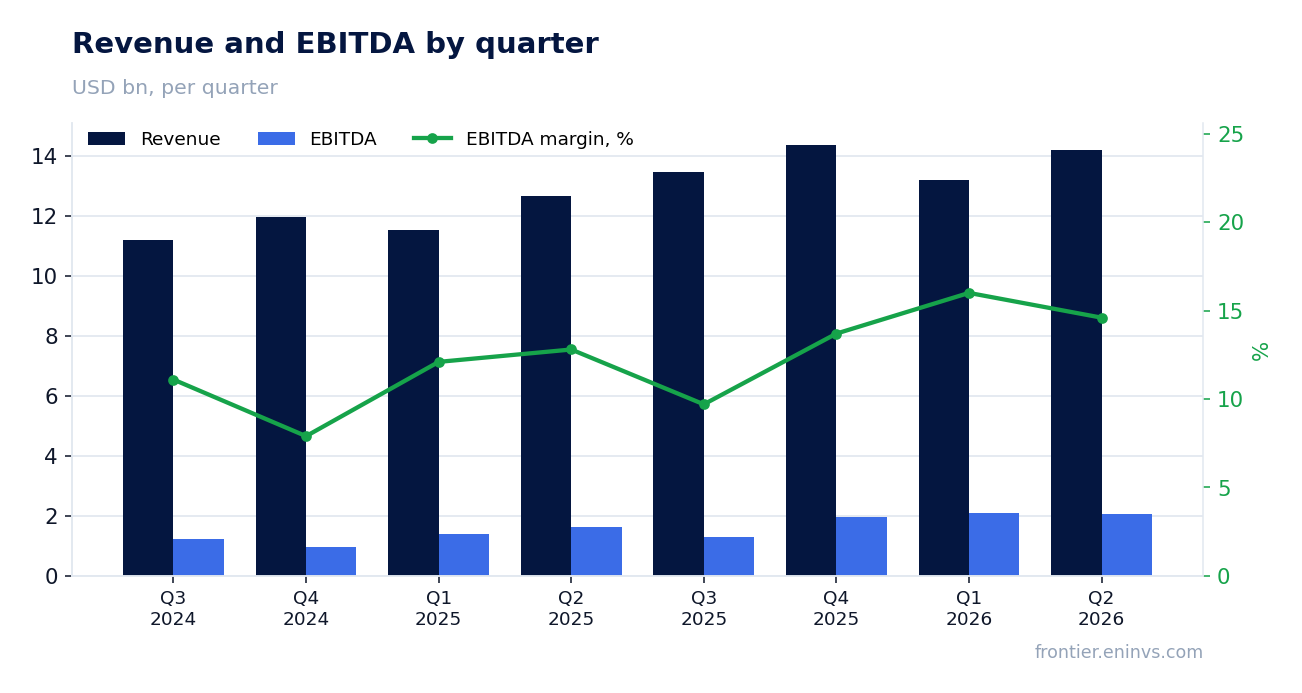
On August 5, 2026, Uber Technologies, Inc reported results for the second quarter of 2026. Revenue grew 12.2% YoY to $14.2 billion, adjusted EBITDA rose 27.9% to $2.1 billion, and net profit increased 76.7% to $2.4 billion. At the current price, the shares look attractive: the EV/EBITDA multiple (21.8x) is well below its own three-year average (46.1x), and the portal's model implies upside of +18%.
Key takeaways
— Revenue growth slowed to +12.2%, but 18% trip growth and EBITDA margin expansion to 14.6% offset this
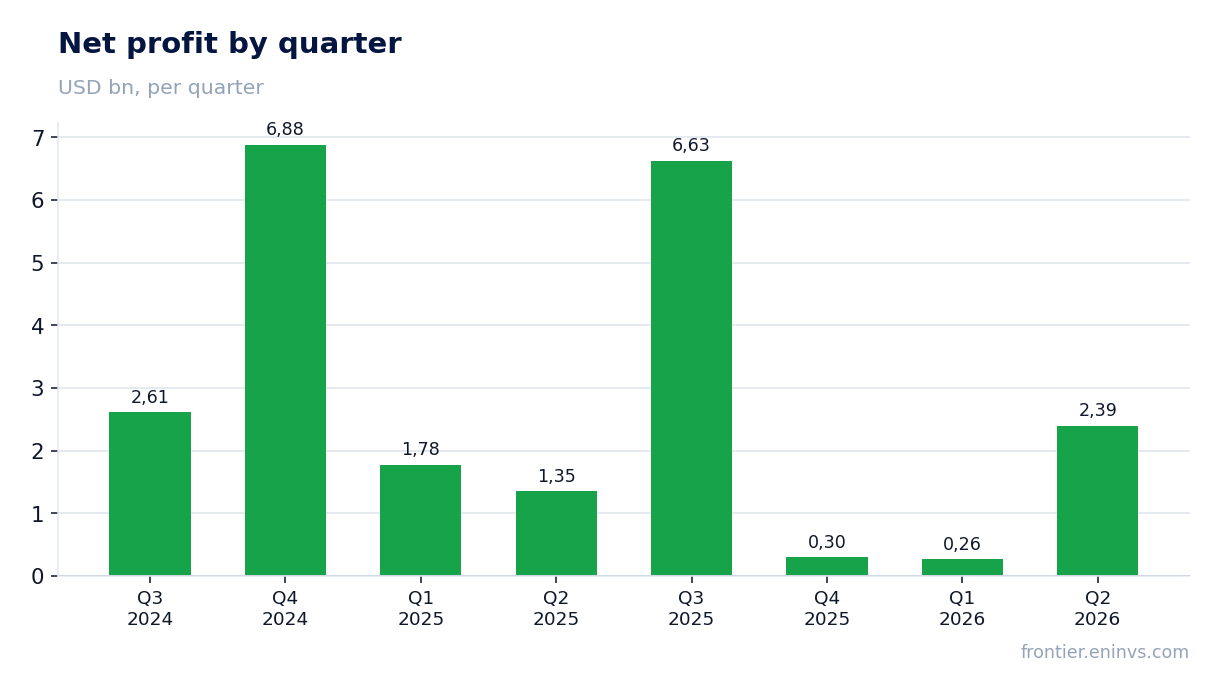
— Net profit rose 76.7% thanks to a one-off $1.6 billion revaluation of equity investments
— Operating cash flow for the quarter was $2.9 billion, free cash flow — $2.8 billion
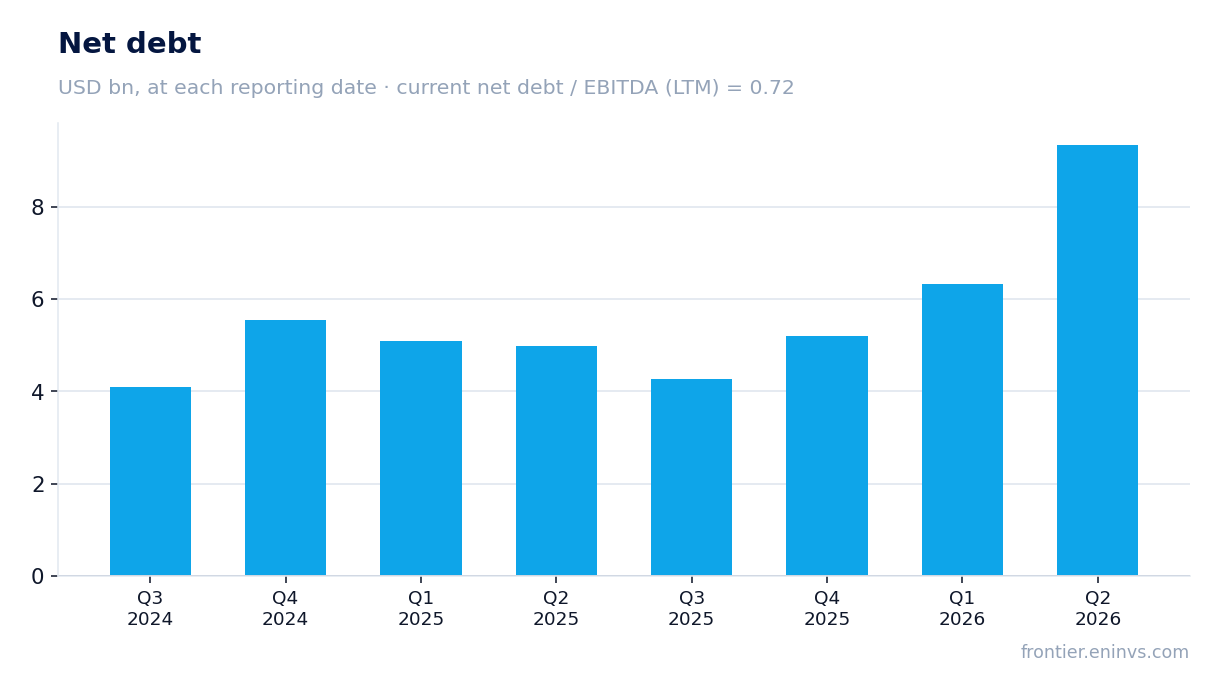
— Debt burden: net debt of $5.2 billion, ratio to EBITDA over 12 months — 0.72
— Shares trade at a discount to their own history: EV/EBITDA 21.8x versus 46.1x three-year average
— The portal's model implies +18% upside from the current price
Attractiveness
Key figures, USD bn
| Metric | Q2 2025 | Q2 2026 | Change |
|---|---|---|---|
| Revenue | 12.7 | 14.2 | +12.2% |
| EBITDA | 1.62 | 2.08 | +27.9% |
| Operating profit | 1.45 | 1.89 | +30.3% |
| Net profit | 1.35 | 2.39 | +76.7% |
| Operating cash flow | 2.56 | 2.86 | +11.6% |
| Capex | 0.09 | 0.07 | -21.3% |
| EBITDA margin | 12.8% | 14.6% | +1.8 pp |
| Net margin | 10.7% | 16.9% | +6.2 pp |
Revenue growth slowed to +12.2%, but 18% trip growth and EBITDA margin expansion to 14.6% offset this
In Q2 2026, Uber Technologies, Inc revenue reached $14.2 billion, up 12.2% YoY. The slowdown compared to previous quarters (Q1 2026: +14.5%, Q4 2025: +20.1%) is explained by business model changes, which the company says negatively impacted revenue growth by 8 percentage points. Excluding this effect, dynamics would have been much stronger.
Key operating metrics remain robust: trips grew 18% YoY to 3.9 billion, monthly active platform consumers (MAPCs) rose 16% to 208 million. Gross Bookings grew 24% in dollar terms and 22% in constant currency. EBITDA margin expanded from 12.8% to 14.6% — the company is converting platform growth into profit faster than revenue grows.
The Mobility segment generated $7.4 billion in revenue (+1% YoY), Delivery — $5.2 billion (+28%), Freight — $1.6 billion (+26%). The main drag on Mobility growth comes from accounting model changes, while the segment's operational metrics, judging by 22% bookings growth, remain healthy.
Net profit rose 76.7% thanks to a one-off $1.6 billion revaluation of equity investments
Net profit in Q2 2026 was $2.4 billion versus $1.4 billion a year earlier (+76.7%). However, a significant part of this is a one-off effect: the company recorded a net benefit of $1.6 billion (pre-tax) from revaluations of its equity investments. Excluding this factor, profit would have been noticeably lower.
GAAP operating profit rose 30% to $1.9 billion, reflecting the real business dynamics. Adjusted EBITDA increased 27.9% to $2.1 billion, and Non-GAAP operating income grew 40% to $2.1 billion. The difference between GAAP and Non-GAAP figures is mainly due to amortization of acquired intangibles and one-off items.
The one-off nature of the revaluation is important when assessing earnings quality: sustainable growth is driven by operating results, not investment income.
Operating cash flow for the quarter was $2.9 billion, free cash flow — $2.8 billion
In Q2 2026, Uber Technologies, Inc operating cash flow was $2.9 billion, up 12% YoY. Capital expenditures were modest at $70 million, so free cash flow reached $2.8 billion. Over the trailing twelve months, free cash flow exceeded $10 billion for the first time, as the company reported.
Cash generation remains stable: over the last four quarters, operating cash flow totaled $10.1 billion. This gives the company the ability to fund investments in new areas, including an autonomous vehicle platform, and continue share buybacks — $518 million was spent on this in Q2.
Debt burden: net debt of $5.2 billion, ratio to EBITDA over 12 months — 0.72
At the end of Q2 2026, Uber Technologies, Inc net debt was $5.2 billion. The ratio of net debt to EBITDA over the trailing twelve months is 0.72, a moderate level for a company with such cash generation. During the quarter, net debt increased by $3.0 billion, over the year by $4.4 billion, related to credit draws and share buybacks.
The company retains access to capital markets: the report shows $4.0 billion raised in loans and $2.0 billion repaid. Interest expense for the quarter was $127 million, covered by interest income of $172 million. The debt level does not constrain business development.
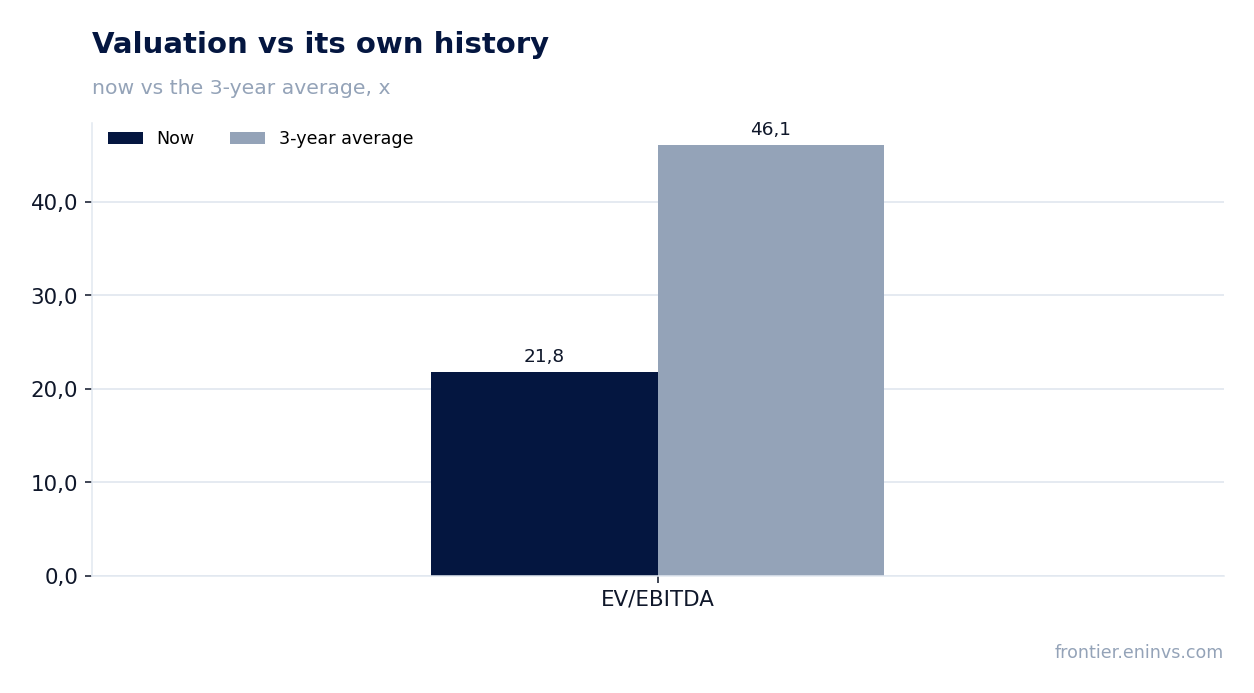
Shares trade at a discount to their own history: EV/EBITDA 21.8x versus 46.1x three-year average
Uber Technologies, Inc current EV/EBITDA multiple is 21.8x, well below the three-year average of 46.1x. This means the market values the company cheaper than its own history, despite sustained revenue growth and margin expansion.
P/E LTM is 16.0x, which also looks moderate for a company with 36.8% return on equity. Market capitalization is $153.2 billion. The multiple compression may reflect both a broader cooling toward tech stocks and concerns about slowing revenue growth.
However, operating metrics — 18% trip growth, margin expansion — indicate the business continues to develop at a high pace. If the company maintains current dynamics, the discount to its own history looks unjustified.
The portal's model implies +18% upside from the current price
According to the portal's fundamental valuation model, based on EBITDA growth and a target multiple, the fair value of Uber Technologies, Inc shares is 18% above the current market price. This implies that if current profit growth rates persist and the multiple normalizes, the shares have upside potential.
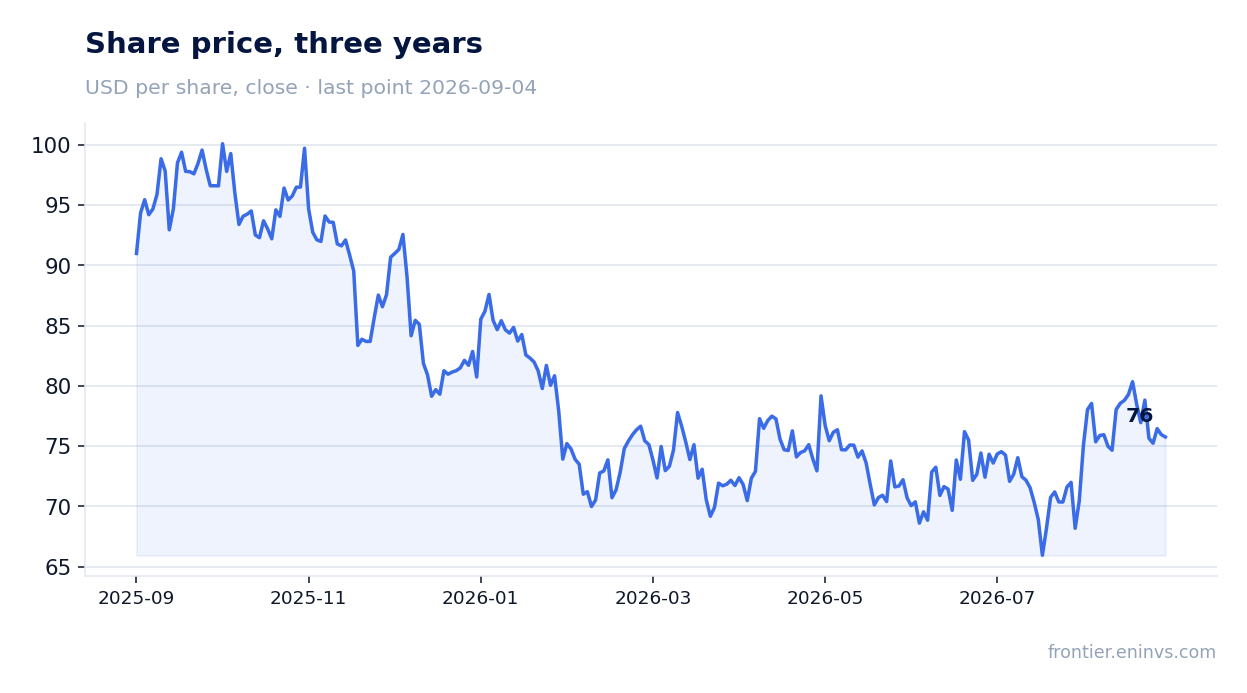
The company's shares are held in the portal's 'US GARP' and 'acceleration' strategies, reflecting their fit with growth-at-reasonable-price criteria. After the report, shares fell 5.3% on the release day but gained 5.2% by September 4 — the market is gradually reassessing the results.
Valuation on the latest reported figures
| Metric | Value |
|---|---|
| Market cap | 153 bn USD |
| P/E (LTM) | 16.0 |
| EV/EBITDA (LTM) | 21.8 |
| P/B | 5.67 |
| Net debt / EBITDA (LTM) | 0.72 |
| Operating cash flow (LTM) | 10.1 bn |
| ROE | 36.8% |
| EV/EBITDA, 3-year average | 46.1 |
Bottom line
Uber Technologies, Inc Q2 2026 report shows strong operating results: 18% trip growth, EBITDA margin expansion to 14.6%, and solid cash generation. Net profit includes a one-off investment revaluation, but operating profit rose 30%, confirming business sustainability. Shares trade at a discount to their own history (EV/EBITDA 21.8x versus 46.1x three-year average), and the portal's model implies +18% upside. If current growth and margin trends persist, the shares look attractive. The key risk is further revenue slowdown, which should be watched in the next report.
Open the company's financial profile UBER →
See also: market overview · valuation map · stock screeners