UNITEDHEALTH GROUP INC: Q2 profit up 61%, but revenue barely grows
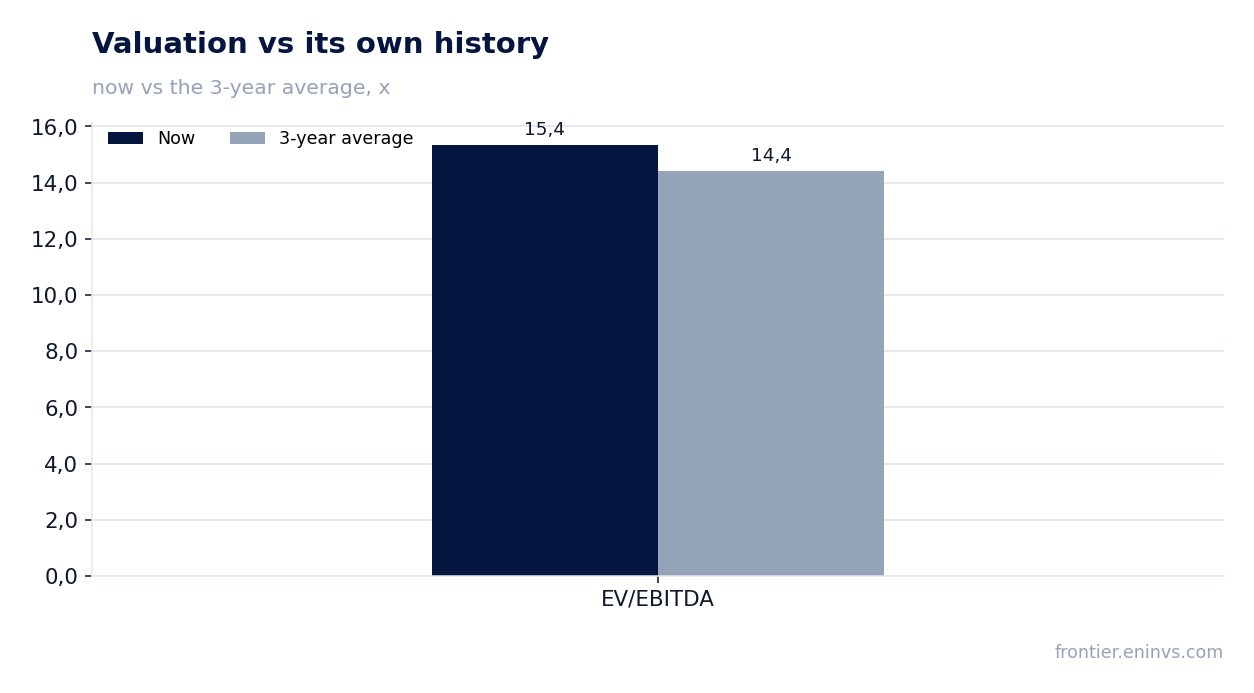
16 июля UNITEDHEALTH GROUP INC раскрыла результаты за второй квартал 2026 года: выручка выросла всего на 0,4% до 112,0 млрд долл., зато чистая прибыль подскочила на 61% до 5,5 млрд долл. благодаря резкому улучшению маржинальности. Акции после отчёта подешевели на 5,1%, и при текущей цене они выглядят скорее привлекательно: компания торгуется с мультипликатором EV/EBITDA 15,4x против среднего за три года 14,4x, а модель портала даёт потенциал роста +34%.
Key takeaways
— Revenue barely grew: +0.4% in Q2 2026
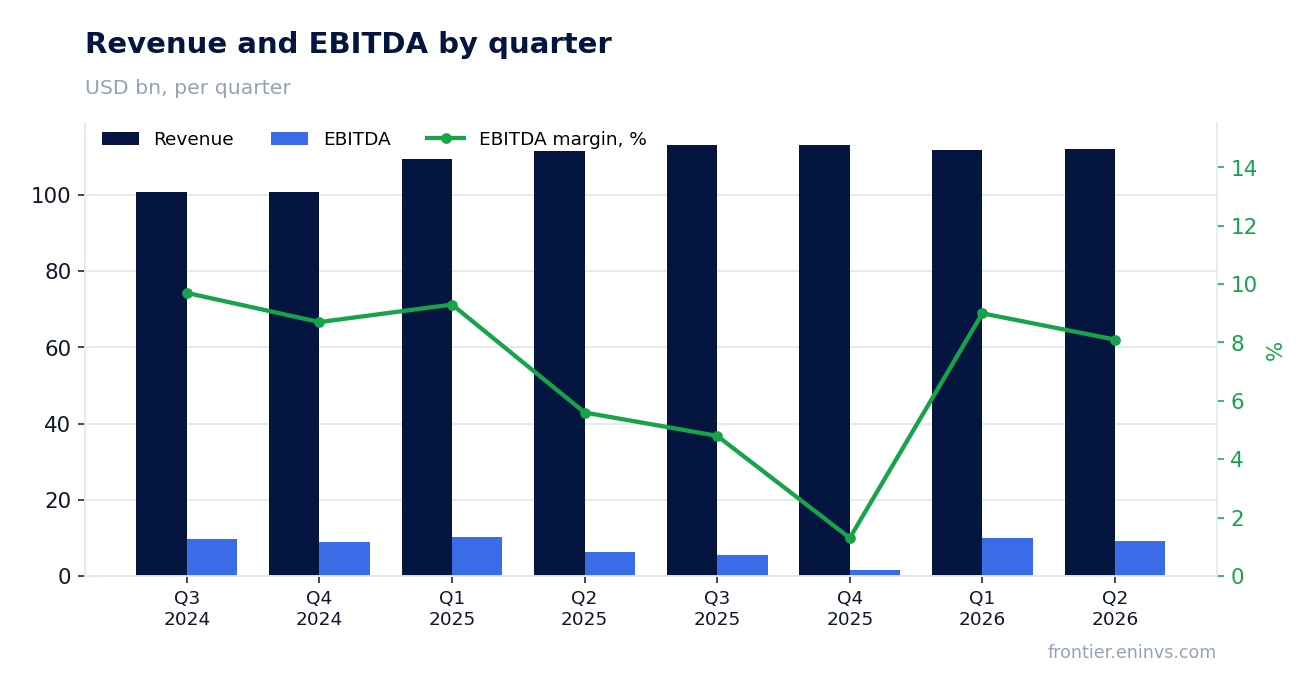
— EBITDA margin expanded from 5.6% to 8.1% on lower medical costs
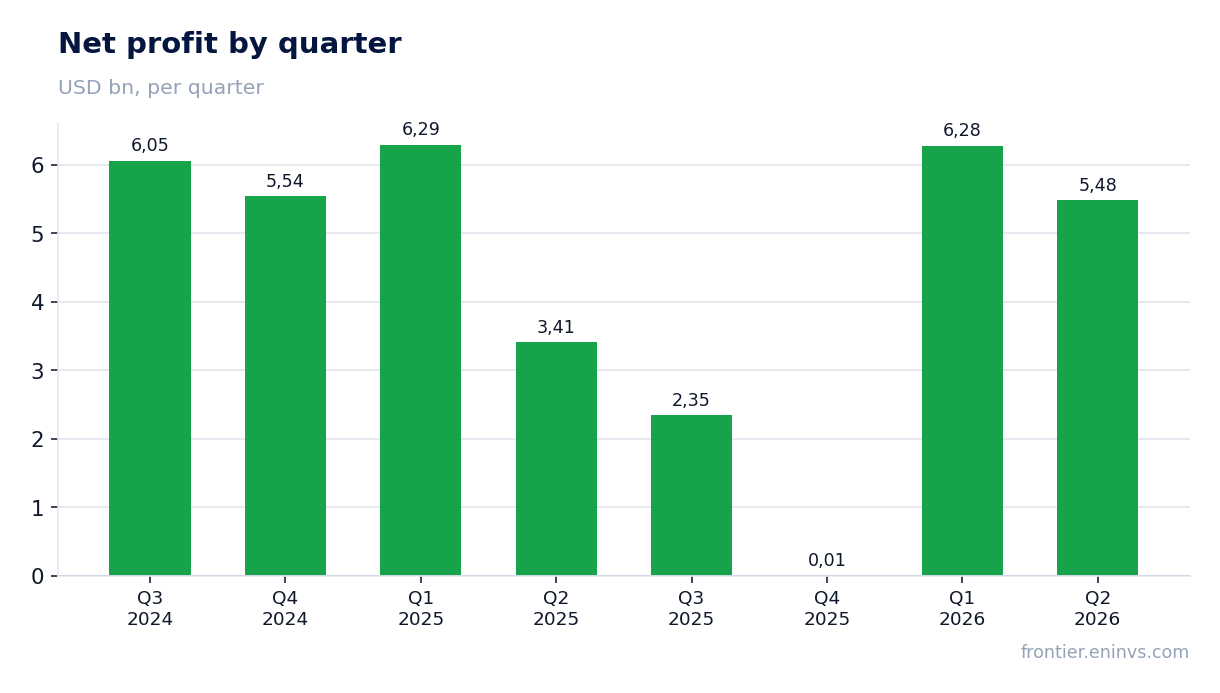
— Net profit jumped 61% on operating leverage and a lower tax rate
— Operating cash flow of $11.1 billion, or 1.9x net income
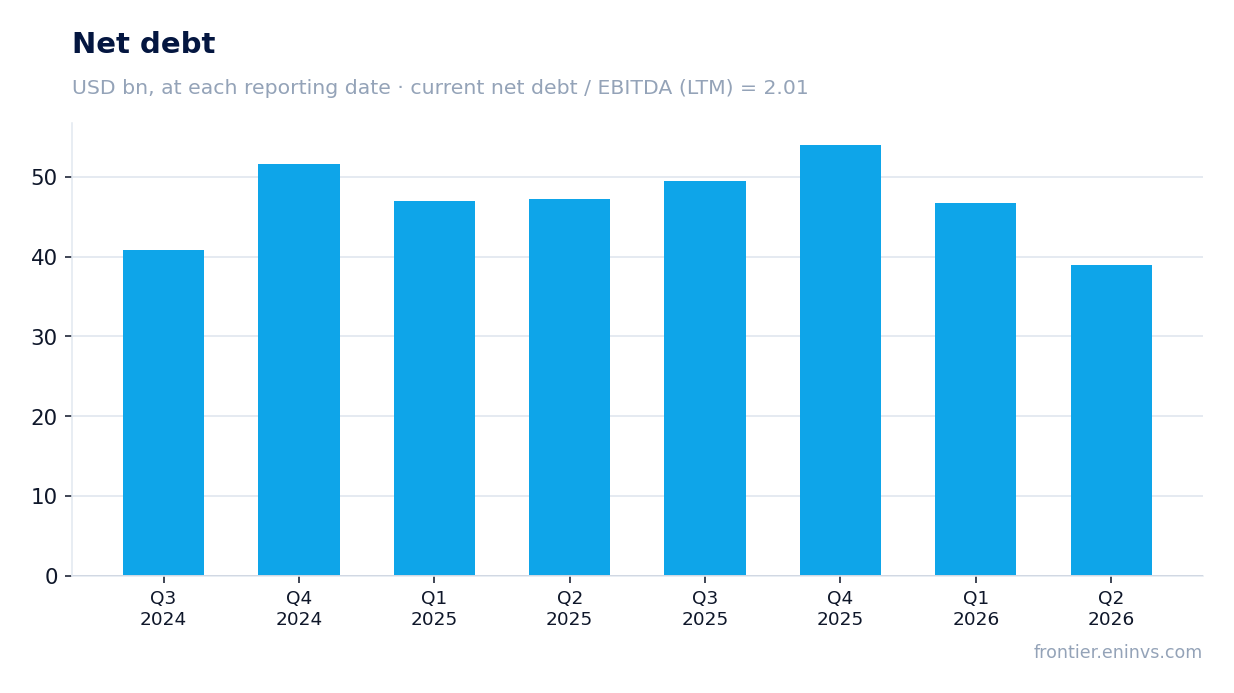
— Leverage: net debt / EBITDA LTM at 2.01x
— Company raised 2026 adjusted EPS guidance to $19.50–$20.00
— Shares trade at a premium to their own 3-year history, but the portal model sees +34%
Attractiveness
Key figures, USD bn
| Metric | Q2 2025 | Q2 2026 | Change |
|---|---|---|---|
| Revenue | 112 | 112 | +0.4% |
| EBITDA | 6.23 | 9.03 | +44.9% |
| Operating profit | 5.15 | 7.99 | +55.2% |
| Net profit | 3.41 | 5.48 | +61.0% |
| Operating cash flow | 7.19 | 11.1 | +54.4% |
| Capex | 0.89 | 0.80 | -9.8% |
| EBITDA margin | 5.6% | 8.1% | +2.5 pp |
| Net margin | 3.1% | 4.9% | +1.8 pp |
1. Revenue barely grew: +0.4% in Q2 2026
In Q2 2026, UNITEDHEALTH GROUP INC revenue reached $112.0 billion, up just 0.4% year-over-year. Growth slowed from +12.9% in Q2 2025 to nearly zero — the weakest pace in years.
The main drag came from shrinking membership: UnitedHealthcare served 525,000 fewer consumers in the quarter, especially in Medicare Advantage (–965,000 since year-end) and Medicaid. UnitedHealthcare revenue fell 0.1% to $86.0 billion, while Optum Health revenue dropped 5% on ~700,000 fewer value-based-care patients.
2. EBITDA margin expanded from 5.6% to 8.1% on lower medical costs
EBITDA in Q2 2026 reached $9.0 billion versus $6.2 billion a year earlier, with the EBITDA margin up from 5.6% to 8.1%. The key driver was lower medical costs: the medical care ratio improved from 89.4% to 86.7% on benefit design changes, pricing discipline, and medical cost management.
Operating profit rose from $5.2 billion to $8.0 billion, lifting the operating margin from 4.6% to 7.1%. At UnitedHealthcare, the operating margin doubled from 2.4% to 4.6%; at Optum, it expanded from 4.6% to 6.2%.
3. Net profit jumped 61% on operating leverage and a lower tax rate
Net profit attributable to UNITEDHEALTH GROUP INC shareholders in Q2 2026 was $5.5 billion versus $3.4 billion a year earlier — up 61%. EPS rose from $3.74 to $6.04.
The growth came not only from operating leverage: the effective tax rate fell from 12.5% to 18.6% (Q2 2025 had an abnormally low rate due to one-offs), adding roughly $0.4 billion to net profit. The quarter also included a $61 million loss on the sale of a subsidiary, which was immaterial.
4. Operating cash flow of $11.1 billion, or 1.9x net income
Operating cash flow in Q2 2026 reached $11.1 billion, or 1.9x net income. The company attributes this to strong earnings, disciplined working capital management, and a substantial government payment.
Capex for the quarter was just $0.8 billion, typical for an insurance business. Free cash flow of roughly $10.3 billion in the quarter comfortably covers dividends ($4.1 billion paid in H1) and share buybacks ($1.6 billion in H1).
5. Leverage: net debt / EBITDA LTM at 2.01x
At the end of Q2 2026, UNITEDHEALTH GROUP INC net debt stood at $54.0 billion, with net debt / EBITDA over the trailing twelve months at 2.01x. This is a moderate level for an A-rated company with stable cash flow.
Net debt fell by $7.7 billion in the quarter on strong operating cash flow and lower debt. The company reaffirmed its target debt-to-capital ratio of about 40% by year-end; it stood at 41.2% as of June 30, 2026.
6. Company raised 2026 adjusted EPS guidance to $19.50–$20.00
Along with the report, UNITEDHEALTH GROUP INC raised its 2026 adjusted EPS guidance from 'above $17.75' to a range of $19.50–$20.00. Operating profit guidance was lifted from 'above $24.0 billion' to 'above $25.45 billion', and operating cash flow from 'above $18 billion' to roughly $24 billion.
The upgrade reflects strong H1 results and improved expectations for H2. The company also plans to repurchase at least $5 billion of shares this year (already $4 billion by mid-July).
7. Shares trade at a premium to their own 3-year history, but the portal model sees +34%
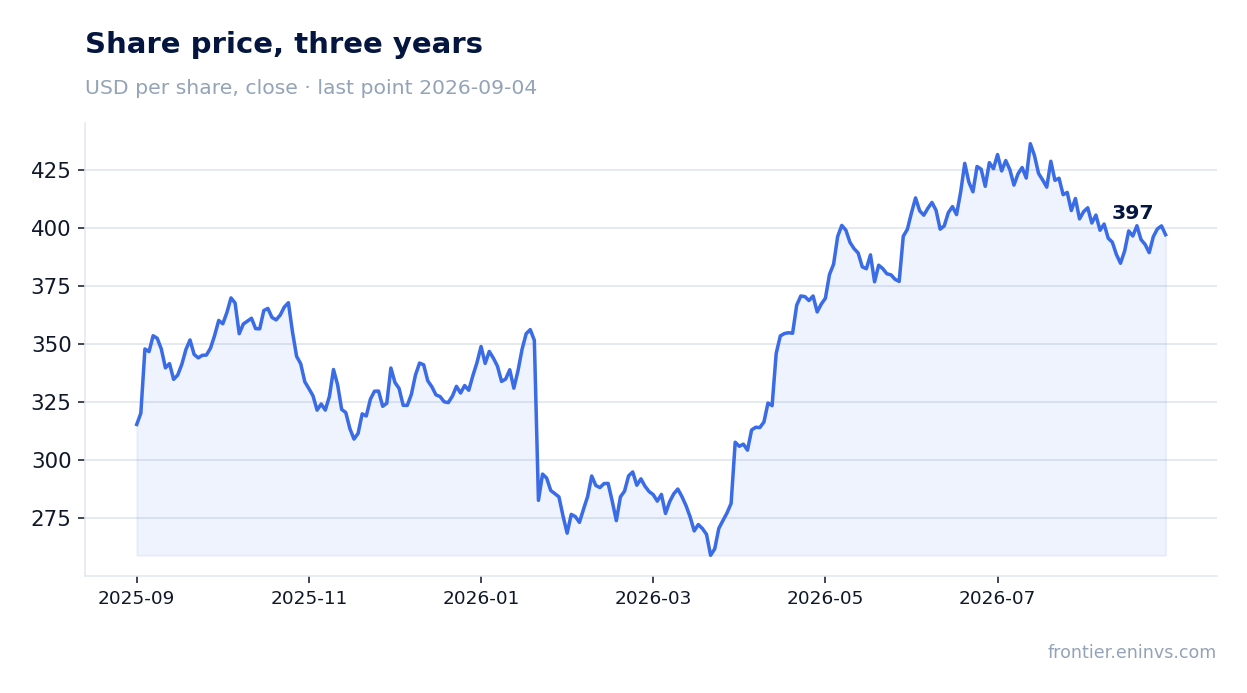
After the report, UNITEDHEALTH GROUP INC shares rose 1.2% on the release day but lost 5.1% from that level by September 4, 2026. Current market cap is $359.6 billion, P/E LTM is 25.5x, EV/EBITDA LTM is 15.4x versus the 3-year average of 14.4x.
Thus, the market values the company slightly above its own history. However, the portal's model, based on EBITDA growth times a target multiple, puts the upside to fair value at +34%. The stock is held in the US Leaders (FVC quality) strategy on the portal.
Valuation on the latest reported figures
| Metric | Value |
|---|---|
| Market cap | 360 bn USD |
| P/E (LTM) | 25.5 |
| EV/EBITDA (LTM) | 15.4 |
| P/B | 3.59 |
| Net debt / EBITDA (LTM) | 2.01 |
| Operating cash flow (LTM) | 19.7 bn |
| ROE | 21.1% |
| Dividend yield (12m) | 2.3% |
| EV/EBITDA, 3-year average | 14.4 |
Bottom line
Q2 2026 results showed an impressive recovery in profitability: EBITDA margin expanded from 5.6% to 8.1%, net profit rose 61%, and cash flow reached 1.9x net income. The company raised its full-year guidance, confirming the trend's durability. However, revenue is barely growing, and all profit growth came from lower medical costs and a low tax base. At the current price, shares trade at a slight premium to their own history, but the portal model sees +34% upside. Verdict — rather attractive: if the company stabilizes membership, the model's undervaluation could materialize.
Open the company's financial profile UNH →
See also: market overview · valuation map · stock screeners