Vertiv Holdings Co: revenue up 24% and guidance raised, but shares fell 17%

29 июля Vertiv Holdings Co раскрыла результаты за второй квартал 2026 года. Выручка выросла на 24,1% до 3 274,3 млн долл., EBITDA – на 46,2% до 753,7 млн долл., чистая прибыль – на 53,5% до 497,8 млн долл. Несмотря на сильные цифры и повышение годового прогноза, акции в день публикации упали на 17,3%. На наш взгляд, при текущей цене бумага выглядит скорее привлекательно: рост ускоряется, маржинальность расширяется, долг минимален, а оценка, хотя и выше собственной трехлетней истории, отражает высокие ожидания, которые компания пока оправдывает.
Key takeaways
— Revenue in Q2 grew 24.1% to $3,274.3 million, with organic growth of 17.8%
— EBITDA margin expanded by 3.5 pp to 23.0% on operational efficiency and favorable price-cost
— Net profit rose 53.5% to $497.8 million, with one-off items adding about $100 million
— Operating cash flow reached $1,099.8 million, and the company achieved a net cash position
— The company raised its 2026 guidance: revenue of $14,000 million and adjusted EPS of $6.70
— Shares fell 17.3% on the release day but have since recovered 4.1%
— The portal's model implies 16% upside to the current price
Attractiveness
Key figures, USD bn
| Metric | Q2 2025 | Q2 2026 | Change |
|---|---|---|---|
| Revenue | 2.64 | 3.27 | +24.1% |
| EBITDA | 0.52 | 0.75 | +46.2% |
| Operating profit | 0.44 | 0.64 | +44.2% |
| Net profit | 0.32 | 0.50 | +53.5% |
| Operating cash flow | 0.32 | 1.10 | +240.6% |
| Capex | 0.04 | 0.17 | +287.8% |
| EBITDA margin | 19.5% | 23.0% | +3.5 pp |
| Net margin | 12.3% | 15.2% | +2.9 pp |
Revenue in Q2 grew 24.1% to $3,274.3 million, with organic growth of 17.8%
In Q2 2026, Vertiv Holdings Co's revenue reached $3,274.3 million, up 24.1% year-over-year. Organic growth, excluding currency and acquisitions, was 17.8%. The company highlights growth in the Americas (+29.2%) and Asia-Pacific (+28.5%), while EMEA was nearly flat (+1.7%).
The report mentions minor timing shifts in revenue due to supply chain congestion and multi-phased project execution. Nevertheless, the company raised its full-year revenue guidance to $14,000 million, implying organic growth of about 31%.
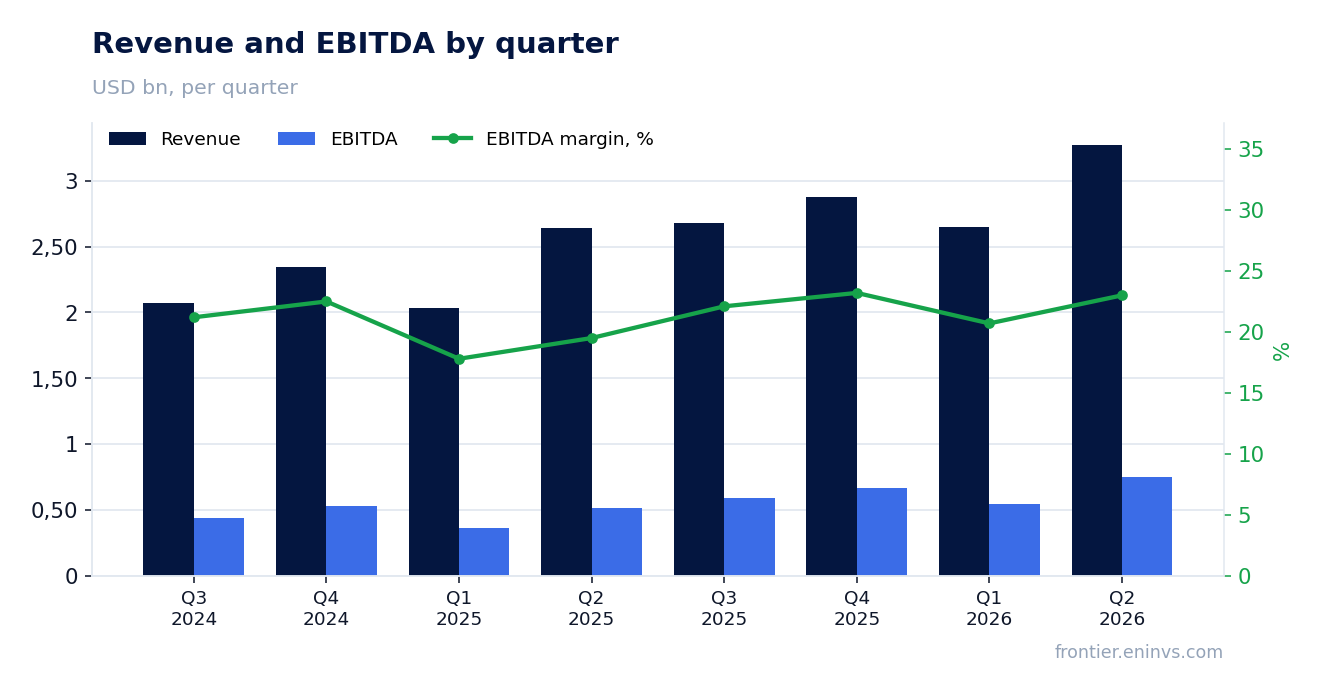
EBITDA margin expanded by 3.5 pp to 23.0% on operational efficiency and favorable price-cost
EBITDA in Q2 rose 46.2% to $753.7 million, with an EBITDA margin of 23.0% versus 19.5% a year earlier. The company attributes the margin expansion to operational execution, continued productivity, and favorable price-cost, including tariff impacts and countermeasures.
Operating profit increased 44% to $637.9 million, and adjusted operating margin was 22.6% – up 410 basis points year-over-year. Margin expansion is the key driver allowing profit to grow faster than revenue.
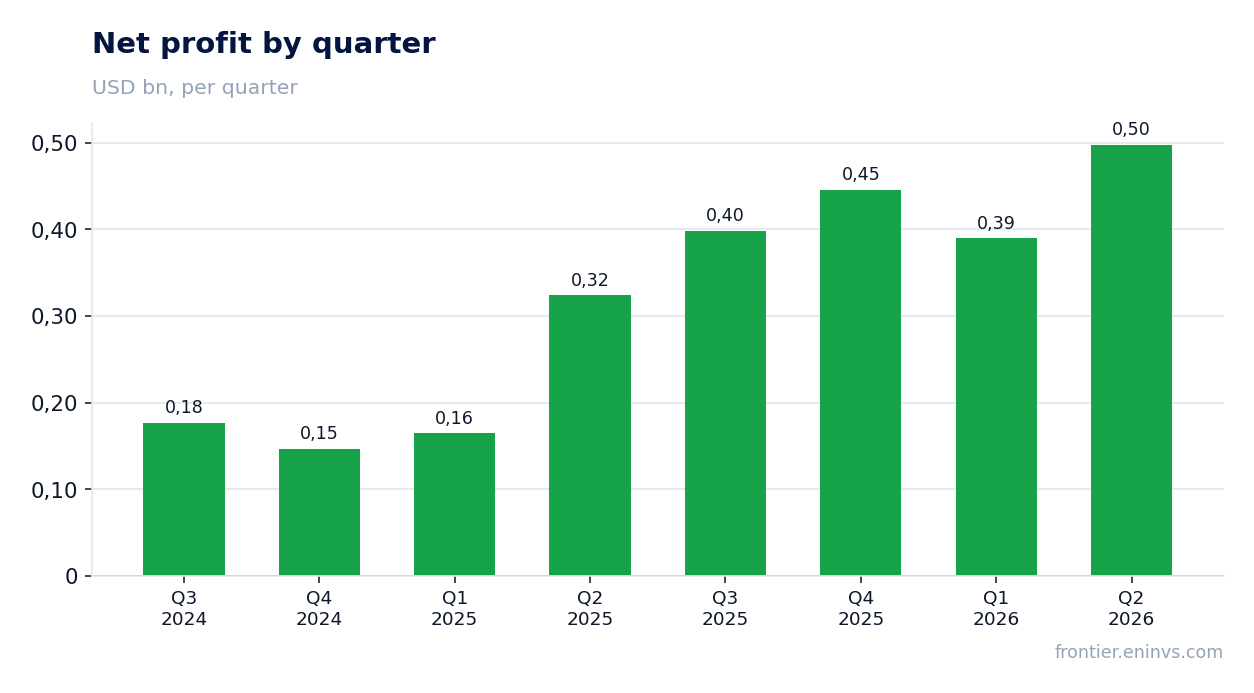
Net profit rose 53.5% to $497.8 million, with one-off items adding about $100 million
Net profit for Q2 was $497.8 million, up 53.5% year-over-year. Diluted EPS rose to $1.27. The profit includes one-off items: remeasurement of contingent consideration for the PurgeRite acquisition (+$28.8 million), restructuring costs (-$3.9 million), and M&A costs (+$1.9 million). Excluding these, adjusted EPS would have been $1.52, up 60% from a year ago.
Thus, roughly $100 million of net profit (or about $0.25 per share) is related to one-off and non-operating items. Still, operating performance remains the main growth driver.
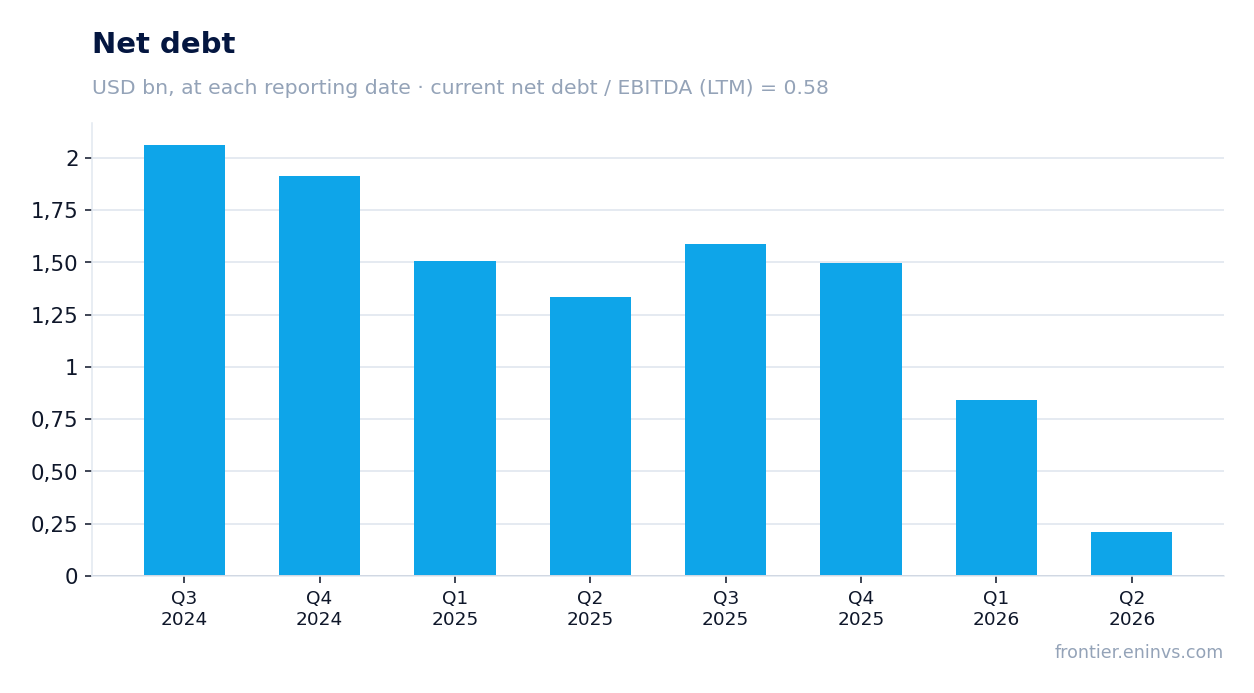
Operating cash flow reached $1,099.8 million, and the company achieved a net cash position
In Q2, operating cash flow was $1,099.8 million – almost 3.4 times higher than a year earlier. Adjusted free cash flow reached $925.3 million, up 234%. The company attributes the increase to working capital efficiency and lower cash interest.
At quarter-end, Vertiv had $5.6 billion in liquidity and a net cash position: net debt fell to $211.2 million (from $1,336.5 million a year earlier). Capital expenditures in Q2 were $174.5 million, in line with plans to invest in capacity expansion.
The company raised its 2026 guidance: revenue of $14,000 million and adjusted EPS of $6.70
Vertiv raised its full-year 2026 guidance across all key metrics. It expects revenue in the range of $13,800–14,200 million (midpoint $14,000 million), with organic growth of 30–32%. The adjusted EPS guidance was raised to $6.65–$6.75 (midpoint $6.70), implying 60% growth over 2025.
The company also confirmed capital expenditures of about 4% of revenue and expects adjusted free cash flow of $2,400–2,600 million. The guidance raise reflects management's confidence in sustained demand for AI infrastructure.
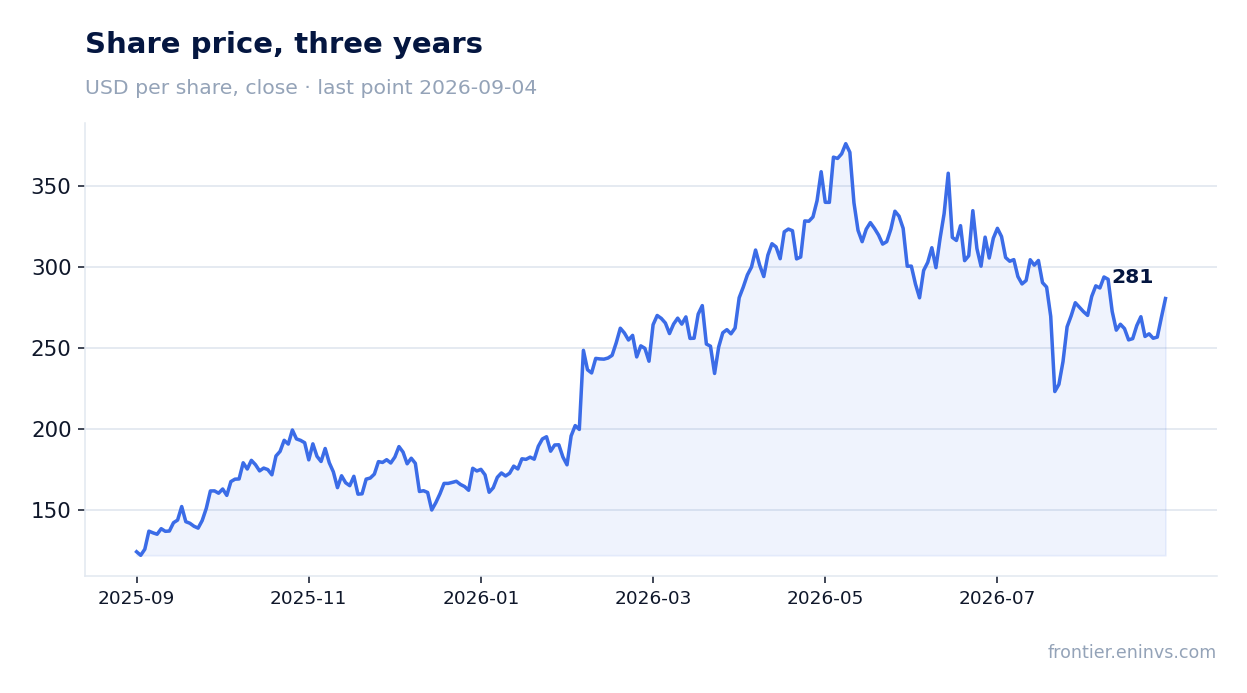
Shares fell 17.3% on the release day but have since recovered 4.1%
The closing price before the release was $269.56, and shares fell 17.3% on the release day. From the release to September 4, the stock recovered 4.1%, partially offsetting the drop. Market capitalization stands at $112,709.9 million.
The decline likely reflects profit-taking after a strong rally rather than deteriorating fundamentals. Over the last twelve months, revenue reached $11,500 million, net profit $1,732 million, and EBITDA $2,591 million.
The portal's model implies 16% upside to the current price
Our fundamental value-creation model, based on EBITDA growth and a target multiple, implies 16% upside to the current price. This is the portal's model estimate, not a market consensus or a target price.
The share is held in the 'US AI infrastructure' strategy on the portal. This is a fact, not an argument for the verdict: membership follows the strategy's screen, not our assessment.
Valuation on the latest reported figures
| Metric | Value |
|---|---|
| Market cap | 113 bn USD |
| P/E (LTM) | 65.1 |
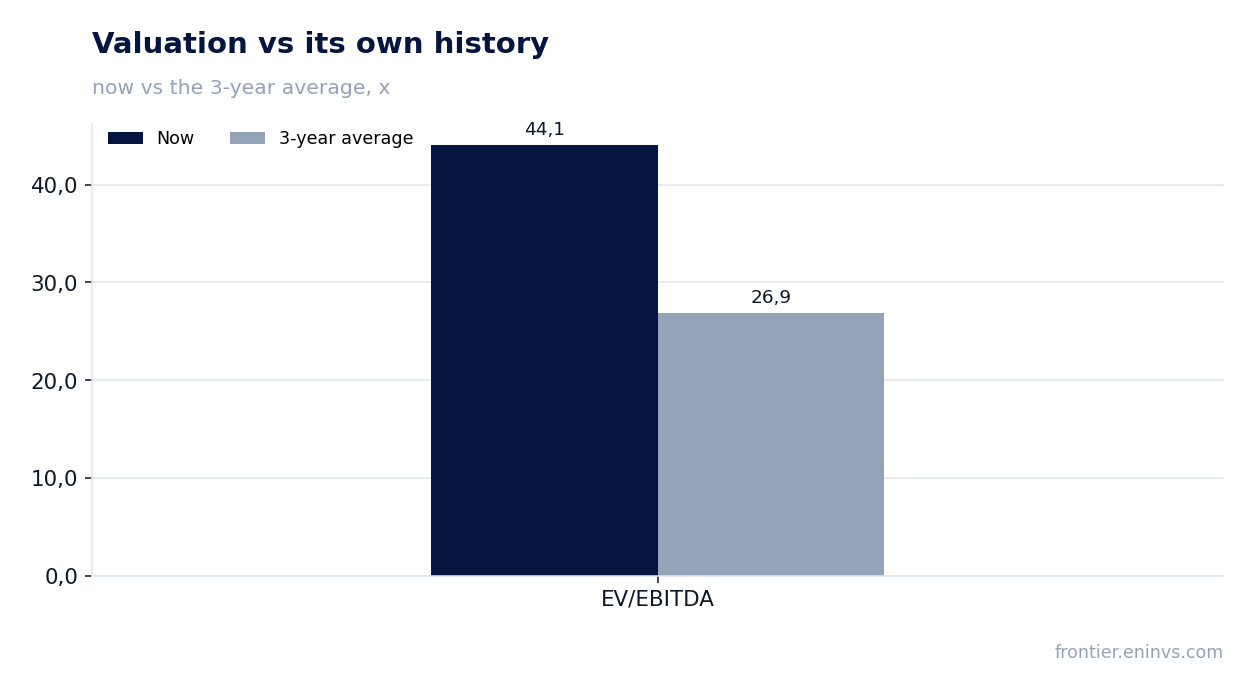
| EV/EBITDA (LTM) | 44.1 |
| P/B | 28.60 |
| Net debt / EBITDA (LTM) | 0.58 |
| Operating cash flow (LTM) | 2.10 bn |
| ROE | 44.2% |
| Dividend yield (12m) | 0.1% |
| EV/EBITDA, 3-year average | 26.9 |
Bottom line
Vertiv's Q2 2026 report is strong: revenue growing 24%, EBITDA margin expanding to 23%, operating cash flow at a record $1.1 billion, and a net cash position. The raised full-year guidance confirms management's confidence in sustained demand. However, the stock trades at a premium to its own history: EV/EBITDA LTM is 1.6 times above the three-year average. The portal's model implies 16% upside, making the share rather attractive but not cheap. The key question for holders is whether the company can continue to justify high expectations with growth and margins.
Open the company's financial profile VRT →
See also: market overview · valuation map · stock screeners