VERIZON COMMUNICATIONS INC: record EBITDA and subscriber growth, but net profit fell 23% on one-off charges

24 июля 2026 года VERIZON COMMUNICATIONS INC раскрыла результаты за второй квартал 2026 года. Выручка снизилась на 0,7% до 34,3 млрд долл., однако скорректированная EBITDA выросла на 7,0% до рекордных 13,7 млрд долл., а чистая прибыль упала на 23,3% до 3,8 млрд долл. из-за разовых списаний в 1,8 млрд долл. Акции на релизе выросли на 5,8%, и по нашей оценке бумага выглядит привлекательно: операционный импульс силён, а оценка (EV/EBITDA 8,1 против среднего 7,7 за три года) близка к исторической, при этом дивидендная доходность превышает 5,5%.
Key takeaways
— Revenue in Q2 fell 0.7% due to a 20% drop in equipment revenue, but service revenue grew 3.5%
— Record adjusted EBITDA of $13.7 billion driven by subscriber growth and lower churn
— Net profit fell 23.3% due to one-off charges of $1.8 billion, including a $746 million loss on business disposal
— Operating cash flow in Q2 rose 16.3% to $10.4 billion, free cash flow up 24.4% to $6.4 billion
— Company raised full-year guidance for mobility and broadband service revenue growth to 2.5–3.0%
— Leverage: net debt/EBITDA stands at 3.53, above the three-year average
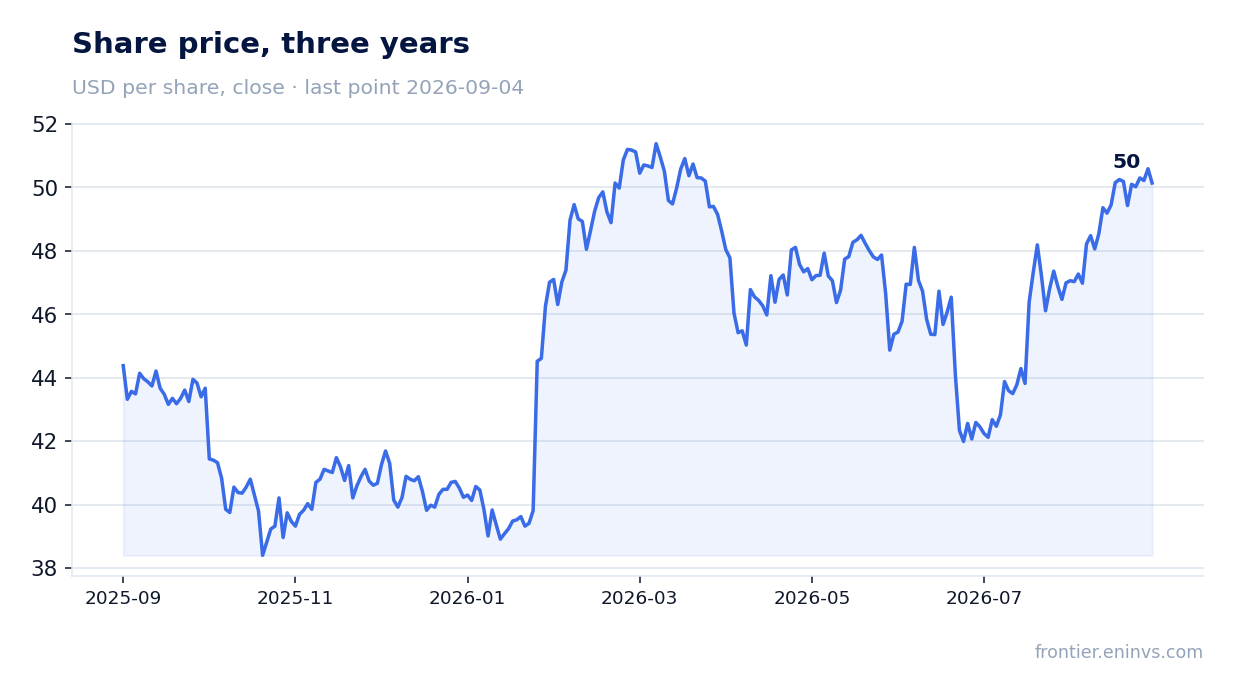
— Shares are up 14.4% since the release, but the portal's model implies -2% upside
Attractiveness
Key figures, USD bn
| Metric | Q2 2025 | Q2 2026 | Change |
|---|---|---|---|
| Revenue | 34.5 | 34.3 | -0.7% |
| EBITDA | 12.8 | 13.7 | +7.0% |
| Operating profit | 8.17 | 7.18 | -12.2% |
| Net profit | 5.00 | 3.83 | -23.3% |
| Operating cash flow | 8.97 | 10.4 | +15.9% |
| Capex | 3.81 | 5.08 | +33.4% |
| EBITDA margin | 37.1% | 40.0% | +2.9 pp |
| Net margin | 14.5% | 11.2% | -3.3 pp |
Revenue in Q2 fell 0.7% due to a 20% drop in equipment revenue, but service revenue grew 3.5%
In Q2 2026, VERIZON COMMUNICATIONS INC's total revenue was $34.3 billion, down 0.7% year-over-year. The decline is entirely due to a 19.7% drop in equipment revenue to $5.0 billion. The company is deliberately reducing device subsidies, and customers are keeping phones longer: the average time between upgrades continues to rise.
Service revenue, however, grew 3.5% to $29.2 billion. Within it, mobility and broadband service revenue rose 2.8% to approximately $23.4 billion. The company expects this metric to accelerate to about 4.0% in Q4 2026.
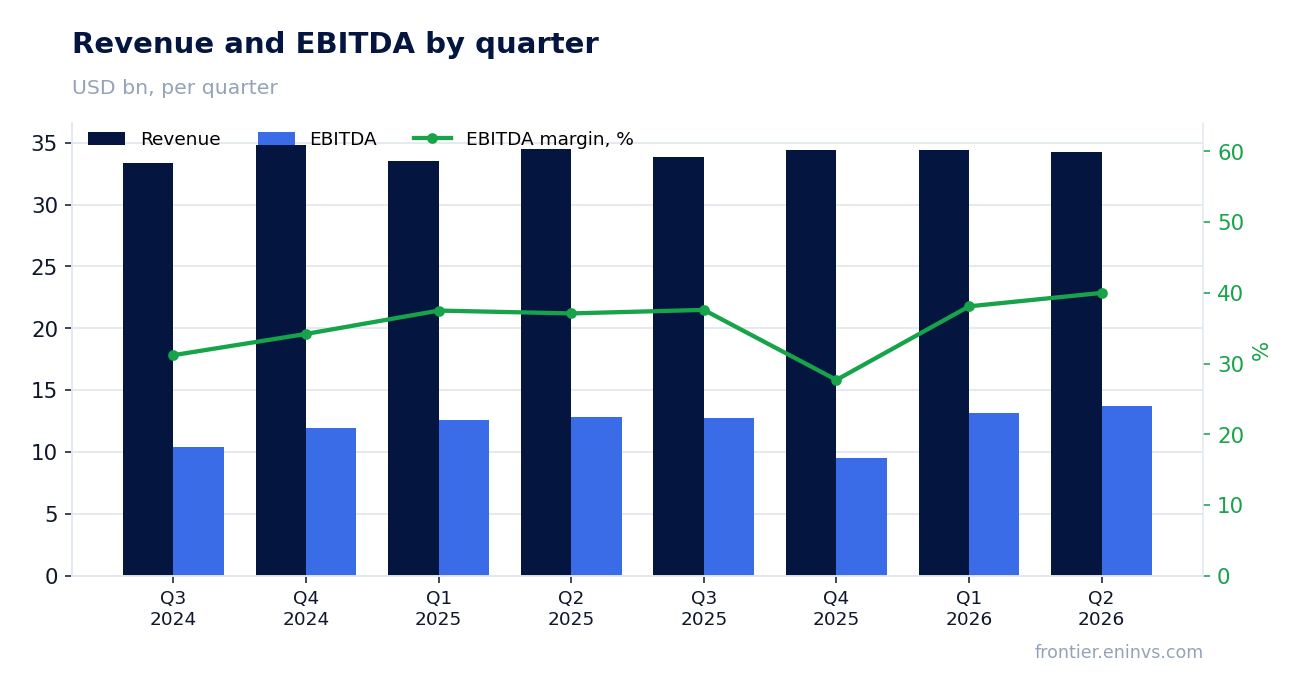
Record adjusted EBITDA of $13.7 billion driven by subscriber growth and lower churn
Adjusted EBITDA in Q2 2026 reached $13.7 billion – the highest in the company's history. Growth was 7.0% year-over-year, and EBITDA margin expanded from 37.1% to 40.0%. The company attributes this to improved unit economics: postpaid phone churn fell to 0.92% from 0.97% a year earlier, and postpaid phone net additions were 184,000 – the best Consumer segment result in five years.
Broadband also grew: 348,000 net additions in the quarter, including 193,000 fixed wireless access (FWA) and 155,000 fiber lines. Total FWA and fiber connections now stand at approximately 17.1 million.
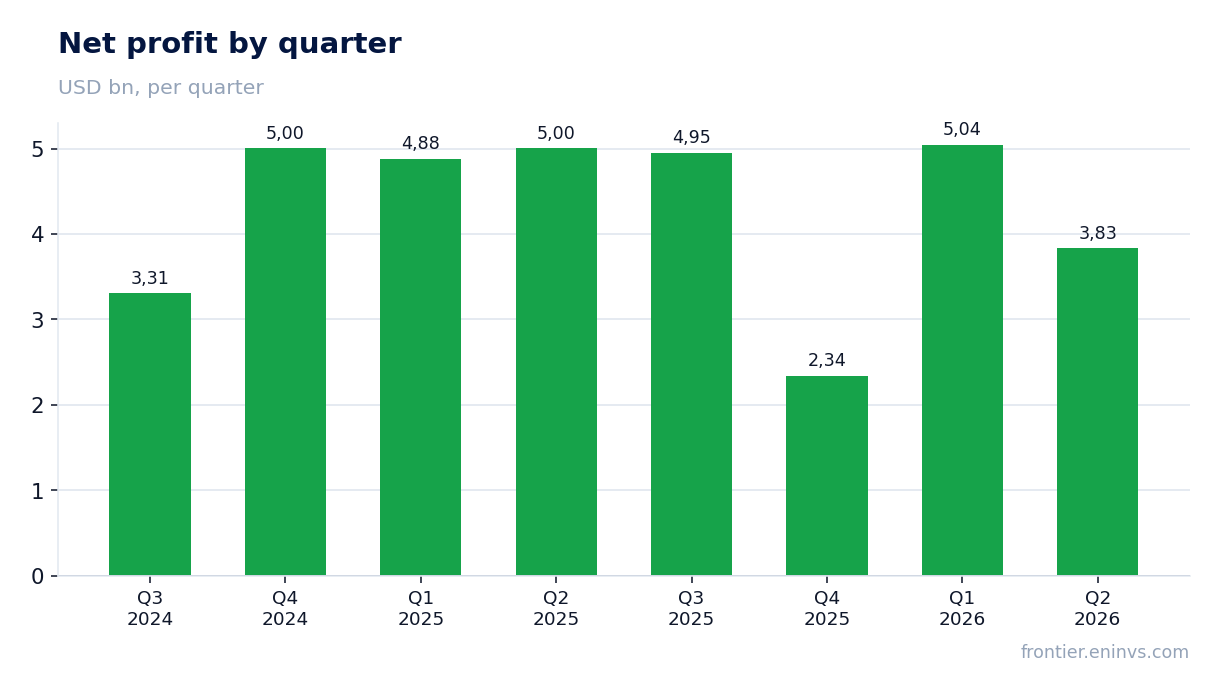
Net profit fell 23.3% due to one-off charges of $1.8 billion, including a $746 million loss on business disposal
Net income attributable to Verizon shareholders in Q2 was $3.8 billion, down 23.3% year-over-year. The driver was pre-tax special items of $1.8 billion, including a $746 million loss on disposal of business (international wireline connectivity and managed network services reclassified as held for sale), asset rationalization charges of $258 million, and severance charges of $397 million.
Excluding these items, adjusted EPS rose 6.6% to $1.30 from $1.22 a year earlier. The company raised its full-year adjusted EPS guidance to $4.99–$5.04, implying 6–7% growth.
Operating cash flow in Q2 rose 16.3% to $10.4 billion, free cash flow up 24.4% to $6.4 billion
In Q2 2026, operating cash flow was $10.4 billion, up 16.3% year-over-year. Capital expenditures rose to $5.1 billion (from $3.8 billion a year earlier), but free cash flow still jumped 24.4% to $6.4 billion.
In H1, operating cash flow grew 9.9% to $18.4 billion, and free cash flow rose 16.0% to $10.2 billion. The company raised its full-year free cash flow guidance to $21.9–$22.1 billion (9–10% growth).
Company raised full-year guidance for mobility and broadband service revenue growth to 2.5–3.0%
Verizon raised its full-year 2026 guidance for the second consecutive quarter. The company now expects mobility and broadband service revenue growth of 2.5–3.0% for the year (previously approximately 2.5%). In Q4, growth should accelerate to approximately 4.0%.
The forecast for total retail postpaid phone net additions was raised to the upper half of the 750,000–1.0 million range, which is 2–3 times the 2025 result. Capital expenditures guidance remains at $16.0–$16.5 billion.
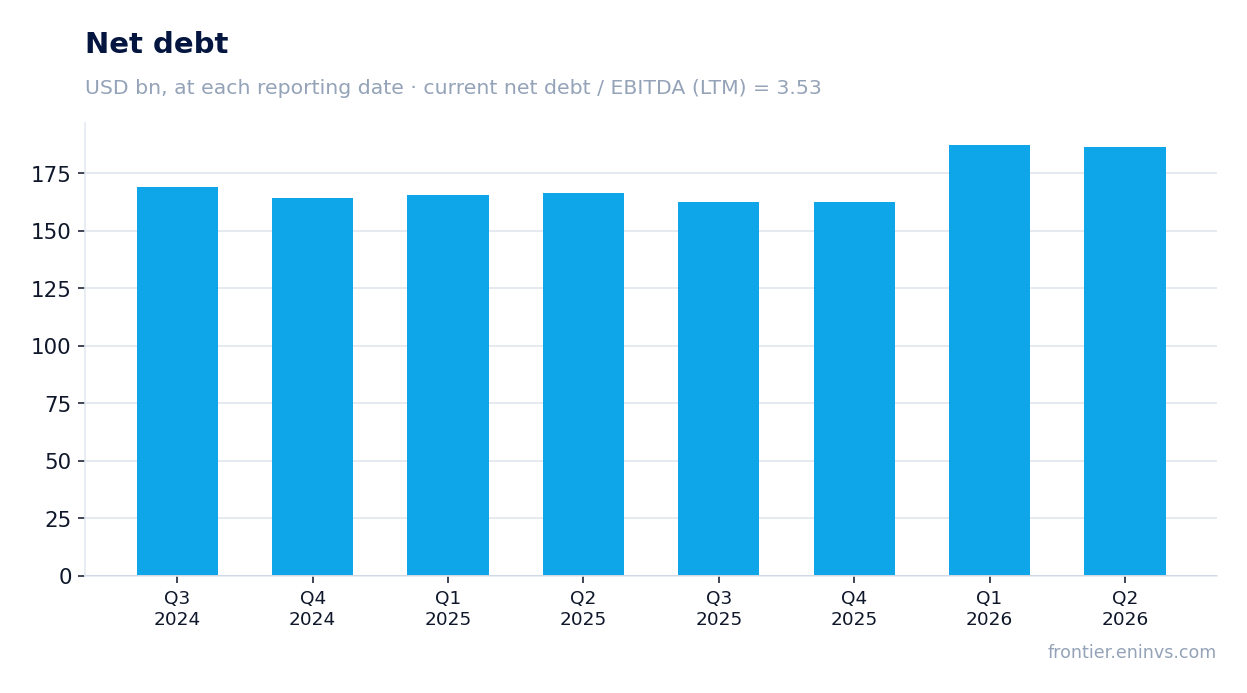
Leverage: net debt/EBITDA stands at 3.53, above the three-year average
At the end of Q2 2026, net debt stood at $186.7 billion, up $20.2 billion over the past 12 months. Net debt/EBITDA (LTM) is 3.53. This is notably high for a telecom and reflects significant investment in network and spectrum, as well as share buybacks.
The company also reports an alternative metric – net unsecured debt to adjusted EBITDA: 2.5x at quarter-end versus 2.2x at end-2025. The debt increase partly reflects acquisitions: in H1, the company spent $9.5 billion on business acquisitions.
Shares are up 14.4% since the release, but the portal's model implies -2% upside
Following the July 24 release, shares rose 5.8% on the day and another 14.4% by September 4. Market capitalization reached $211.9 billion.
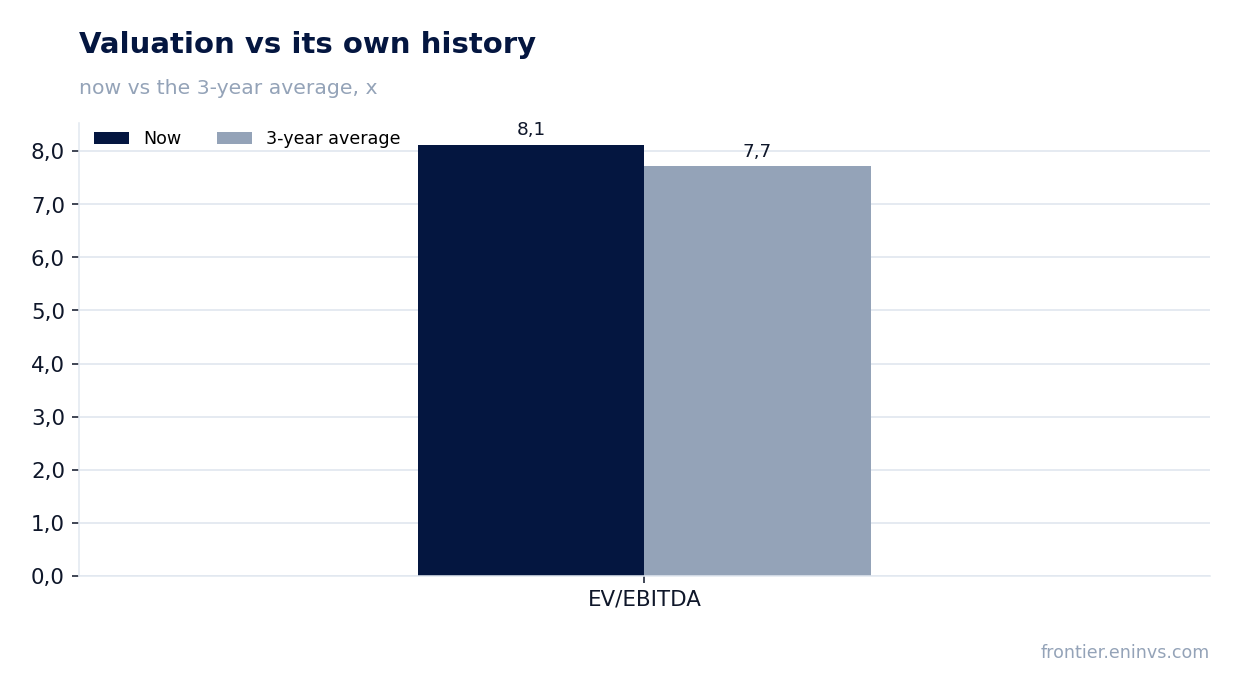
EV/EBITDA (LTM) is 8.1 versus the three-year average of 7.7. According to the portal's model, which compares EBITDA growth against a target multiple, the upside to fair value is -2% – meaning the stock trades near the model's fair value.
Valuation on the latest reported figures
| Metric | Value |
|---|---|
| Market cap | 212 bn USD |
| P/E (LTM) | 13.1 |
| EV/EBITDA (LTM) | 8.1 |
| P/B | 2.00 |
| Net debt / EBITDA (LTM) | 3.53 |
| Operating cash flow (LTM) | 37.1 bn |
| ROE | 14.6% |
| Dividend yield (12m) | 5.6% |
| EV/EBITDA, 3-year average | 7.7 |
Bottom line
Verizon's Q2 2026 report is operationally strong: record EBITDA, accelerating service revenue growth, lower churn, and raised guidance. One-off charges distorted net profit, but adjusted metrics confirm the improving trend. The main question for holders is leverage: net debt at 3.53x EBITDA and a $20 billion increase in debt over the year require discipline in buybacks and capex. At the current price, the stock looks fairly valued: EV/EBITDA is slightly above its own three-year average, and the portal's model implies -2% upside. The 5.6% dividend yield remains attractive, but its sustainability depends on generating free cash flow at the guided levels.
Open the company's financial profile VZ →
See also: market overview · valuation map · stock screeners